
ASRock was one of the earliest vendors to cater to the small-form factor (SFF) PC market with a host of custom-sized motherboards based on notebook platforms in their Vision / Core series units. They ended up missing the NUC bus for the most part, with the Beebox series put into cold storage after Skylake and Kaby Lake were phased out. The industrial design and learnings from the Beebox have since been passed on to ASRock Industrial for systems catering to the commercial and embedded markets.
After Kaby Lake, ASRock shifted focus to Intel’s 5×5 mini-STX form-factor introduced in 2015. While allowing for installation of socketed processors, the form-factor could not support a discrete GPU slot. Around the same time, Intel also started marketing enthusiast NUCs with a discrete notebook GPU soldered on the motherboard / integrated in the package. ASRock has introduced multiple Intel and AMD-based mini-STX DeskMini systems since 2016, and also created the micro-STX form-factor to offer a socketed alternative to the enthusiast NUCs.
Intel’s next big push in the NUC market came with the appearance of Compute Elements and Extreme NUCs, with the latter supporting user-replaceable discrete GPUs. In order to offer alternatives in that segment, ASRock introduced their DeskMeet product line early last year with support for socketed processors and a PCIe x16 slot for installing add-in cards. The review below provides a detailed analysis of the features, performance, and value proposition of the DeskMeet B660 – a 8L SFF PC based on the Intel B660 chipset, capable of accommodating Alder Lake or Raptor Lake CPUs, and selected dual-slot GPUs.
The increase in the capabilities and power efficiency of processors, coupled with innovative thermal solutions has also enabled small-form factor machines to enter markets that were restricted to bulky power-hungry tower form-factor machines in the past. While a majority of the SFF and UCFF machines in the market are typically based on sub-45W processors, there is a growing market (in the gaming and workstation space) for small systems that can accommodate socketed CPUs. ASRock’s DeskMini series of mini-STX and micro-STX machines have served this market since the Skylake days. Coinciding the with the launch of Intel’s Alder Lake, ASRock introduced a new option for consumers in a slightly larger form-factor – the DeskMeet B660.
The DeskMeet B660 focuses on the DIY market for gaming and e-sports systems. This segment has served as a growth vector for the otherwise moribund PC market over the last several years. Portabile gaming PCs have the added advantage of being compact, lending themselves to use-cases that are not easily served by traditional tower desktops. Compared to the DeskMini mini-STX series, the new systems bring the following updates:
- PCIe 4.0 x16 slot allowing the installation of a dual-slot discrete GPU
- Increased memory capacity, thanks to the presence of four full-length DDR4 DIMM slots
- Integrated PSU
The package includes the following components:
- ASRock B660-ITX motherboard (with associated cables, screws, and an I/O shield)
- 500W (80+ Bronze) ATX PSU
- Metal chassis (168mm x 219.3mm x 218.3mm) (with associated assembling aids)
- Assembly instructions
Compact systems with a PCIe x16 slot and an integrated PSU can be realized with mini-ITX motherboards. Such standard boards are restricted to two DIMM slots due to space constraints. In order to accommodate two additional DIMM slots, ASRock has opted for a propretiary form-factor. Their ‘Deep mini-ITX’ board measures 210mm x 170mm (compared to the 170mm x 170mm of a regular mini-ITX board).

End-users have the flexibility to choose their own CPU, storage device, RAM, and optional discrete GPU. Space constraints impose some limitations on these, though. The 8L system can support liquid cooling if a PCIe add-on card is not used. CPU coolers up to 54mm in height can be used (anything higher would end up bumping into the underside of the PSU). Processors with a TDP of up to 65W can be safely used in air cooling. While select 125W TDP processors are supported, it requires the use of liquid cooling (ruling out the PCIe add-on card usability). F-series SKUs can be used, but it requires the compulsory installation of a video card, as the native display outputs of the B660-ITX require a CPU with an integrated GPU.
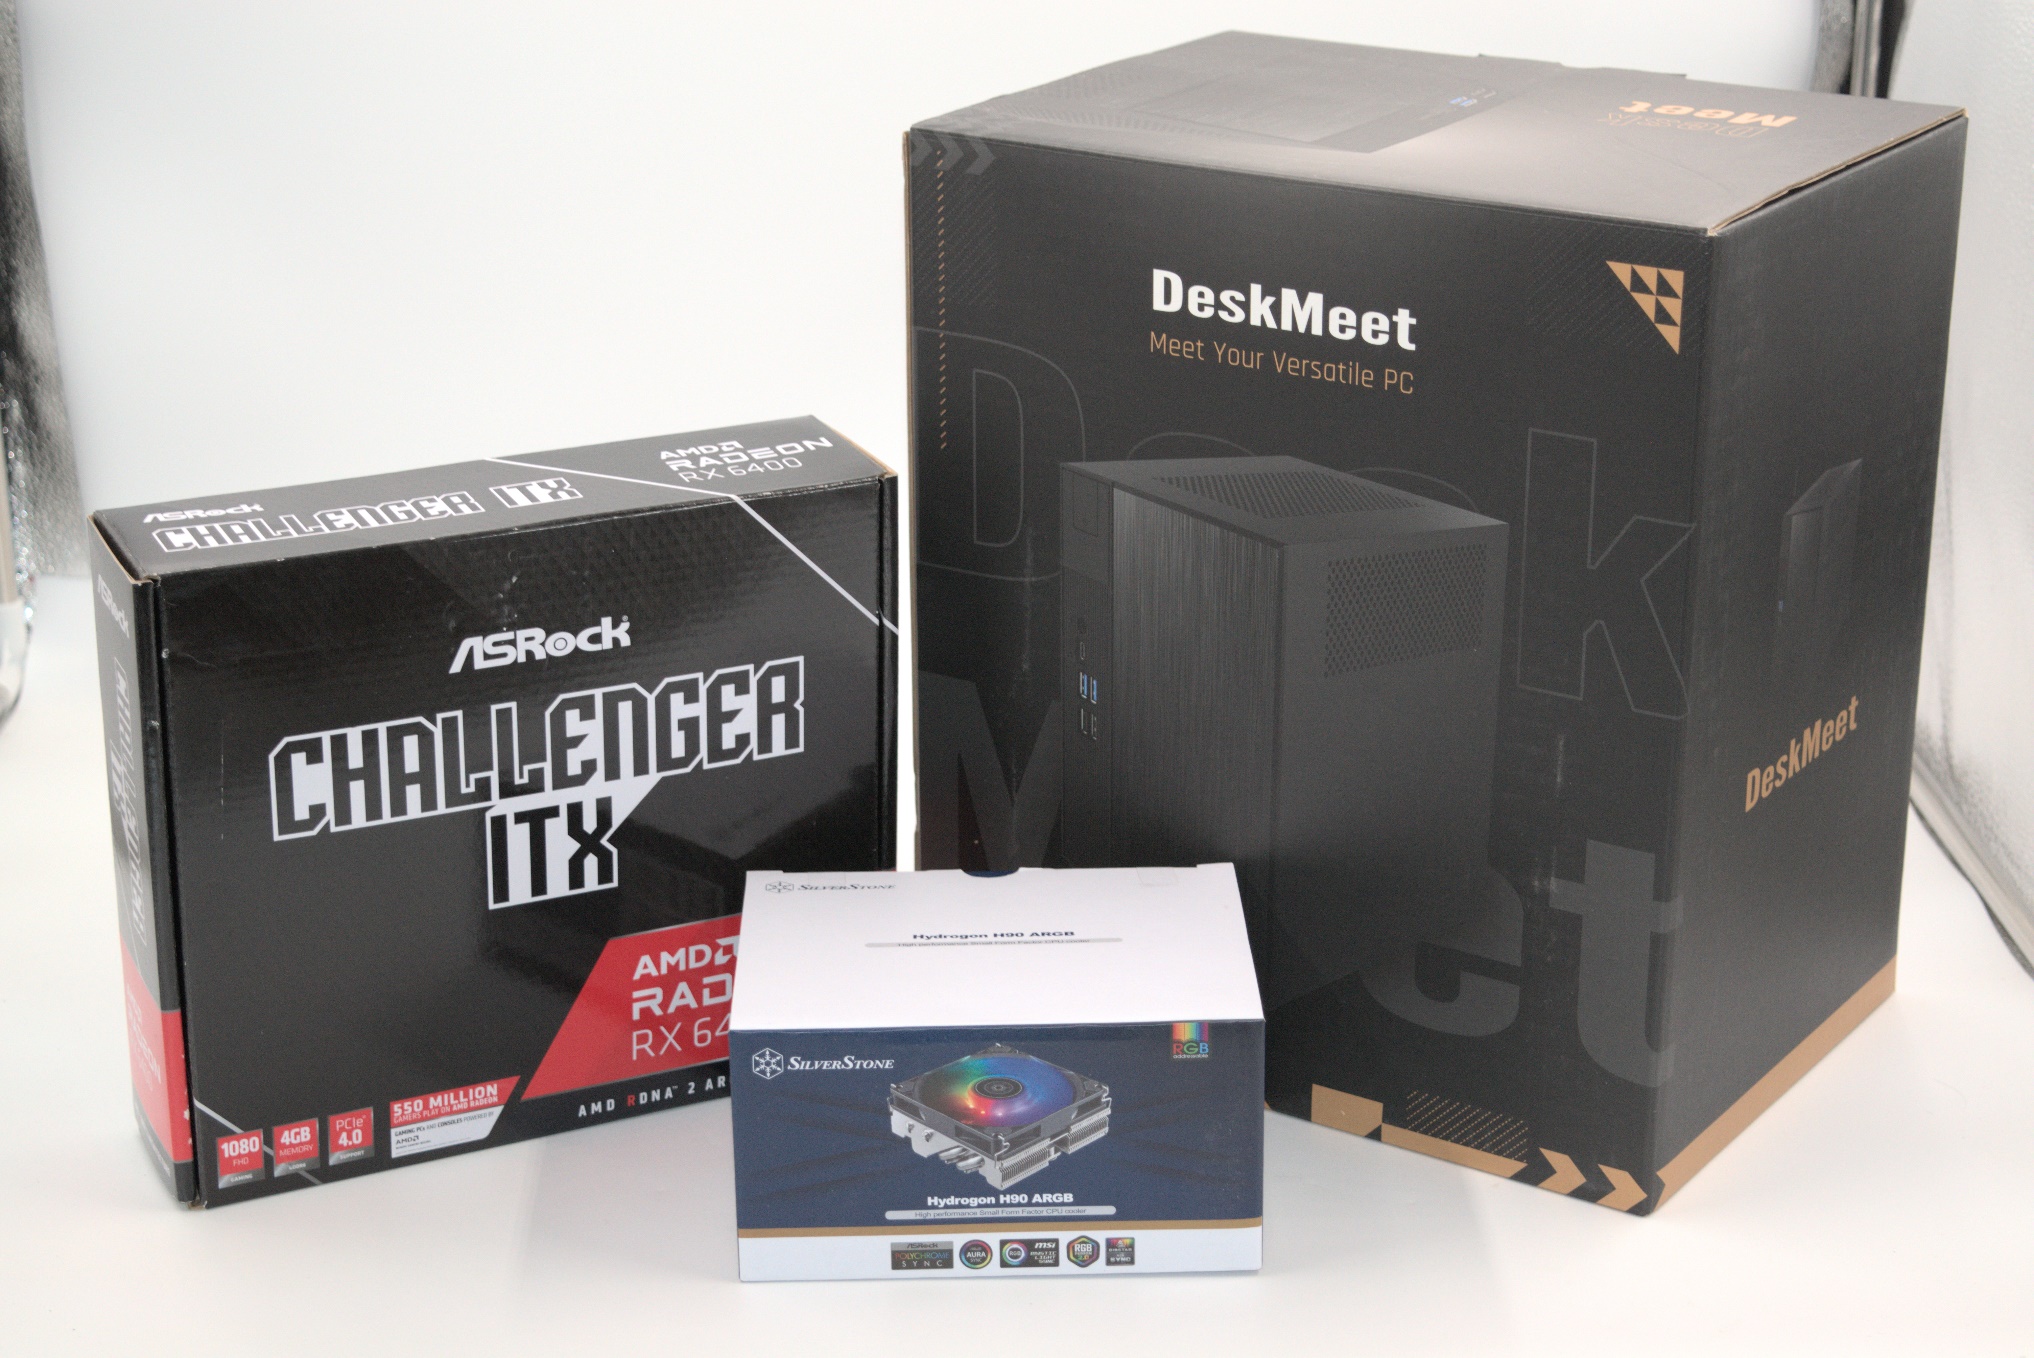
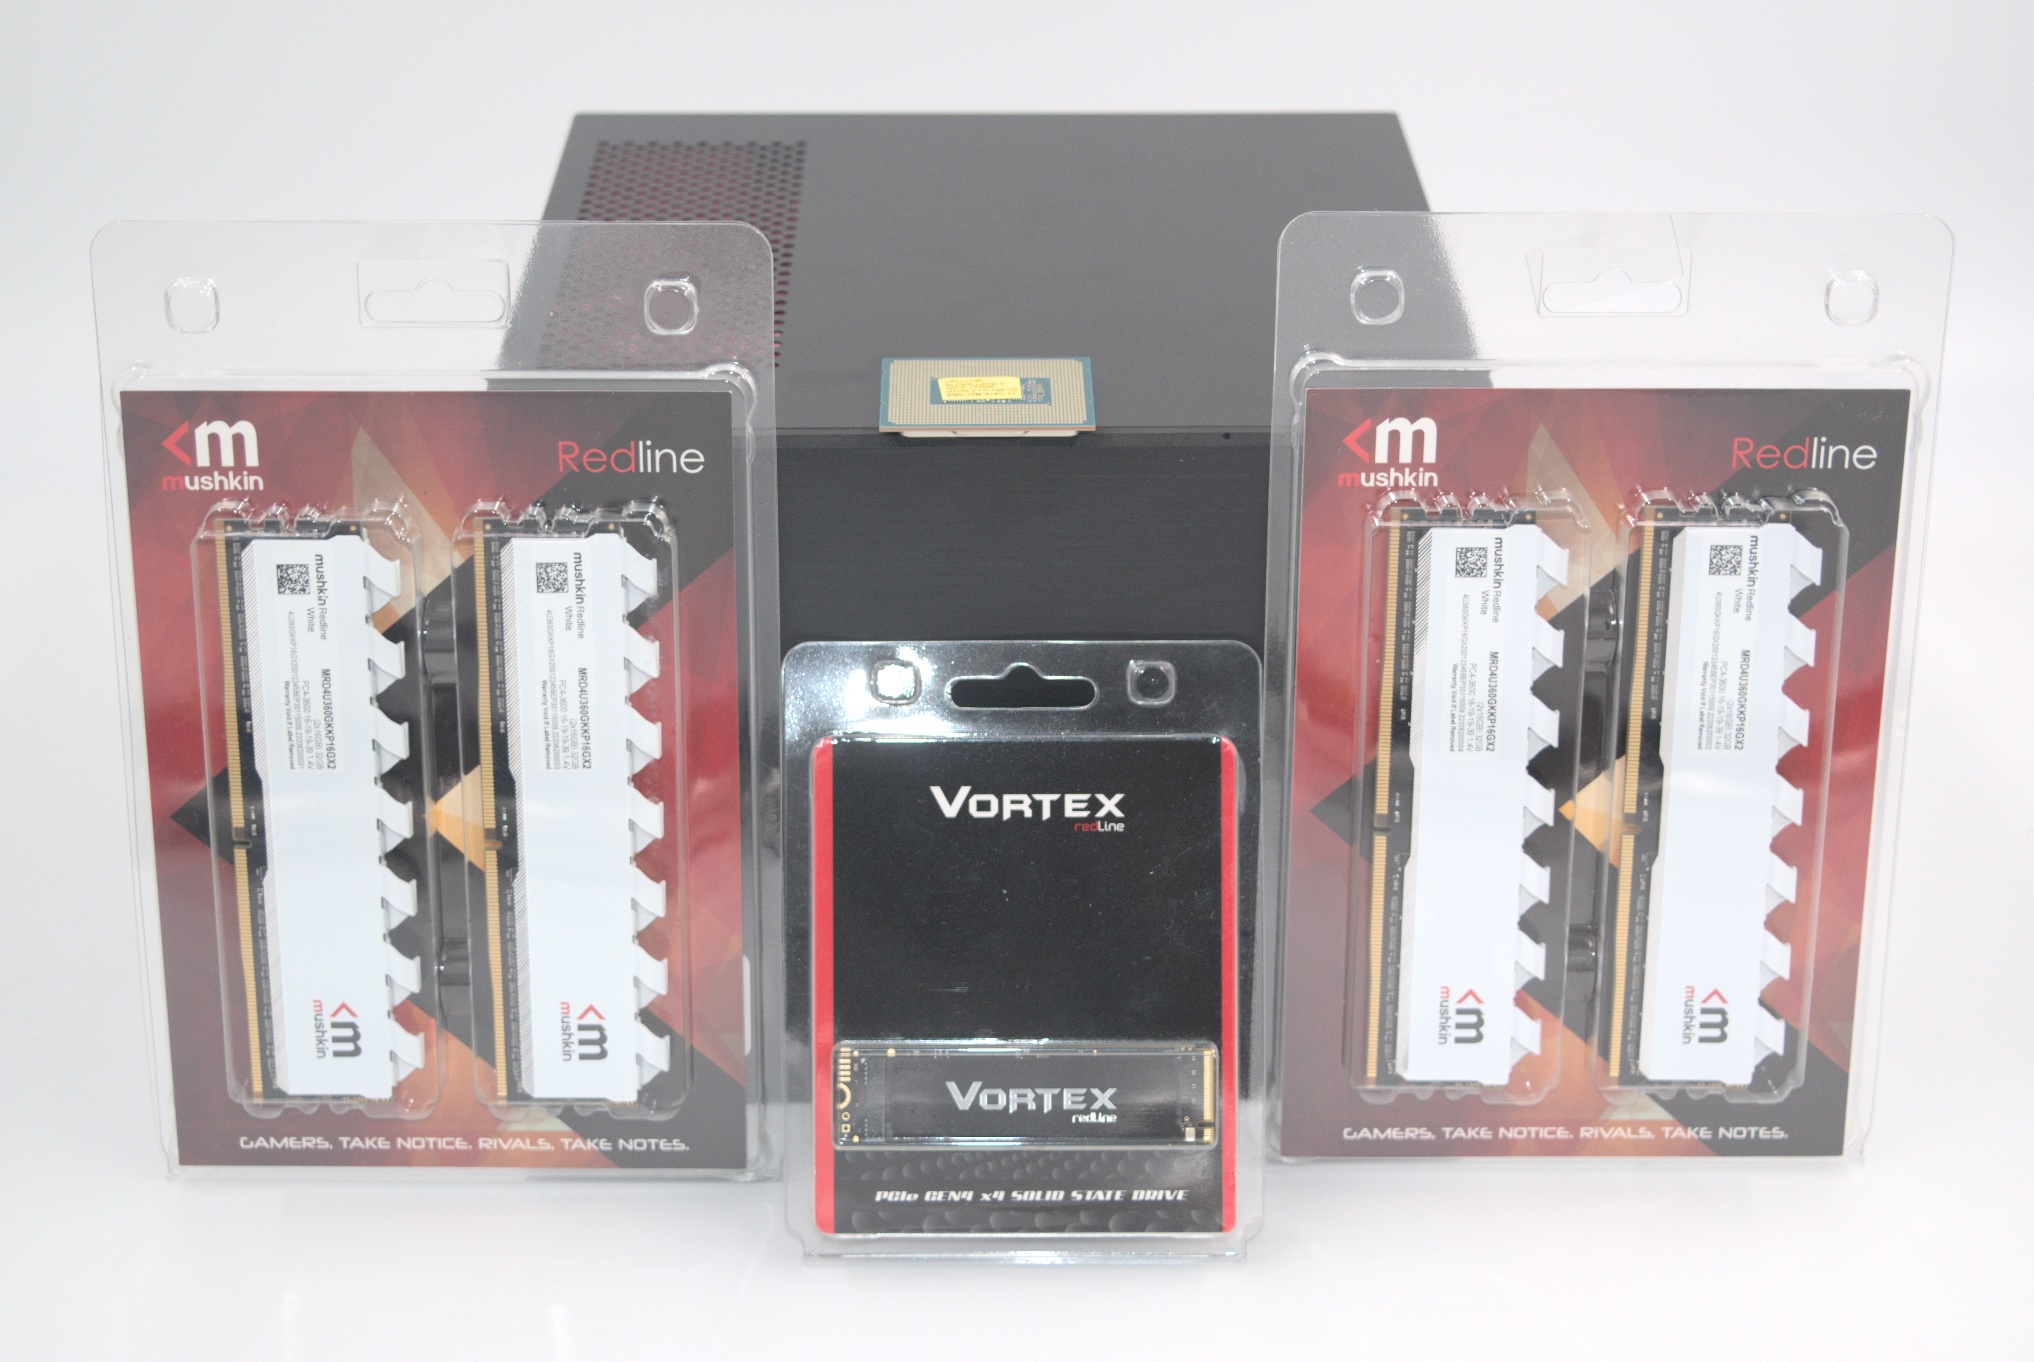
ASRock sampled us the DeskMeet B660 along with their AMD Radeon RX 6400 Challenger ITX video card and an Intel Core i7-12700F Alder Lake-S processor. The following additional components were used to complete the build:
- SilverStone Hydrogon H90 ARGB CPU cooler
- Mushkin Redline Frostbyte DDR4-3600 DIMMs (4×16 GB)
- Mushkin Vortex Redline 2 TB M.2 2280 PCIe 4.0 x4 NVMe SSD
The system is meant to be actively cooled, but the DeskMeet B660 unit by itself doesn’t have any fans bundled with the chassis. The fans in the CPU cooler and video card cooler should suffice for most installations. However, the side of the chassis close to the PCIe slot can also be used to mount a 120mm case cooler or a liquid cooling radiator (thickness up to 45mm). In such cases, the PCIe slot is rendered unusable.
The full specifications of our review configuration are provided in the table below.
| ASRock DeskMeet B660 Specifications (as tested) |
|
| Processor | Intel Core i7-12700F Alder Lake-S 8C + 4c / 20T, 1.6 – 4.9 GHz Intel 7, 12MB L2 + 25MB L3, 65 W (PL1 = 65W, PL2 = 126W) |
| Memory | Mushkin Redline Frostbyte MRX4U360GKKP16G DDR4-3600 DIMMs 16-19-19-39 @ 3600 MHz (XMP 1.0) 4×16 GB |
| Graphics | AMD Radeon RX 6400 (Navi 24) 4GB GDDR6 (768 SPs @ 2039 MHz) |
| Disk Drive(s) | Mushkin Vortex Redline MKNSSDVT2TB-D8 (2 TB; M.2 2280 PCIe 4.0 x4 NVMe;) (Micron 176L 3D TLC; InnoGrit IG5236 Controller) |
| Networking | 1x GbE RJ-45 (Intel I219-V) |
| Audio | Realtek ALC897 (3.5mm Audio Jack in Front and Line In / Speaker / Microphone Jacks in Rear) Digital Audio with Bitstreaming Support over HDMI and Display Port (via dGPU) |
| Video | 1x HDMI 2.1 (up to 4Kp60, VRR and FRL) 1x Display Port 1.4a (both via dGPU) |
| Miscellaneous I/O Ports | 2x USB 2.0 Type-A (Rear) 2x USB 3.2 Gen 1 Type-A (Rear) 1x USB 3.2 Gen 1 Type-C (Front) 2x USB 2.0 Type-A (Front) 2x USB 3.2 Gen 1 Type-A (Front) |
| Operating System | Windows 11 Enterprise (22000.1335) |
| Pricing | (Street Pricing on January 23rd, 2022) USD 191 (barebones) US $863 (as configured, no OS) |
| Full Specifications | ASRock DeskMeet B660 Specifications |
Assembling the System
The DeskMeet package comes with the PSU and the motherboard bundled inside the chassis with appropriate padding. Assembling the system involves removing a single screw from the bottom side of the case and pulling out the motherboard tray. One of the likable aspects here is that the front panel of the case directly interfaces with the components on the motherboard. This eliminates the tangling of wires that was seen in the previous DeskMini systems when separating the motherboard tray from the chassis. The motherboard comes mounted on the tray, and the CPU and cooler installation steps are no different from other boards with socketed CPUs.
Up to four DDR4 DIMMs can be installed in the system. A M.2 2230 slot is available for a Wi-Fi / Bluetooth combo PCIe / USB card. The case has appropriate holes for the antennae. There are two M.2 2280 slots (one next to the PCIe slot, and another on the underside) for installation of NVMe SSDs. The slot next on the underside is PCIe-only, while the other can accommodate both NVMe and SATA SSDs. Unfortunately, the documentation is not clear from the documentation on which of these slots is directly attached to the CPU. In other boards, the slot that multiplexes the SATA and PCIe lanes usually comes from the chipset (PCH), while the pure PCIe one is from the CPU. Based on this assumption, we reviewed the system with the SSD installed on the underside.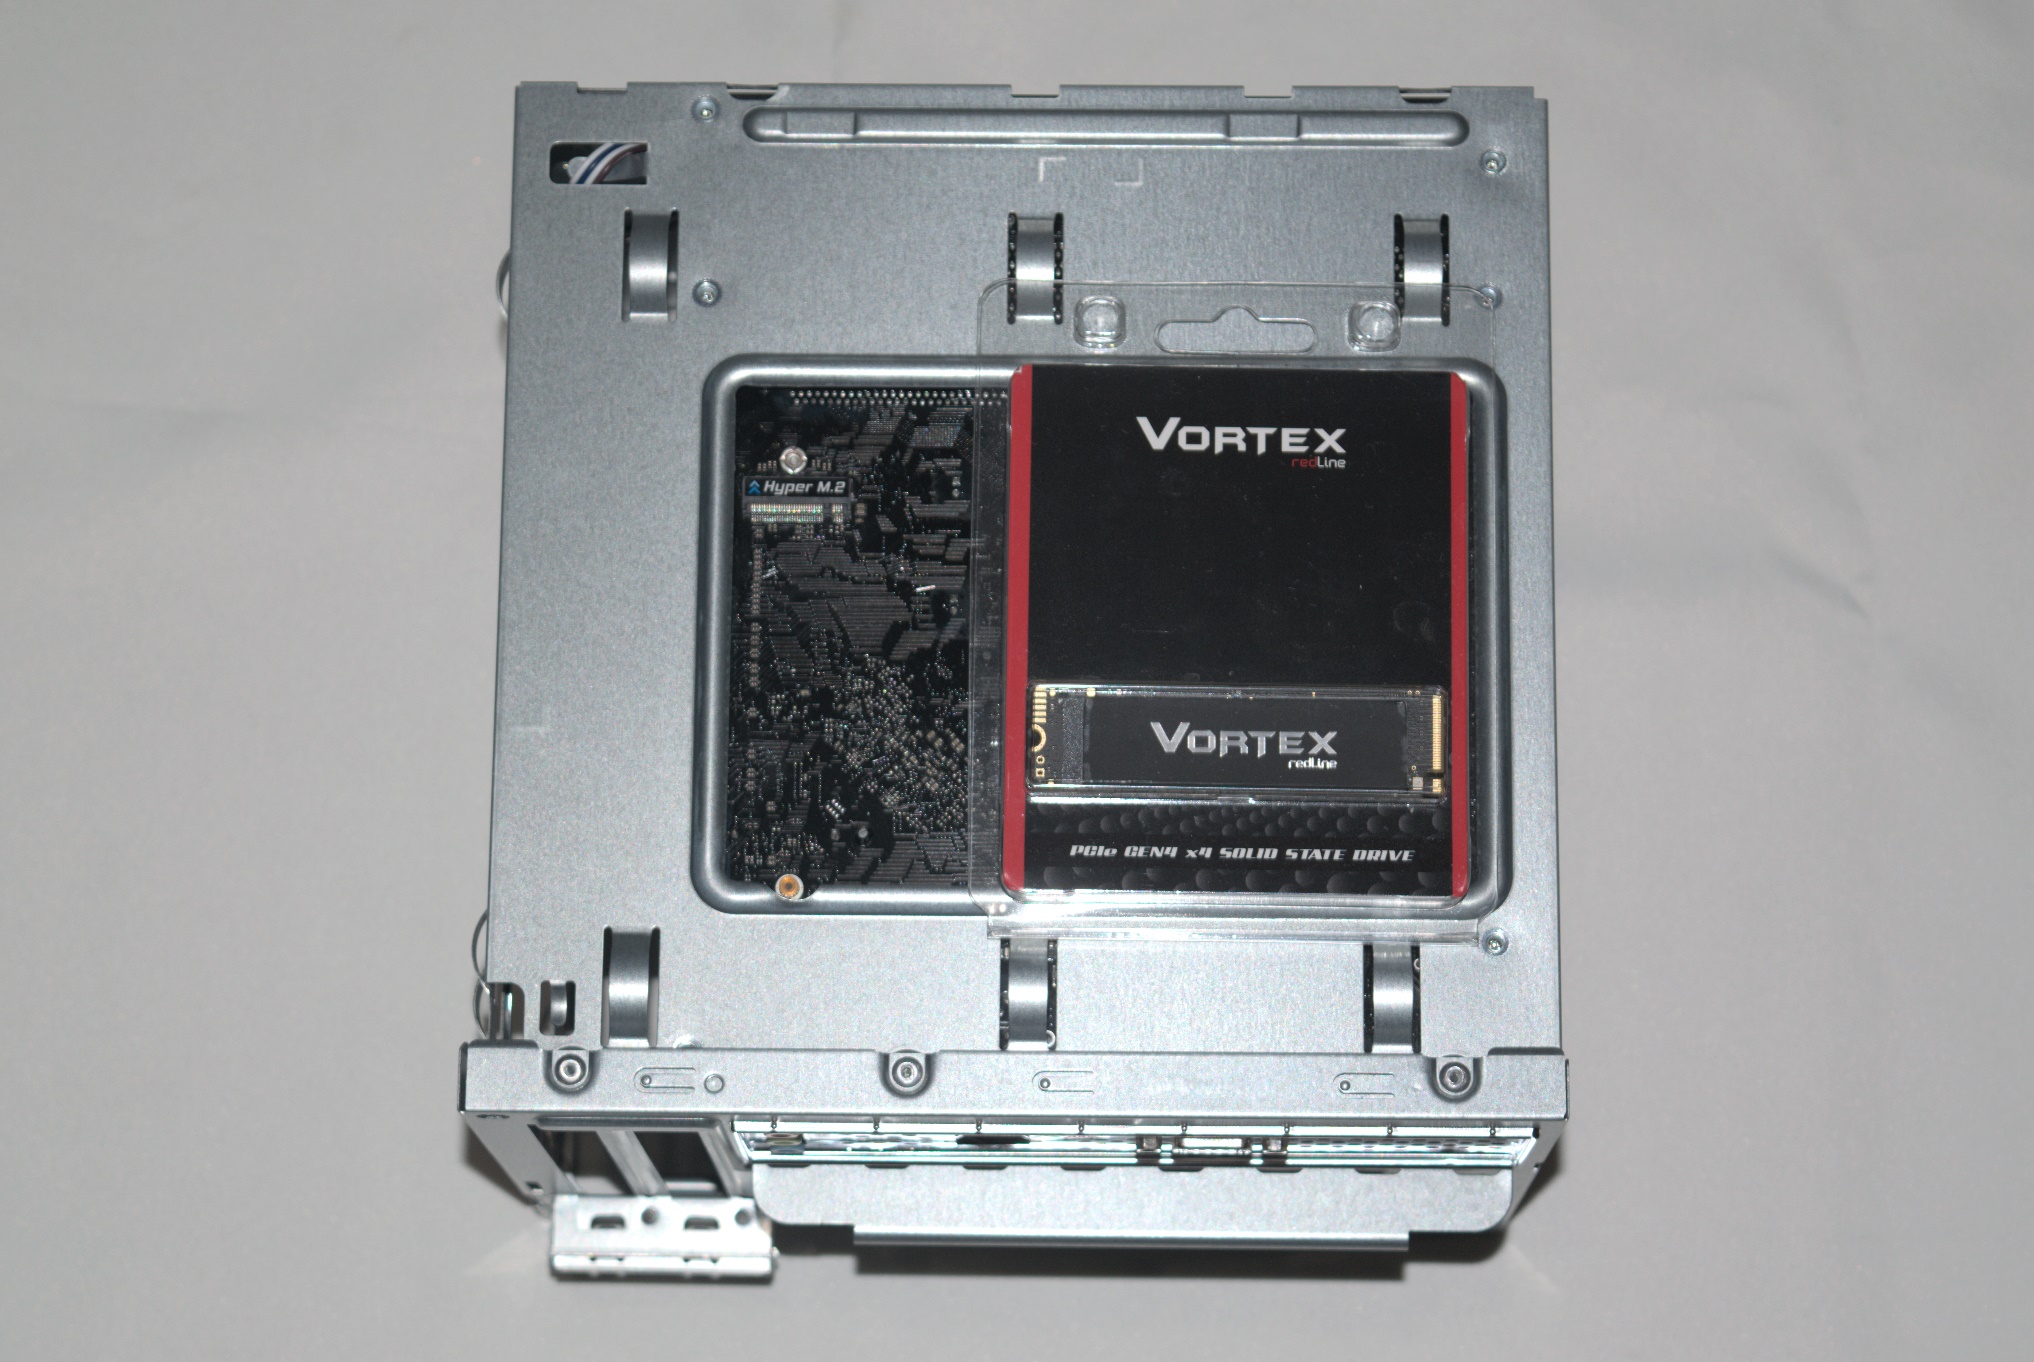
The board contains 3 SATA ports. The case itself allows for the installation of a 3.5″ HDD (in which case, a PCIe add-in card can’t be installed), or two 2.5″ drives (which eliminates the possibility of dual-slot add-in cards, while still allowing single-slot cards to work). Using such SATA drives also precludes the possibility of mounting a fan or a water-cooling radiator in the system.
GPU installation involves releasing a latch and fastening screws after placing the add-in card in place. The PSU is fastened in-place at the very end, with all necessary screws in the back panel. The PSU is not modular, but the number of cables to route is minimal, and cable management is not really much of an issue. It is possible to completely remove the motherboard and I/O shield from the tray, but we didn’t find it necessary during the assembly process.
In the next section, we take a look at the BIOS options along with an analysis of the motherboard platform. Following that, we have a number of sections focusing on various performance aspects before concluding with an analysis of the value proposition of the system.
Upon completion of the hardware configuration, the available BIOS options were looked into. The system initially came up with the four DIMMs operating at DDR4-3200, but activating the XMP profile immediately bumped it up to DDR4-3600. Since the DeskMeet B660 is a consumer-focused system, the UEFI has all the bells and whistles including the ability to update firmware directly from the Internet and fine-grained control of the fan speeds in relation to the temperatures.
By default, the BIOS opens up in the ‘Easy View’ mode which gives an overview of the system components (processor, DRAM, storage), and system information (temperature and cooling status). Boot priorities can also be modified in this view. More adventurous users can opt for the ‘Advanced Mode’ view, which allows for fine-grained overclocking of the CPU and DRAM as allowed by the system components under the ‘OC Tweaker’ tab.
Your browser does not support HTML video.
The BIOS also allows selective enabling of the P-cores and E-cores, configuring various PCIe device aspects like ASPM, SR-IOV, etc. Under the ‘Tools’ tab, support for secure erasing of SSDs is available. Other standard options like secure boot are also available.
ASRock’s documentation of the B660-ITX doesn’t unfortunately include a block diagram of the I/Os in relation to the processor and the chipset. We resorted to HWiNFO to provide us with the details after connecting different peripherals to the various USB ports and a temporary SSD to the empty M.2 NVMe SSD slot. The diagram below presents the overall high-speed I/O distribution.

The most surprising aspect gleaned from the bus organization report relates to the CPU-attached PCIe lanes for the NVMe SSD. While I had mistakenly inferred that the slot on the underside was the CPU-attached one, it turns out that the one near the PCIe add-in card slot is the ideal slot to connect the boot SSD to. Unfortunately, I realized this only after all the evaluation had been completed, but it is something that other DeskMeet B660 users can keep in mind for optimal storage performance. Other than that, all other I/Os are as expected, sourced off a single 20 Gbps USB root hub in the PCH.
In this review, we compare the DeskMeet B660 and a host of other SFF systems capable of accommodating a discrete GPU add-in card.
| Comparative PC Configurations | ||
| Aspect | ASRock DeskMeet B660 | |
| CPU | Intel Core i7-12700F Alder Lake-S 8C + 4c / 20T, 1.6 – 4.9 GHz Intel 7, 12MB L2 + 25MB L3, 65 W (PL1 = 65W, PL2 = 126W) |
Intel Core i7-12700F Alder Lake-S 8C + 4c / 20T, 1.6 – 4.9 GHz Intel 7, 12MB L2 + 25MB L3, 65 W (PL1 = 65W, PL2 = 126W) |
| GPU | AMD Radeon RX 6400 (Navi 24) 4GB GDDR6 (768 SPs @ 2039 MHz) |
AMD Radeon RX 6400 (Navi 24) 4GB GDDR6 (768 SPs @ 2039 MHz) |
| RAM | Mushkin Redline Frostbyte MRX4U360GKKP16G DDR4-3600 DIMMs 16-19-19-39 @ 3600 MHz (XMP 1.0) 4×16 GB |
Mushkin Redline Frostbyte MRX4U360GKKP16G DDR4-3600 DIMMs 16-19-19-39 @ 3600 MHz (XMP 1.0) 4×16 GB |
| Storage | Mushkin Vortex Redline MKNSSDVT2TB-D8 (2 TB; M.2 2280 PCIe 4.0 x4 NVMe;) (Micron 176L 3D TLC; InnoGrit IG5236 Controller) |
Mushkin Vortex Redline MKNSSDVT2TB-D8 (2 TB; M.2 2280 PCIe 4.0 x4 NVMe;) (Micron 176L 3D TLC; InnoGrit IG5236 Controller) |
| Wi-Fi | 1x GbE RJ-45 (Intel I219-V) | 1x GbE RJ-45 (Intel I219-V) |
| Price (in USD, when built) | (Street Pricing on January 23rd, 2022) USD 191 (barebones) US $863 (as configured, no OS) |
(Street Pricing on January 23rd, 2022) USD 191 (barebones) US $863 (as configured, no OS) |
While we have reviewed many SFF systems with discrete GPUs in the past, only the NUC Extreme models were available for re-benching again with our latest benchmark suite. The next few sections will deal with comparative benchmarks for the above systems.
Our 2022 Q4 update to the test suite for Windows 11-based systems carries over some of the standard benchmarks we have been using over the last several years, including UL’s PCMark. New additions include BAPCo’s CrossMark multi-platform benchmarking tool, as well as UL’s Procyon benchmark suite. BPACo recently updated their SYSmark benchmark suite – while operational at a basic level, it is missing key features such as energy consumption measurement. We will start including SYSmark 30 once the open issues are resolved.
UL PCMark 10
UL’s PCMark 10 evaluates computing systems for various usage scenarios (generic / essential tasks such as web browsing and starting up applications, productivity tasks such as editing spreadsheets and documents, gaming, and digital content creation). We benchmarked select PCs with the PCMark 10 Extended profile and recorded the scores for various scenarios. These scores are heavily influenced by the CPU and GPU in the system, though the RAM and storage device also play a part. The power plan was set to Balanced for all the PCs while processing the PCMark 10 benchmark. The scores for each contributing component / use-case environment are also graphed below.
| UL PCMark 10 – Performance Scores | |||

In CPU-bound components like ‘Essentials’ and ‘Productivity’, the DeskMeet B660 manages to snag one of the top two spots thanks to its CPU prowess as well as high RAM speeds. However, components that bring the GPU into the equation drag down the system – after all, a Radeon RX 6400 is no match even for a RTX 2070 when it comes to graphics capabilities. Overall, we see the DeskMeet B660 slot in just above the Ghost Canyon NUC.
UL Procyon v2.1.544
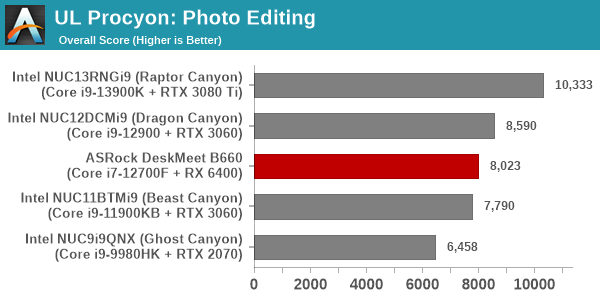
PCMark 10 utilizes open-source software such as Libre Office and GIMP to evaluate system performance. However, many of their professional benchmark customers have been requesting evaluation with commonly-used commercial software such as Microsoft Office and Adobe applications. In order to serve their needs, UL introduced the Procyon benchmark in late 2020. There are five benchmark categories currently – Office Productivity, AI Inference, Battery Life, Photo Editing, and Video Editing. AI Inference benchmarks are available only for Android devices, while the battery life benchmark is applicable to Windows devices such as notebooks and tablets. We presents results from our processing of the other three benchmarks.
| UL Procyon – Office Productivity Scores | |||
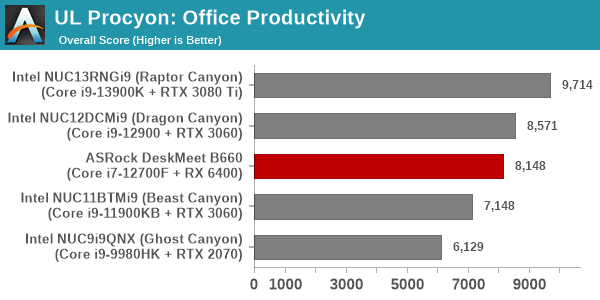
The performance of all the MS Office components follow the same pattern as per expectations – the Core i7-12700F in the DeskMeet B660 slots exactly in the middle of the pack, between the Core i9-11900KB and the Core i9-12900 in the Beast Canyon and Dragon Canyon respectively. This comes as no surprise, as the workloads are reflective of the CPU performance, with the GPU playing little to no role.
Moving on to the evaluation of Adobe Photoshop and Adobe Lightroom, we find the pattern in the scores to be similar to that of the Office workloads. The GPU again appears to play no role in the final standings.
UL Procyon evaluates performance for video editing using Adobe Premier Pro, and GPU acceleration plays a significant role here. The Radeon RX 6400 has no encoding acceleration capabilities for any codec, and the workload falls back purely to the CPU. This is no match for the hardware-accelerated scenarios in all the NUC Extreme models, resulting in the DeskMeet B660 coming in last in video editing performance.

Given the absence of SYSmark scores and workload energy consumption numbers for the foreseeable future, we opted to record energy consumption numbers for each of the above Procyon components.
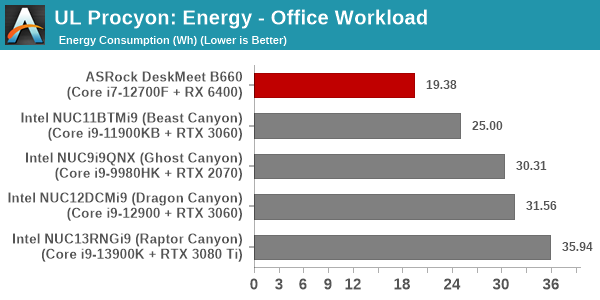
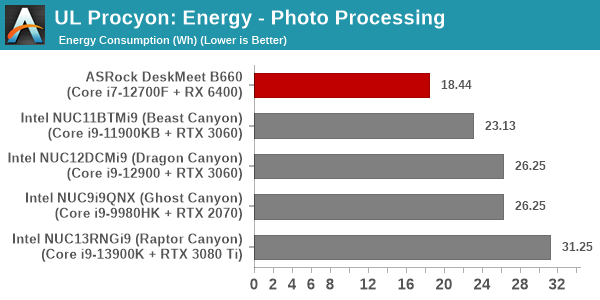
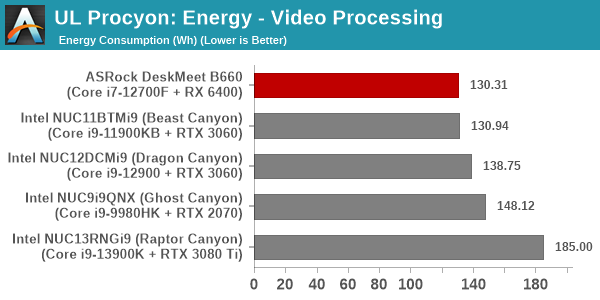
The DeskMeet B660 configuration is the only system in the list using a discrete GPU operating solely within the 75W provided by the PCIe slot. This also translates to lower power consumption numbers at the wall during active workloads. Despite not faring too well in the performance numbers, we find that the DeskMeet B660 is frugal in terms of the energy consumed while processing each workload component.
BAPCo CrossMark 1.0.1.86
BAPCo’s CrossMark aims to simplify benchmark processing while still delivering scores that roughly tally with SYSmark. The main advantage is the cross-platform nature of the tool – allowing it to be run on smartphones and tablets as well.
| BAPCo CrossMark 1.0.1.86 – Sub-Category Scores | |||

The relative performance seen in the overall PCMark 10 scores translate to CrossMark also. The only disappointing score is in the responsiveness numbers. As we shall see further down in this review, our choice of storage device was not very optimal for the system.
SFF PCs traditionally do not lend themselves to workstation duties. However, a recent trend towards miniaturized workstations has been observed. While the DeskMeet B660 is primarily marketed towards consumers requiring compact dGPU-equipped machines, its capabilities encouraged us to benchmark the system for both content creation workloads as well as professional applications. Towards this, we processed two SPEC benchmarks geared towards workstations – SPECworkstation 3.10 and SPECviewperf 2020 v3.
SPECworkstation 3.1
The SPECworkstation 3.1 benchmark measures workstation performance based on a number of professional applications. It includes more than 140 tests based on 30 different workloads that exercise the CPU, graphics, I/O and memory hierarchy. These workloads fall into different categories.
- Media and Entertainment (3D animation, rendering)
- Product Development (CAD/CAM/CAE)
- Life Sciences (medical, molecular)
- Financial Services
- Energy (oil and gas)
- General Operations
- GPU Compute
Individual scores are generated for each test and a composite score for each category is calculated based on a reference machine (HP Z240 tower workstation using an Intel E3-1240 v5 CPU, an AMD Radeon Pro WX3100 GPU, 16GB of DDR4-2133, and a SanDisk 512GB SSD). Official benchmark results generated automatically by the benchmark itself are linked in the table below for the systems being compared.
| SPECworkstation 3.1 Official Results (2K) | |
| ASRock DeskMeet B660 | Run Summary |
| Intel NUC13RNGi9 (Raptor Canyon) | Run Summary |
| Intel NUC11BTMi9 (Beast Canyon) | Run Summary |
| Intel NUC9i9QNX (Ghost Canyon) | Run Summary |
| Intel NUC12DCMi9 (Dragon Canyon) | Run Summary |
Details of the tests in each category, as well as an overall comparison of the systems on a per-category basis are presented below.
Media and Entertainment
The Media and Entertainment category comprises of workloads from five distinct applications:
- The Blender workload measures system performance for content creation using the open-source Blender application. Tests include rendering of scenes of varying complexity using the OpenGL and ray-tracing renderers.
- The Handbrake workload uses the open-source Handbrake application to transcode a 4K H.264 file into a H.265 file at 4K and 2K resolutions using the CPU capabilities alone.
- The LuxRender workload benchmarks the LuxCore physically based renderer using LuxMark.
- The Maya workload uses the SPECviewperf 13 maya-05 viewset to replay traces generated using the Autodesk Maya 2017 application for 3D animation.
- The 3ds Max workload uses the SPECviewperf 13 3dsmax-06 viewset to replay traces generated by Autodesk’s 3ds Max 2016 using the default Nitrous DX11 driver. The workload represents system usage for 3D modeling tasks.
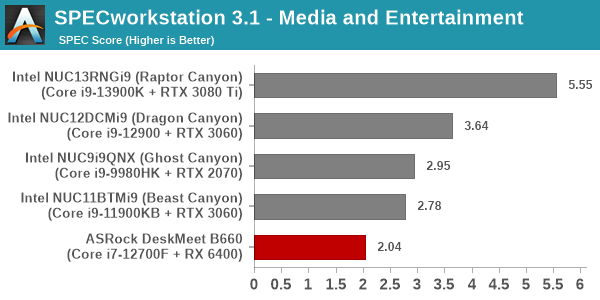
Some of the workload components above rely on the GPU capabilities. The RX 6400 is not in the same league as the RTX 2070 and the like. So, it is no surprise that there is a significant performance gulf. However, the pricing aspect and power consumption numbers are hugely in favor of the DeskMeet B660. In the end, the consumer gets the performance that one pays for. In the DeskMeet B660 it is a matter of choosing the right discrete GPU for the intended application.
Product Development
The Product Development category comprises of eight distinct workloads:
- The Rodinia (CFD) workload benchmarks a computational fluid dynamics (CFD) algorithm.
- The WPCcfd workload benchmarks another CFD algorithm involving combustion and turbulence modeling.
- The CalculiX workload uses the Calculix finite-element analysis program to model a jet engine turbine’s internal temperature.
- The Catia workload uses the catia-05 viewset from SPECviewperf 13 to replay traces generated by Dassault Systemes’ CATIA V6 R2012 3D CAD application.
- The Creo workload uses the creo-02 viewset from SPECviewperf 13 to replay traces generated by PTC’s Creo, a 3D CAD application.
- The NX workload uses the snx-03 viewset from SPECviewperf 13 to replay traces generated by the Siemens PLM NX 8.0 CAD/CAM/CAE application.
- The Solidworks workload uses the sw-04 viewset from SPECviewperf 13 to replay traces generated by Dassault Systemes’ SolidWorks 2013 SP1 CAD/CAE application.
- The Showcase workload uses the showcase-02 viewset from SPECviewperf 13 to replay traces from Autodesk???s Showcase 2013 3D visualization and presentation application
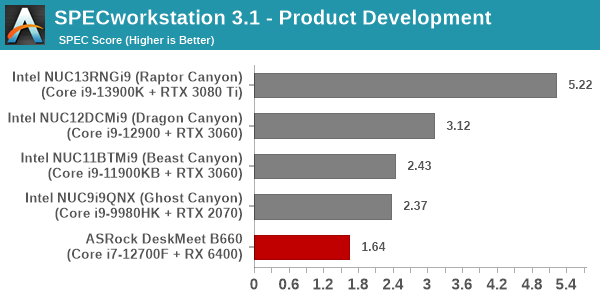
This category includes some GPU-centric workloads also, and the pattern seen in the ‘Media and Entertainment’ category repeats here.
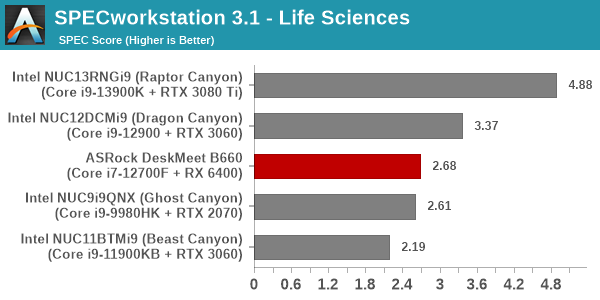
Life Sciences
The Life Sciences category comprises of four distinct test sets:
- The LAMMPS set comprises of five tests simulating different molecular properties using the LAMMPS molecular dynamics simulator.
- The NAMD set comprises of three tests simulating different molecular interactions.
- The Rodinia (Life Sciences) set comprises of four tests – the Heartwall medical imaging algorithm, the Lavamd algorithm for calculation of particle potential and relocation in a 3D space due to mutual forces, the Hotspot algorithm to estimate processor temperature with thermal simulations, and the SRAD anisotropic diffusion algorithm for denoising.
- The Medical workload uses the medical-02 viewset from SPECviewperf 13 to determine system performance for the Tuvok rendering core in the ImageVis3D volume visualization program.
This category includes only one GPU-centric workload, and this helps the DeskMeet B660 recover some lost ground to slot itself in the middle of the pack – an ordering that one would expect given the relative performance numbers of the different CPUs.
Financial Services
The Financial Services workload set benchmarks the system for three popular algorithms used in the financial services industry – the Monte Carlo probability simulation for risk assessment and forecast modeling, the Black-Scholes pricing model, and the Binomial Options pricing model.
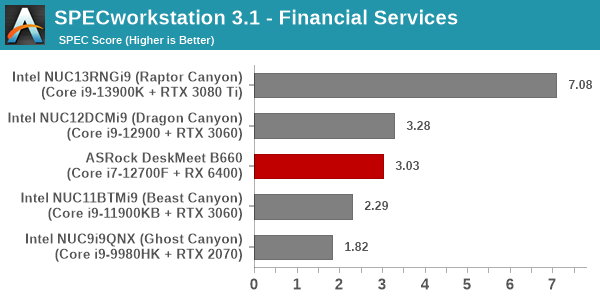
All workloads in this set are purely CPU-bound, and the systems order themselves based on their CPU’s performance.
Energy
The Energy category comprises of workloads simulating various algorithms used in the oil and gas industry:
- The FFTW workload computes discrete Fourier transforms of large matrices.
- The Convolution workload computes the convolution of a random 100×100 filter on a 400 megapixel image.
- The SRMP workload processes the Surface-Related Multiples Prediction algorithm used in seismic data processing.
- The Kirchhoff Migration workload processes an algorithm to calculate the back propogation of a seismic wavefield.
- The Poisson workload takes advantage of the OpenMP multi-processing framework to solve the Poisson’s equation.
- The Energy workload uses the energy-02 viewset from SPECviewperf 13 to determine system performance for the open-source OPendTec seismic visualization application.
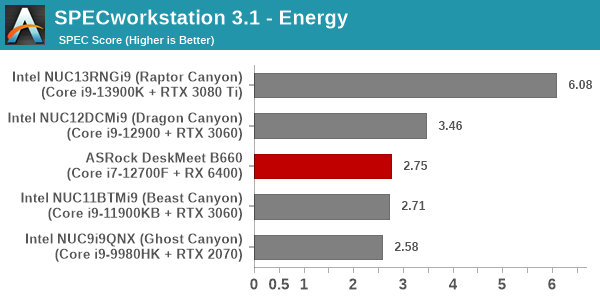
Similar to the ‘Life Sciences’ set, this category includes only one GPU-centric workload. It helps the DeskMeet B660 recover some lost ground to slot itself in the middle of the pack – an ordering that one would expect given the relative performance numbers of the different CPUs.
General Operations
In the General Options category, the focus is on workloads from widely used applications in the workstation market:
- The 7zip workload represents compression and decompression operations using the open-source 7zip file archiver program.
- The Python workload benchmarks math operations using the numpy and scipy libraries along with other Python features.
- The Octave workload performs math operations using the Octave programming language used in scientific computing.
- The Storage workload evaluates the performance of the underlying storage device using transaction traces from multiple workstation applications.

Ordinarily, we would expect this CPU-heavy workloads set to have the DeskMeet B660 in the middle of the graph. However, the storage subsystem drags down the position of the system significantly – an aspect that becomes evident on perusal of the detailed benchmark report linked earlier.
GPU Compute
In the GPU Compute category, the focus is on workloads taking advantage of the GPU compute capabilities using either OpenCL or CUDA, as applicable:
- The LuxRender benchmark is the same as the one seen in the media and entertainment category.
- The Caffe benchmark measures the performance of the Caffe deep-learning framework.
- The Folding@Home benchmark measures the performance of the system for distributed computing workloads focused on tasks such as protein folding and drug design.
We only process the OpenCL variants of the benchmark, as the CUDA version doesn’t process correctly with default driver installs.
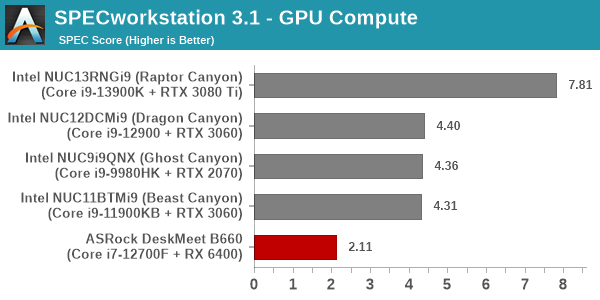
The relative ordering in this benchmark set is reflective of the GPU capabilities. As expected, the low-power RX 6400 can’t match the performance numbers of the RTX 2070 and better GPUs.
SPECviewperf 2020 v3.0
The SPECviewperf 2020 v3 benchmark from SPEC provides an idea of the capabilities of the GPU in a workstation from the perspective of different CAD, content creation, and visual data analysis tools. It makes more sense to process these benchmarks on workstations with professional GPUs, but, consumer GPUs are often the choice for machines that need to handle both gaming and professional workloads.
SPECviewperf 2020 v3 includes eight different workloads representative of graphics content and behavior of actual applications. They make use of the OpenGL 4.5 and DirectX 12 APIs under Windows. SPECviewperf 2020 v3’s workloads (termed viewsets) can officially be run only at two desktop resolutions (1920 x 1080, and 3840 x 2160), and need the display scaling to be set to 100% (DPI of 96). The available viewsets are listed below.
- 3ds Max (3dsmax-07)
- CATIA (catia-06)
- Creo (creo-03)
- Energy (energy-03)
- Maya (maya-06)
- Medical (medical-03)
- Siemens NX (snx-04)
- Solidworks (sw-07)
A minimum VRAM of 4GB is required for the Solidworks viewset. We processed SPECviewperf 2020 v3 at both resolutions on the ASRock DeskMeet B660. The benchmark measures the frame rate at which the GPU renders the scenes in a viewset. Each viewset is composed of different scenes and rendering modes, and the composite score for the viewset is a weighted geometric mean of the FPS measured for the different scenes. Official benchmark results generated automatically by the benchmark itself are linked in the table below for the systems being compared.
| SPECviewperf 2020 v3 Official Results | ||
| ASRock DeskMeet B660 | 2K | 4K |
| Intel NUC13RNGi9 (Raptor Canyon) | 2K | 4K |
| Intel NUC11BTMi9 (Beast Canyon) | 2K | 4K |
| Intel NUC9i9QNX (Ghost Canyon) | 2K | 4K |
| Intel NUC12DCMi9 (Dragon Canyon) | 2K | 4K |
In the remainder of this section, we take a look at how its composite scores stack up against other systems targeting this market segment.
3ds Max (3dsmax-07)
The 3dsmax-06 viewset comprises of 11 different scenes. They have been created from traces of the graphics workload generated by Autodesk 3ds Max 2016 using the default Nitrous DX11 driver. Additional details are available here.

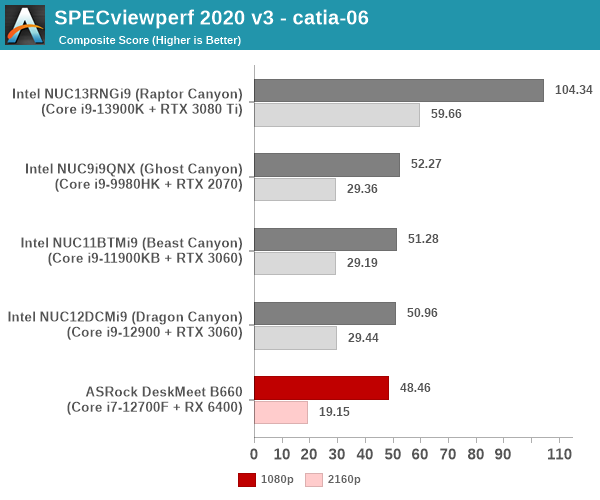
CATIA (catia-06)
The catia-06 viewset comprises of 8 different tests created from traces of the graphics workload generated by the CATIA V5 and 3D EXPERIENCE CATIA applications from Dassault Systemes. Additional details are available here.
Creo (creo-03)
The creo-03 viewset comprises of 13 different tests created from traces of the graphics workload generated by PTC’s Creo 4 application. Additional details are available here.

Energy (energy-03)
The energy-03 viewset comprises of 6 different tests based on techniques used by the OpendTect seismic visualization application. Additional details are available here.

Maya (maya-06)
The maya-06 viewset comprises of 10 different tests based on traces of the graphics workload generated by Autodesk Maya 2017. Additional details are available here.

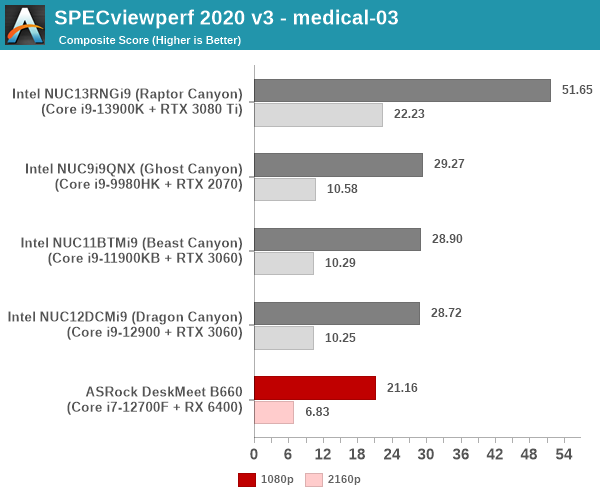
Medical (medical-03)
The medical-03 viewset comprises of 10 different tests derived from 5 distinct datasets to evaluate the performance for volume rendering techniques such as slice rendering and raycasting using the Tuvok visualization library. Additional details are available here.
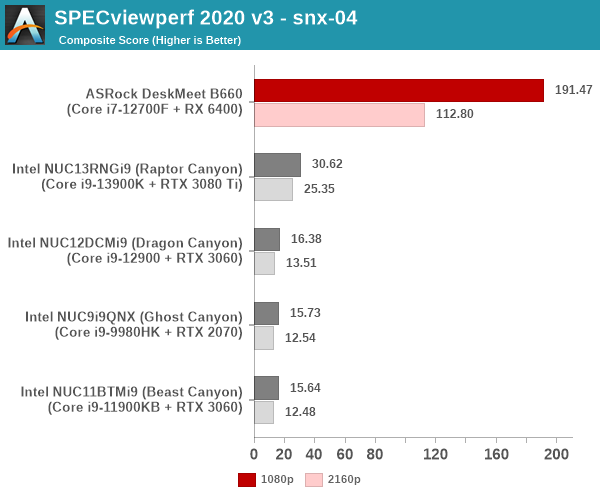
Siemens NX (snx-04)
The snx-04 viewset comprises of 10 tests created with traces from the graphics workload generated by the NX 8.0 application from Siemens PLM. Additional details are available here.
Solidworks (sw-07)
The sw-07 viewset comprises of 10 tests created from traces of Dassault Systemes SolidWorks 2020 application.

The only surprising aspects in these results are the huge lead for the RX 6400 in the Siemens NX workload – NVIDIA’s gaming GPU drivers are heavily gimped from the perspective of this workload, and one requires the Quadro cards to get numbers reflective of their true performance. This is not the case for the AMD gaming cards, though. The other workload is Solidworks – it requires more than 4GB of VRAM for proper completion of the benchmark component. Since the RX 6400 has only 4GB of VRAM, it doesn’t obtain a score for that component.
Standardized benchmarks such as UL’s PCMark 10 take a holistic view of the system and process a wide range of workloads to arrive at a single score. Some systems are required to excel at specific tasks – so it is often helpful to see how a computer performs in specific scenarios such as rendering, transcoding, JavaScript execution (web browsing), etc. This section presents focused benchmark numbers for specific application scenarios.
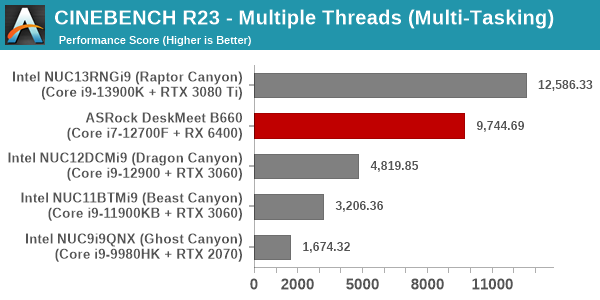
3D Rendering – CINEBENCH R23
We use CINEBENCH R23 for 3D rendering evaluation. R23 provides two benchmark modes – single threaded and multi-threaded. Evaluation of different PC configurations in both supported modes provided us the following results.
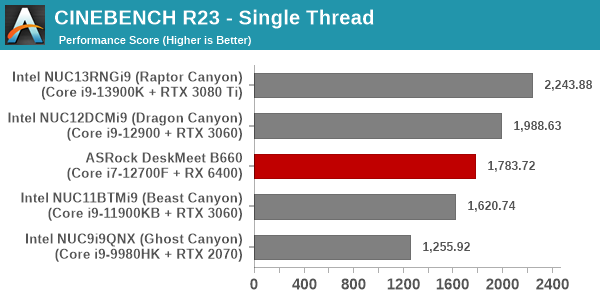
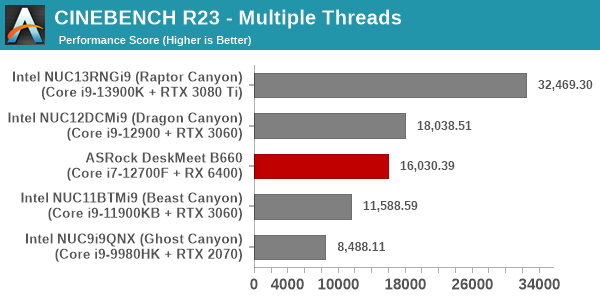
The relative placement of the different systems in both graphs above are as expected based on the CPU architecture, processor frequency, and core counts.
Transcoding: Handbrake 1.5.1
Handbrake is one of the most user-friendly open source transcoding front-ends in the market. It allows users to opt for either software-based higher quality processing or hardware-based fast processing in their transcoding jobs. Our new test suite uses the ‘Tears of Steel’ 4K AVC video as input and transcodes it with a quality setting of 19 to create a 720p AVC stream and a 1080p HEVC stream.
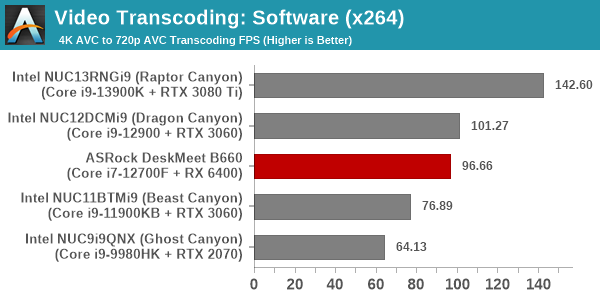
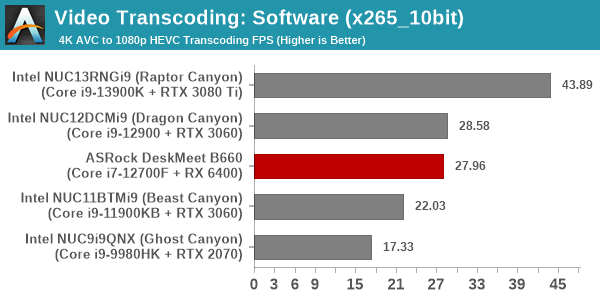
In the case of software transcoding, the relative numbers follow the same pattern as what was seen in the multi-threaded Cinebench R23 case (transcoding benefits heavily from multiple threads).
The RX 6400 has no hardware-accelerated encoding capabilities, and the Core i7-12700F has no integrated GPU. So, our DeskMeet B660 configuration has no numbers to contribute to the comparison of either VCE or QuickSync performance.
Archiving: 7-Zip 21.7
The 7-Zip benchmark is carried over from our previous test suite with an update to the latest version of the open source compression / decompression software.
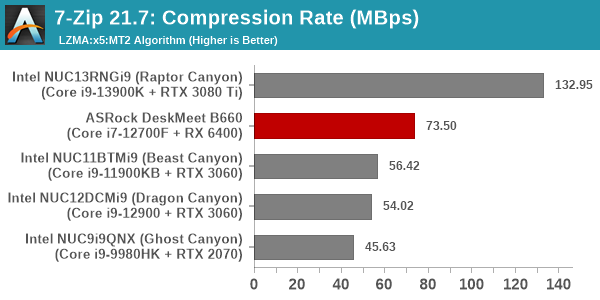
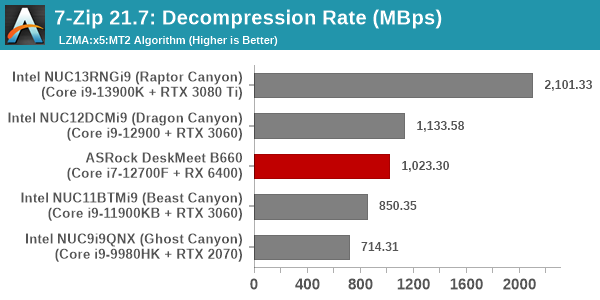
While the decompression rates are as per expectations, the DeskMeet B660 performs better than expected in the compression workload – likely due to the higher RAM speeds compared to the other DDR4-3200 systems in the mix.
Web Browsing: JetStream, Speedometer, and Principled Technologies WebXPRT4
Web browser-based workloads have emerged as a major component of the typical home and business PC usage scenarios. For headless systems, many applications based on JavaScript are becoming relevant too. In order to evaluate systems for their JavaScript execution efficiency, we are carrying over the browser-focused benchmarks from the WebKit developers used in our notebook reviews. Hosted at BrowserBench, JetStream 2.0 benchmarks JavaScript and WebAssembly performance, while Speedometer measures web application responsiveness.
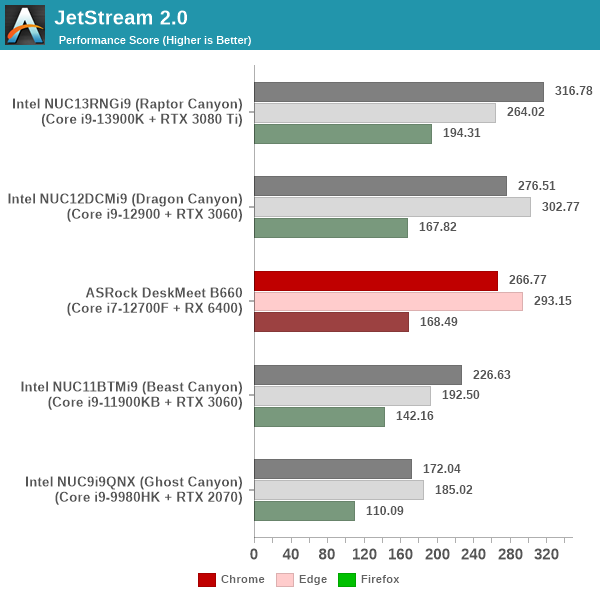
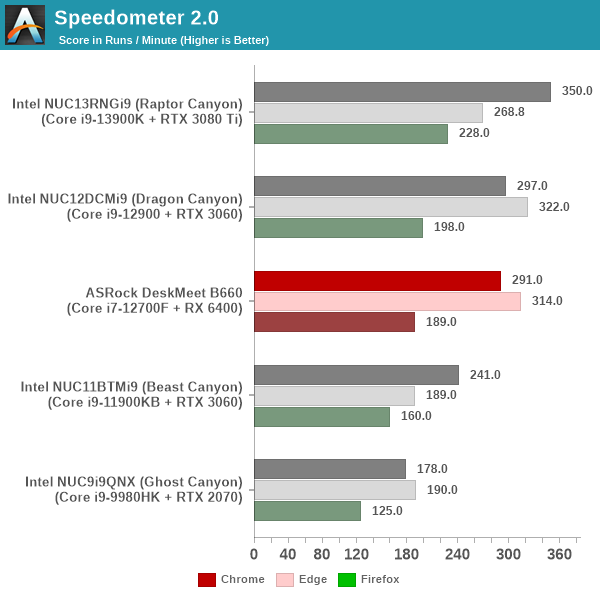
From a real-life workload perspective, we also process WebXPRT4 from Principled Technologies. WebXPRT4 benchmarks the performance of some popular JavaScript libraries that are widely used in websites.
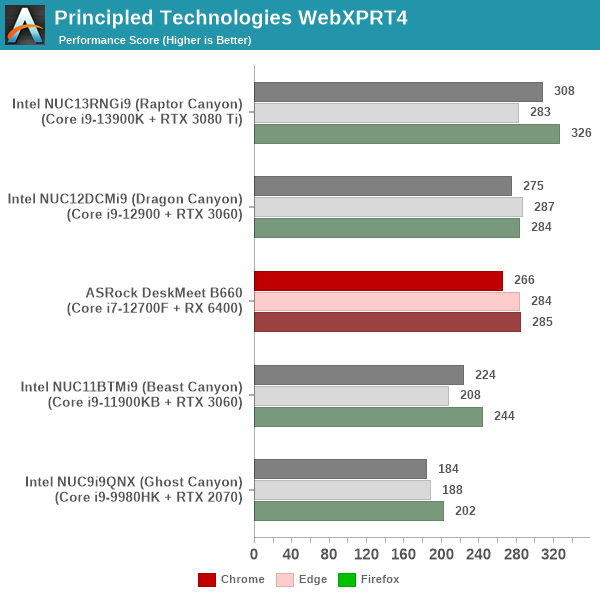
The performance numbers in all three benchmarks and across all three browsers match expectations based on the capabilities of the processor in each system.
Application Startup: GIMP 2.10.30
A new addition to our systems test suite is AppTimer – a benchmark that loads up a program and determines how long it takes for it to accept user inputs. We use GIMP 2.10.30 with a 50MB multi-layered xcf file as input. What we test here is the first run as well as the cached run – normally on the first time a user loads the GIMP package from a fresh install, the system has to configure a few dozen files that remain optimized on subsequent opening. For our test we delete those configured optimized files in order to force a fresh load every second time the software is run.
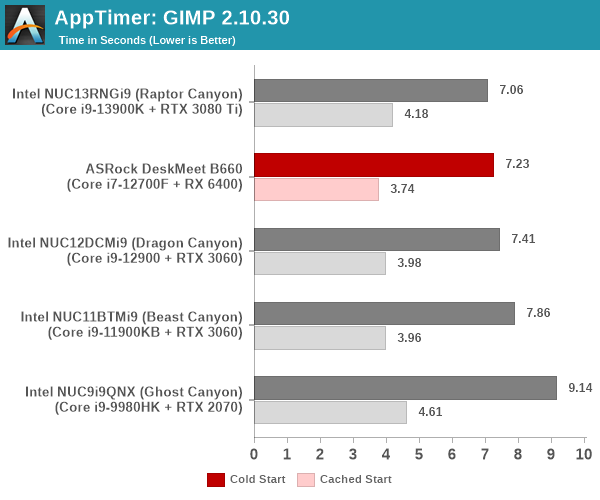
As it turns out, GIMP does optimizations for every CPU thread in the system, which requires that higher thread-count processors take a lot longer to run. So the test runs quick on systems with fewer threads, however fast cores are also needed. The higher memory speed (DDR4-3600) probably helps the DeskMeet B660, helping it edge out the Dragon Canyon NUC slightly.
Discrete GPUs are included in systems for a variety of purposes. The most common scenario is one in which the end user requires better gaming performance than what an integrated GPU can provide. The other reason could be workstation performance. Yet another possibility is a system equipped with a CPU that doesn’t support any graphics output. The AMD Radeon RX 6400 is a good fit in the third scenario. It operates well below the 75W limit imposed by the PCIe slot’s power delivery mechanism. It provides two display outputs capable of driving 8K displays, if required. As per marketing claims, it provides good enough 1080p gaming performance. GPU performance evaluation typically involved gaming workloads, and for select PCs, GPU compute. Prior to that, a look at the capabilities of the GPU installed in the DeskMeet B660 is warranted.
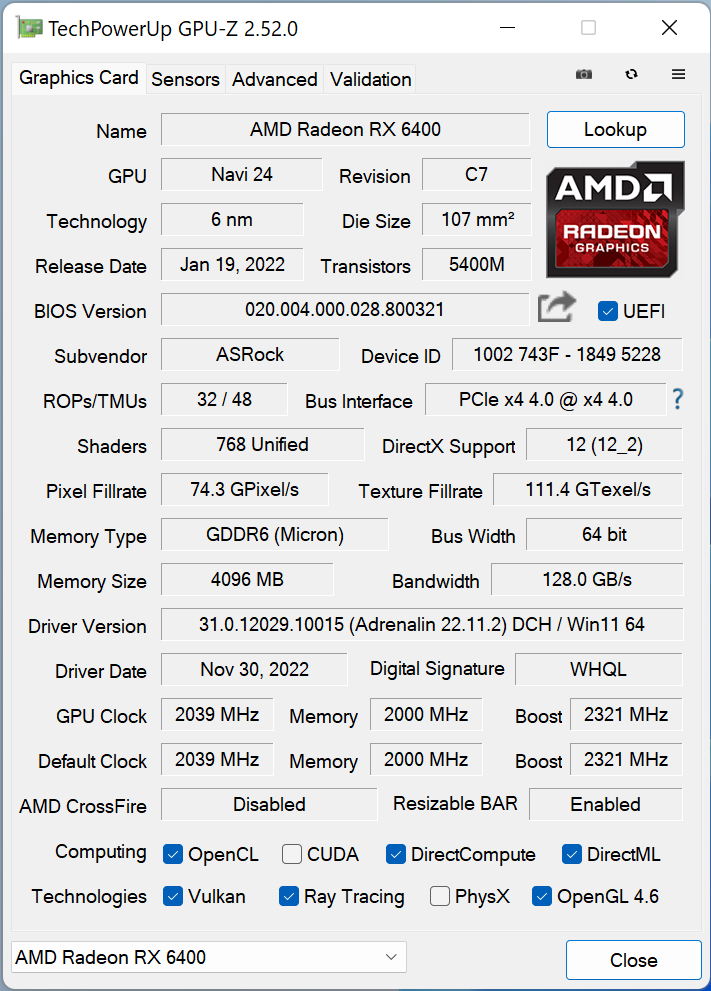
The AMD Radeon RX 6400 is a Navi 24 GPU built in the TSMC 6nm process. The ASRock Challenger ITX version configures it with a 4-lane PCIe 4.0 interface and 4GB of GDDR6 VRAM. The card is very weak in terms of multimedia capabilities, with a limited set of codecs support for hardware decoding and no VCE (encoding) support. Overall, it is a decent card to add a display output to an otherwise bare system. However, we decided to evaluate the gaming performance also, in order to gauge ASRock’s claims of it being suitable for 1080p gaming. Additional comparison numbers with integrated GPUs can be obtained in the graphs from our ASRock NUC BOX-1260P and ASRock 4×4 BOX-5800U review here.
GFXBench
The DirectX 12-based GFXBench tests from Kishonti are cross-platform, and available all the way down to smartphones. As such, they are not very taxing for discrete GPUs and modern integrated GPUs. We processed the offscreen versions of the ‘Aztec Ruins’ benchmark.
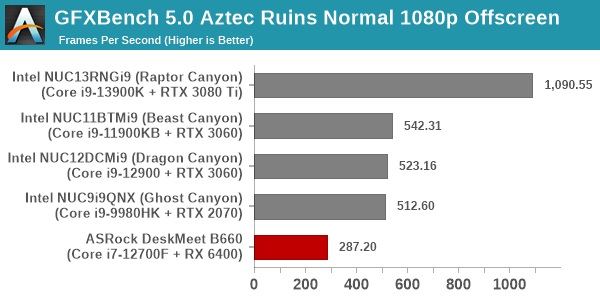
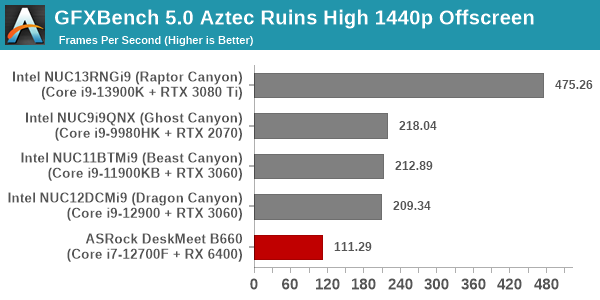
The raw numbers are very good, but are well behind the other systems in the mix. Comparison with the best integrated GPUs in UCFF systems from Intel and AMD show these numbers to be better by a factor of more than 2.5 – commensurate with the delta in the power allocation for the GPU.
UL 3DMark
Four different workload sets were processed in 3DMark – Fire Strike, Time Spy, Night Raid, and Wild Life.
3DMark Fire Strike
The Fire Strike benchmark has three workloads. The base version is meant for high-performance gaming PCs. It uses DirectX 11 (feature level 11) to render frames at 1920 x 1080. The Extreme version targets 1440p gaming requirements, while the Ultra version targets 4K gaming system, and renders at 3840 x 2160. The graph below presents the overall score for the Fire Strike Extreme and Fire Strike Ultra benchmark across all the systems that are being compared.
| UL 3DMark – Fire Strike Workloads | |||

3DMark Time Spy
The Time Spy workload has two levels with different complexities. Both use DirectX 12 (feature level 11). However, the plain version targets high-performance gaming PCs with a 2560 x 1440 render resolution, while the Extreme version renders at 3840 x 2160 resolution. The graphs below present both numbers for all the systems that are being compared in this review.
| UL 3DMark – Time Spy Workloads | |||

3DMark Wild Life
The Wild Life workload was initially introduced as a cross-platform GPU benchmark in 2020. It renders at a 2560 x 1440 resolution using Vulkan 1.1 APIs on Windows. It is a relatively short-running test, reflective of mobile GPU usage. In mid-2021, UL released the Wild Life Extreme workload that was a more demanding version that renders at 3840 x 2160 and runs for a much longer duration reflective of typical desktop gaming usage.
| UL 3DMark – Wild Life Workloads | |||

All of the above workloads are for systems intended for gaming at 1440p or higher resolutions, but we do get an idea of the relative performance numbers (which are as per expectations).
3DMark Night Raid
The Night Raid workload is a DirectX 12 benchmark test. It is less demanding than Time Spy, and is optimized for integrated graphics. The graph below presents the overall score in this workload for different system configurations.
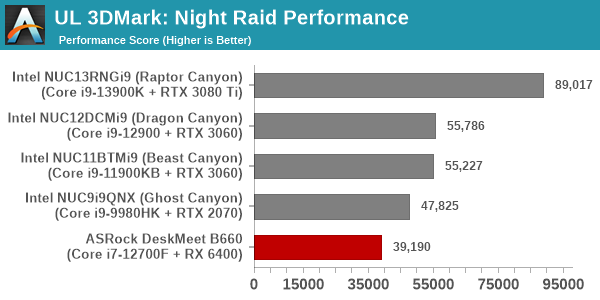
All the scores in the above benchmarks are significantly better than the ones that the best integrated GPU can provide (by a factor of around 2.5x consistently). The RX 6400 is indeed a good upgrade to an integrated GPU for 3D performance, and a good low-power display-output enabling card for iGPU-less systems like our DeskMeet B660 configuration.
3DMark Port Royal
UL introduced the Port Royal ray-tracing benchmark as a DLC for 3DMark in early 2019. The scores serve as an indicator of how the system handles ray-tracing effects in real-time.
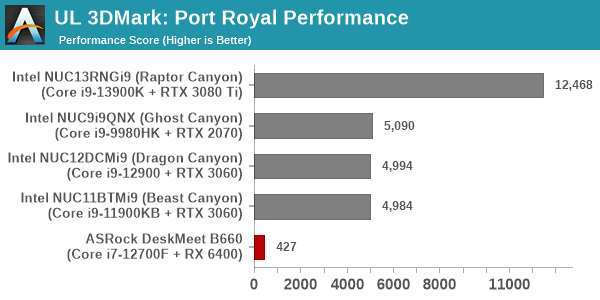
Despite being a low-end card, the RX 6400 does include hardware ray-tracing and completed the Port Royal benchmark successfully. The score, though, is nothing to write home about.
The evaluation suite for gaming performance of SFF systems was updated in 2022 Q4 with a focus on sampling a wide variety of games with different GPU performance requirements. Eight different games are now benchmarked at two different quality settings and four different resolutions. Average frame rates as well as 95th percentile frame rates (where available) are presented.
- Civilization VI (DX12)
- Strange Brigade
- Grand Theft Auto V
- Red Dead Redemption 2
- Borderlands 3
- Cyberpunk 2077
- F1 2022
- World of Tanks
Most system reviews take a handful of games and process them at one resolution / quality settings for comparison purposes. Recently, we have seen many pre-built systems coming out with varying gaming capabilities. Hence, it has become imperative to give consumers an idea of how a given system performs over a range of resolutions and quality settings for each game. Our test suite is able to address this aspect.
Civilization VI
The Civilization series of turn-based strategy games is very popular. For such games, the frame rate is not necessarily an important factor in the gaming experience. However, starting with Civilization VI, Firaxis cranked up the visual fidelity to make the game more attractive. As a result, the game can be taxing on the GPU as well as the CPU, particularly in the DirectX 12 mode.
The resolution options are altered from the default as per the following depending on the desired rendering width and height. These settings were arrived at after extensive testing across multiple systems to produce repeatable and consistent results.
| Civilization VI AppOptions.txt | ||
| RenderWidth | 1366, 1920, 2560, 3840 | |
| RenderHeight | 768, 1080, 1440, 2160 | |
| FullScreen | 0 | |
| PlayIntroVideo | 0 | |
| UIUpscale | 0 | |
Two sets of quality settings are evaluated, with the departures from the default configuration detailed below.
| Civilization VI GraphicsOptions.txt | ||
| MED | ULT | |
| PerformanceImpact | -1 | |
| MemoryImpact | -1 | |
| MSAA | 4 | |
| ShadowMapResolution | 4096 | 8192 |
| AODepthResolution | 1024 | 2048 |
| AORenderResolution | 1024 | 2048 |
| TerrainSynthesisDetailLevel | 2 | 1 |
| TerrainQuality | 3 | 4 |
| LowQualityTerrainShader | 1 | 0 |
| SSReflectPasses | 2 | 4 |
| UseLowQualityWaterShader | 1 | 0 |
| VFXDetailLevel | 0 | 1 |
| ClutterDetailLevel | 0 | 1 |
| EnableAO | 0 | 1 |
| Quality | 1 | 3 |
| EnableMotionBlur | 0 | 1 |
| Civilization VI – Average Frame Rates | |||

| Civilization VI – 95th Percentile Frame Rates | |||

The game is not particularly taxing, with the 95th percentile numbers even in the Ultra settings being above 60 fps. Overall, Civilization VI is a good fit for 1080p and lower resolutions gaming in our DeskMeet B660 configuration.
Strange Brigade (DX12)
Strange Brigade s a third-person shooter developed by Rebellion Developments (more widely known for games such as the Sniper Elite and Alien vs Predator series). It includes both DX12 and Vulkan executables, and we opt to evaluate the DX12 one. The game is known for not being particularly taxing on the GPU, making it a good fit even for processing even on integrated GPUs at low resolutions and quality settings.
The rendering resolutions and quality settings for Strange Brigade are controllable from a single options file.
| Strange Brigade GraphicsOptions.ini | ||
| MED | ULT | |
| Resolution_Width | 1280, 1920, 2560, 3840 | |
| Resolution_Height | 720, 1080, 1440, 2160 | |
| Tessellation | 0 | 1 |
| TextureDetail | 1 | 3 |
| ShadowDetail | 1 | 3 |
| AntiAliasing | 2 | 4 |
| DrawDistance | 1 | 3 |
| AnisotropicFiltering | 4 | 16 |
| SSReflectionQuality | 1 | 3 |
| ObscuranceFields | 0 | 1 |
| Strange Brigade – Average Frame Rates | |||
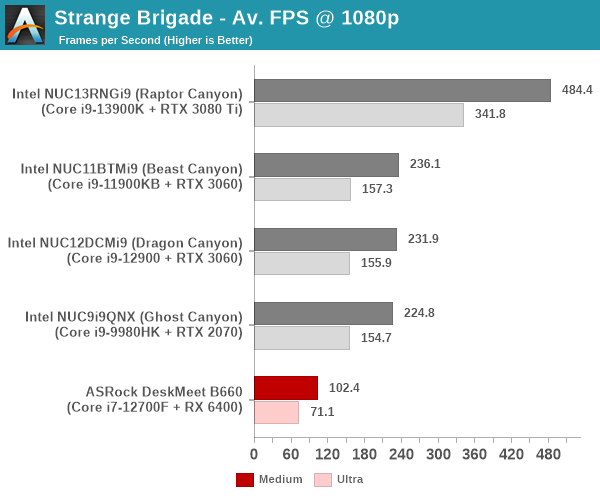
| Strange Brigade – 95th Percentile Frame Rates | |||

The game runs well even on integrated graphics. The 95th percentile numbers in the Ultra settings manage to hit the 60 fps mark. Overall, Strange Brigade is also a good fit for 1080p and lower resolutions gaming in our DeskMeet B660 configuration.
Grand Theft Auto V
Grand Theft Auto V hit the shelves back in 2015, but the title continues to remain a good benchmark for GPUs. Even modern mid-range ones struggle to hit 60 fps with high quality settings and higher resolutions. One of the drawbacks is that DirectX 12 support is not available. So, we opt to benchmark the title with DirectX 11.
Grand Theft Auto V allows configuration of quality via XML file as well as through the command line. We use the command line to control the rendering resolution as well as the quality, as shown in the table below. Arguments common to both quality settings [ -ssa, -anisotropicQualityLevel 16, -cityDensity 1, -fxaa 1, -lodScale 1, -particleShadows, -pedLodBias 0.2, -reflectionBlur, -shadowLongShadows 1, -textureQuality 2, -vehicleLodBias 0, -txaa 1, and -samplingMode 0] ] are not explicitly included below.
| Grand Theft Auto V Command Line Options | ||
| MED | ULT | |
| -width | 1280, 1920, 2560, 3840 | |
| -height | 720, 1080, 1440, 2160 | |
| -shadowSoftness | 1 | 3 |
| -ssao | 1 | 2 |
| -grassQuality | 1 | 3 |
| -particleQuality | 1 | 2 |
| -postFX | 1 | 3 |
| -reflectionQuality | 2 | 3 |
| -shaderQuality | 1 | 2 |
| -ultraShadows | 0 | 1 |
| -shadowQuality | 2 | 3 |
| -tessellation | 2 | 3 |
| -waterQuality | 1 | 2 |
| -reflectionMsaa | 2 | 8 |
| -multiSample | 4 | 8 |
| -HdStreamingInFlight | 0 | 1 |
| -maxLodScale | 0 | 1 |
| -motionBlurStrength | 0 | 1 |
| Grand Theft Auto V – Average Frame Rates | |||
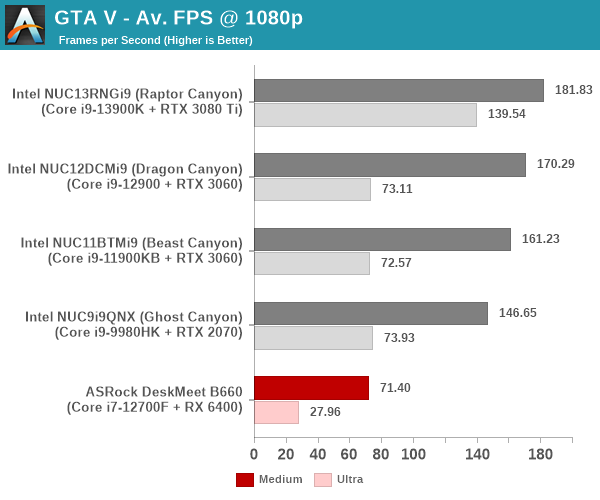
| Grand Theft Auto V – 95th Percentile Frame Rates | |||

The game is quite taxing, but is probably still playable at 1080p with medium settings in our DeskMeet B660 configuration.
Red Dead Redemption 2
Red Dead Redemption from Rockstar Games is a open-world cowboy genre title. It has a wide array of impressive graphics and eerily realistic features. Benchmark settings for the two quality levels are similar to the ones applied for GTA V.
| Red Dead Redemption 2 – Average Frame Rates | |||

| Red Dead Redemption 2 – 95th Percentile Frame Rates | |||

Relatively newer games like Red Dead Redemption 2 bring the RX 6400 to its knees. 720p medium settings are probably still playable, but the user experience is not going to be good.
Borderlands 3
Borderlands 3 is a first-person shooter / looter title from 2K Games. The evaluated quality settings for Borderlands 3 correspond to the ‘Medium’ and ‘Badass’ presets selectable from the Visuals menu in the game. The rendering resolution is also directly controllable from the menu. We use DX12 as the preferred graphics API for this title.
| Borderlands 3 – Average Frame Rates | |||
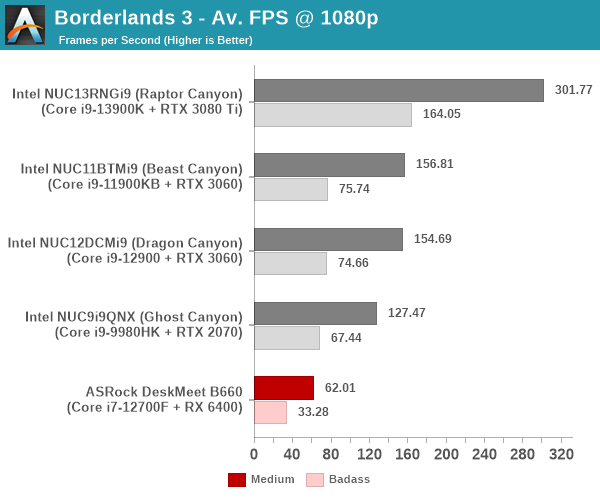
| Borderlands 3 – 95th Percentile Frame Rates | |||
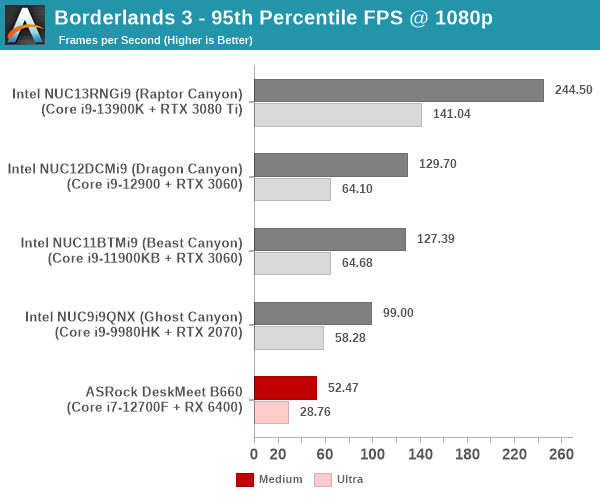
The RX 6400 manages to put in a good performance in the Borderlands 3 workload relative to Red Dead Redemption 2. 1080p medium settings yield respectable numbers above 50 fps for the 95th percentile, which should be good enough for most gamers.
Cyberpunk 2077
Cyberpunk 2077 is an action role-playing game from CD Projekt Red. It uses the company’s in-house REDengine 4 game engine with extensive ray-tracing support. The built-in benchmark can be processed at different quality settings, out of which we chose two corresponding to ‘Medium’ and ‘Ultra’. In addition, disabling of ray-tracing, and DLSS / FSR was also ensured.
| Cyberpunk 2077 – Average Frame Rates | |||

| Cyberpunk 2077 – 95th Percentile Frame Rates | |||
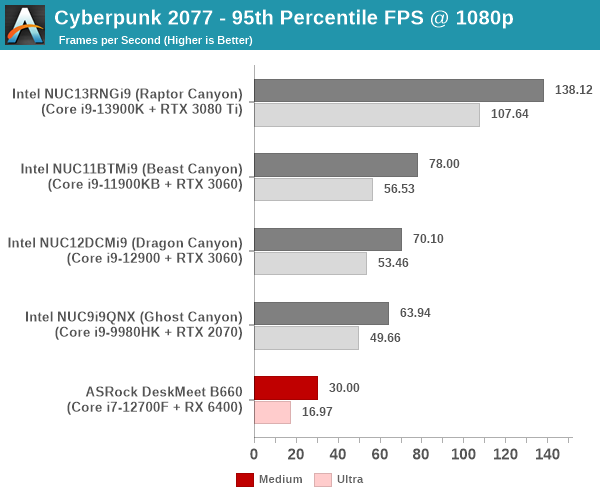
One of the newer games in our benchmarks set, Cyberpunk 2077 is very taxing. The DeskMeet B660 still manages to pull in respectable 95th percentile numbers for 720p medium settings – at close to 50 fps, the user experience should be passable.
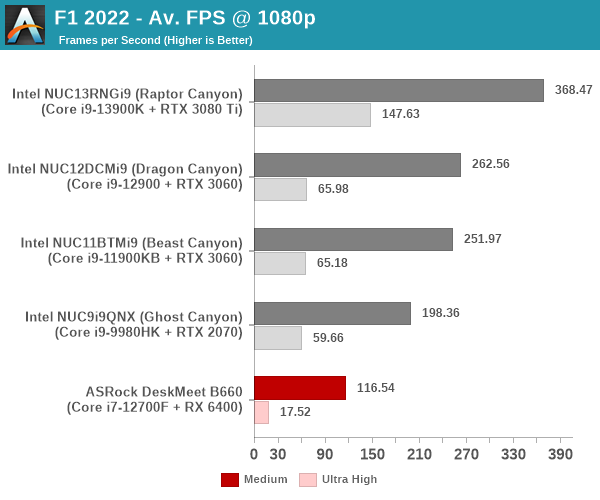
F1 2022
Aside from keeping up-to-date with the Formula One world, F1 2022 also includes ray-tracing support. It is graphically quite demanding at higher quality settings, and keeps a useful racing-type workload in our benchmarks. We opt to use the in-game benchmark, set to run at Medium and Ultra settings (ray-tracing disabled) on the Bahrain track in dry weather. Benchmark data is taken over a one-lap race.
| F1 2022 – Average Frame Rates | |||
| F1 2022 – 95th Percentile Frame Rates | |||
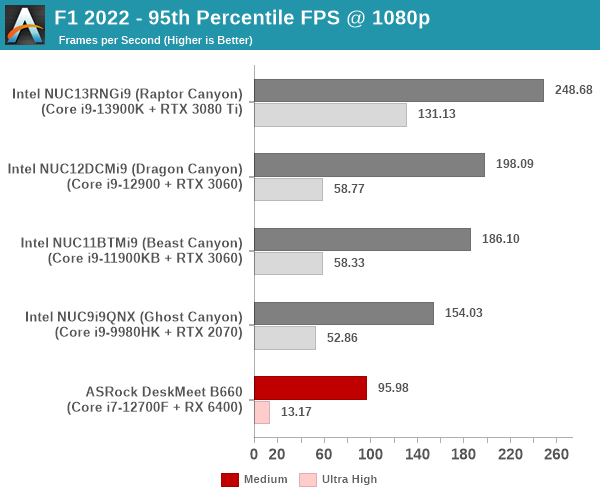
The F1 series has historically performed well on AMD GPUs, and F1 2022 is no different. We see 1440p medium settings being perfectly playable on the RX 6400 in our DeskMeet B660.
World of Tanks
World of Tanks is a popular multi-player online game that allows players to take control of a range of military-based armored vehicles. From a benchmarking perspective, the developer (Wargaming) has a ‘World of Tanks enCore’ demo application with features of the game engine used in the actual game. The latest release used in our test suite includes ray tracing support that is explicitly turned on in our customization of the built-in ‘Medium’ and ‘Ultra’ settings.
| World of Tanks – Average Frame Rates | |||

This is not a particularly taxing benchmark, but we do add ray-tracing into the mix. Despite that, the RX 6400 performs well enough for playing at 1440p medium and 1080p ultra settings.
One of the key drivers of advancments in computing systems is multi-tasking. On mobile devices, this is quite lightweight – cases such as background email checks while the user is playing a mobile game are quite common. Towards optimizing user experience in those types of scenarios, mobile SoC manufacturers started integrating heterogenous CPU cores – some with high performance for demanding workloads, while others were frugal in terms of both power consumption / die area and performance. This trend is now slowly making its way into the desktop PC space.
Multi-tasking in typical PC usage is much more demanding compared to phones and tablets. Desktop OSes allow users to launch and utilize a large number of demanding programs simultaneously. Responsiveness is dictated largely by the OS scheduler allowing different tasks to move to the background. Intel’s Alder Lake processors work closely with the Windows 11 thread scheduler to optimize performance in these cases. Keeping these aspects in mind, the evaluation of multi-tasking performance is an interesting subject to tackle.
We have augmented our systems benchmarking suite to quantitatively analyze the multi-tasking performance of various platforms. Our previous attempt involved the triggering of a VLC transcoding task to transform 1716 3840×1714 frames encoded as a 24fps AVC video (Blender Project’s ‘Tears of Steel’ 4K version) into a 1080p HEVC version in a loop. VLC internally uses the x265 encoder, and the settings are configured to allow the CPU usage to be saturated across all cores. Unfortunately, with some of the large core-count systems, we found VLC falling back to single-core usage. We have since replaced it with a ffmpeg transcoding task that appears to uniformly load the cores even in the Raptor Canyon NUC. The transcoding rate is monitored continuously. One complete transcoding pass is allowed to complete before starting the first multi-tasking workload – the PCMark 10 Extended bench suite. A comparative view of the PCMark 10 scores for various scenarios is presented in the graphs below. Also available for concurrent viewing are scores in the normal case where the benchmark was processed without any concurrent load, and a graph presenting the loss in performance.
| UL PCMark 10 Load Testing – Digital Content Creation Scores | |||

| UL PCMark 10 Load Testing – Productivity Scores | |||

| UL PCMark 10 Load Testing – Essentials Scores | |||

| UL PCMark 10 Load Testing – Gaming Scores | |||

| UL PCMark 10 Load Testing – Overall Scores | |||

The performance loss in the PCMark workloads range between 25% and 33%, with the DeskMeet B660 managing to score the lowest overall performance loss numbers.
Following the completion of the PCMark 10 benchmark, a short delay is introduced prior to the processing of Principled Technologies WebXPRT4 on MS Edge. Similar to the PCMark 10 results presentation, the graph below show the scores recorded with the transcoding load active. Available for comparison are the dedicated CPU power scores and a measure of the performance loss.
| Principled Technologies WebXPRT4 Load Testing Scores (MS Edge) | |||

Here, the performance loss for the DeskMeet B660 is heavier, with the extra cores in the Raptor Canyon enabling it to balance both the transcoding and web browsing tasks in a more effective manner.
The final workload tested as part of the multitasking evaluation routine is CINEBENCH R23.
| 3D Rendering – CINEBENCH R23 Load Testing – Single Thread Score | |||

| 3D Rendering – CINEBENCH R23 Load Testing – Multiple Thread Score | |||
The DeskMeet B660 manage to get back to the top spot in terms of minimizing performance loss with the concurrent load being active.
After the completion of all the workloads, we let the transcoding routine run to completion. The monitored transcoding rate throughout the above evaluation routine (in terms of frames per second) is graphed below.
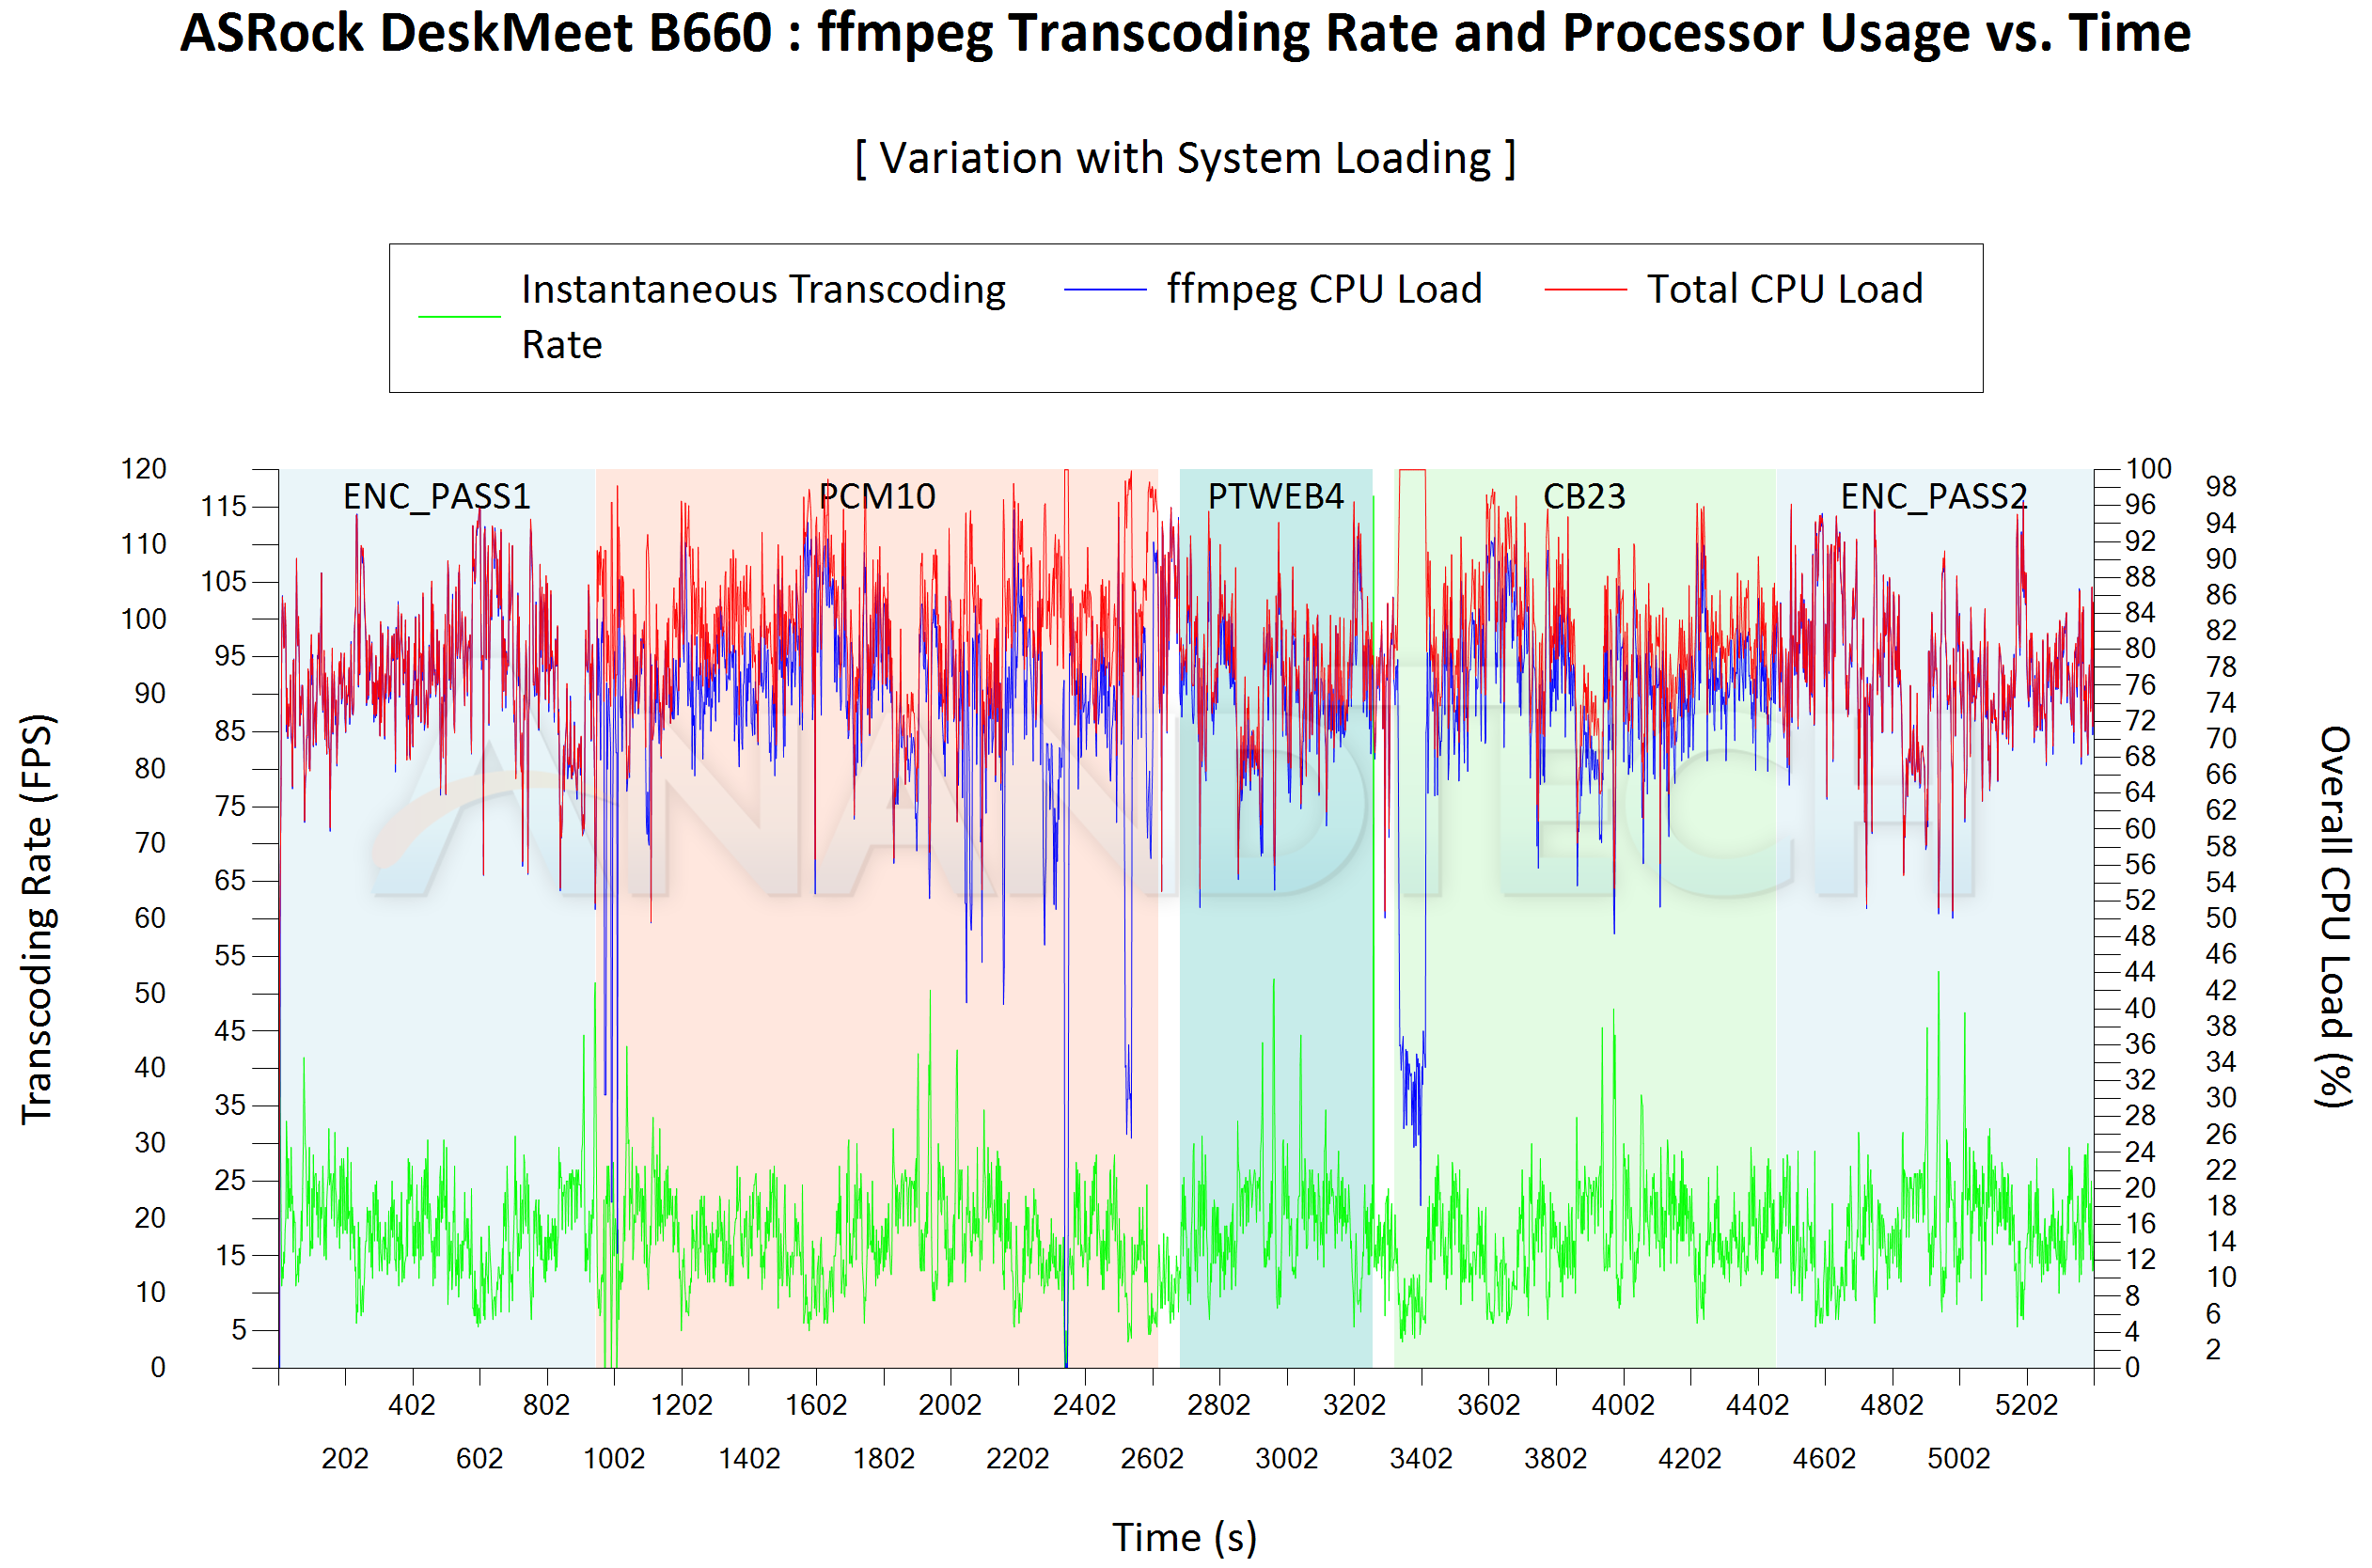
A quantitative view of the transcoding performance in the different stages is presented in the table below.
| ASRock DeskMeet B660 ffmpeg Transcoding Rate (Multi-Tasking Test) | |||
| Task Segment | Transcoding Rate (FPS) | ||
| Minimum | Average | Maximum | |
| Transcode Start Pass | 5.5 | 18.74 | 55 |
| PCMark 10 | 0 | 17.23 | 50.5 |
| WebXPRT 4 | 5.5 | 17.87 | 52 |
| Cinebench R23 | 3.5 | 17.21 | 48 |
| Transcode End Pass | 5.5 | 18.68 | 53 |
Across all phases, the loss in transcoding performance is minimal. During periods of heavy multi-threaded loading like PCMark 10 and Cinebench R23, the transcoding does experience some hiccups, but always recovers within a short while.
The 2022 Q4 update to our system reviews brings an updated HTPC evaluation suite for systems. After doing away with the evaluation of display refresh rate stability and Netflix streaming evaluation, the local media playback configurations have also seen a revamp. This section details each of the workloads processed on the ASRock DeskMeet B660 as part of the HTPC suite.
YouTube Streaming Efficiency
YouTube continues to remain one of the top OTT platforms, primarily due to its free ad-supported tier. Our HTPC test suite update retains YouTube streaming efficiency evaluation as a metric of OTT support in different systems. Mystery Box’s Peru 8K HDR 60FPS video is the chosen test sample. On PCs running Windows, it is recommended that HDR streaming videos be viewed using the Microsoft Edge browser after putting the desktop in HDR mode.
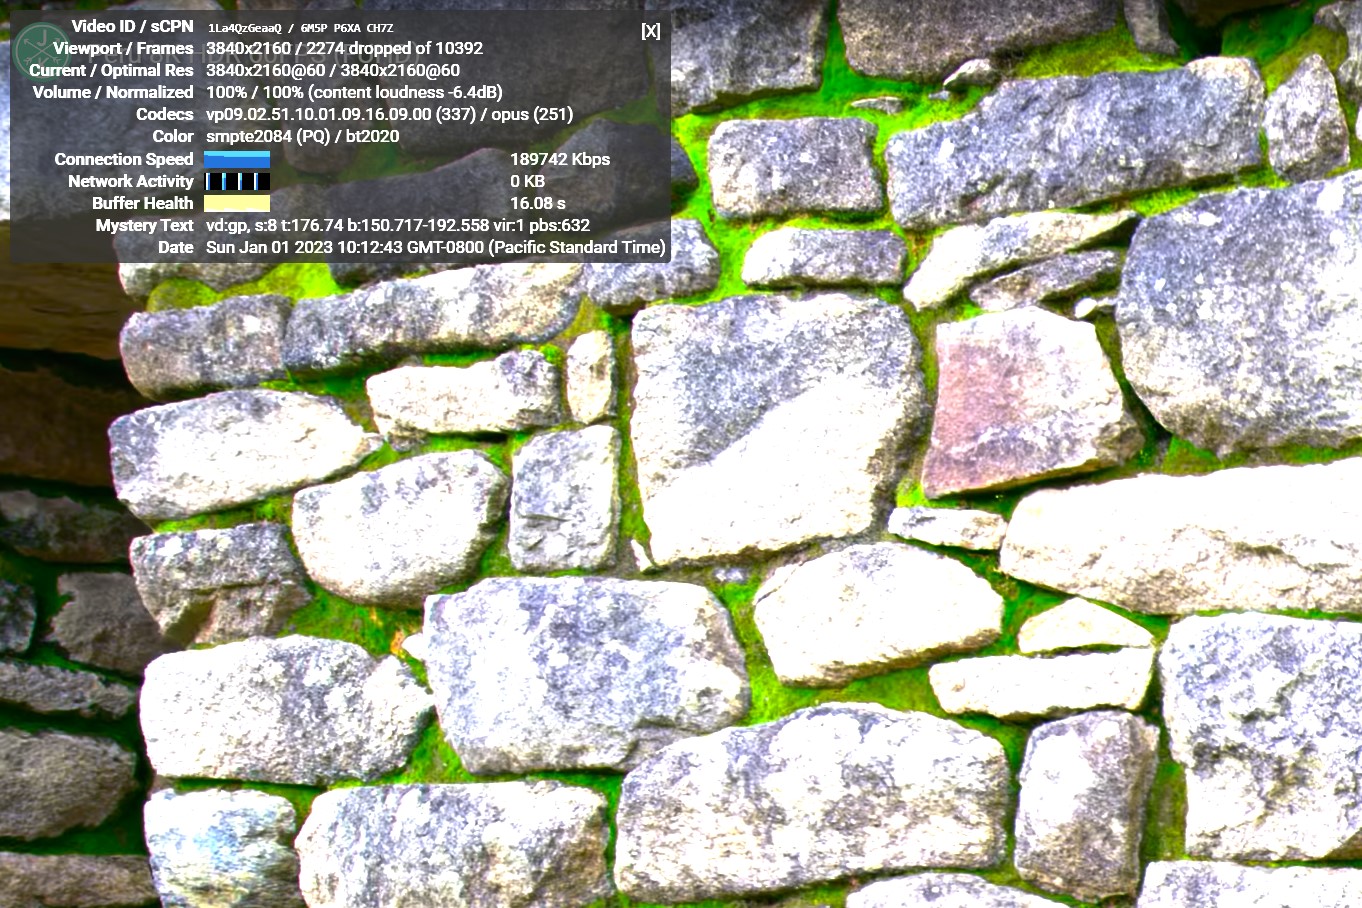
YouTube Streaming Statistics
The GPU in ASRock DeskMeet B660 supports hardware decoding of VP9 Profile 2, and we see the stream encoded with that codec being played back. Despite the hardware acceleration, the streaming is not perfect, and playback stutters particularly when the OSD is activated – all of which is reflected in the dropped frames reported in the statistics overlay above.
The streaming efficiency-related aspects such as GPU usage and at-wall power consumption are also graphed below. The spikes of 100% usage of the decoder engine point to regions of dropped frames in the playback.
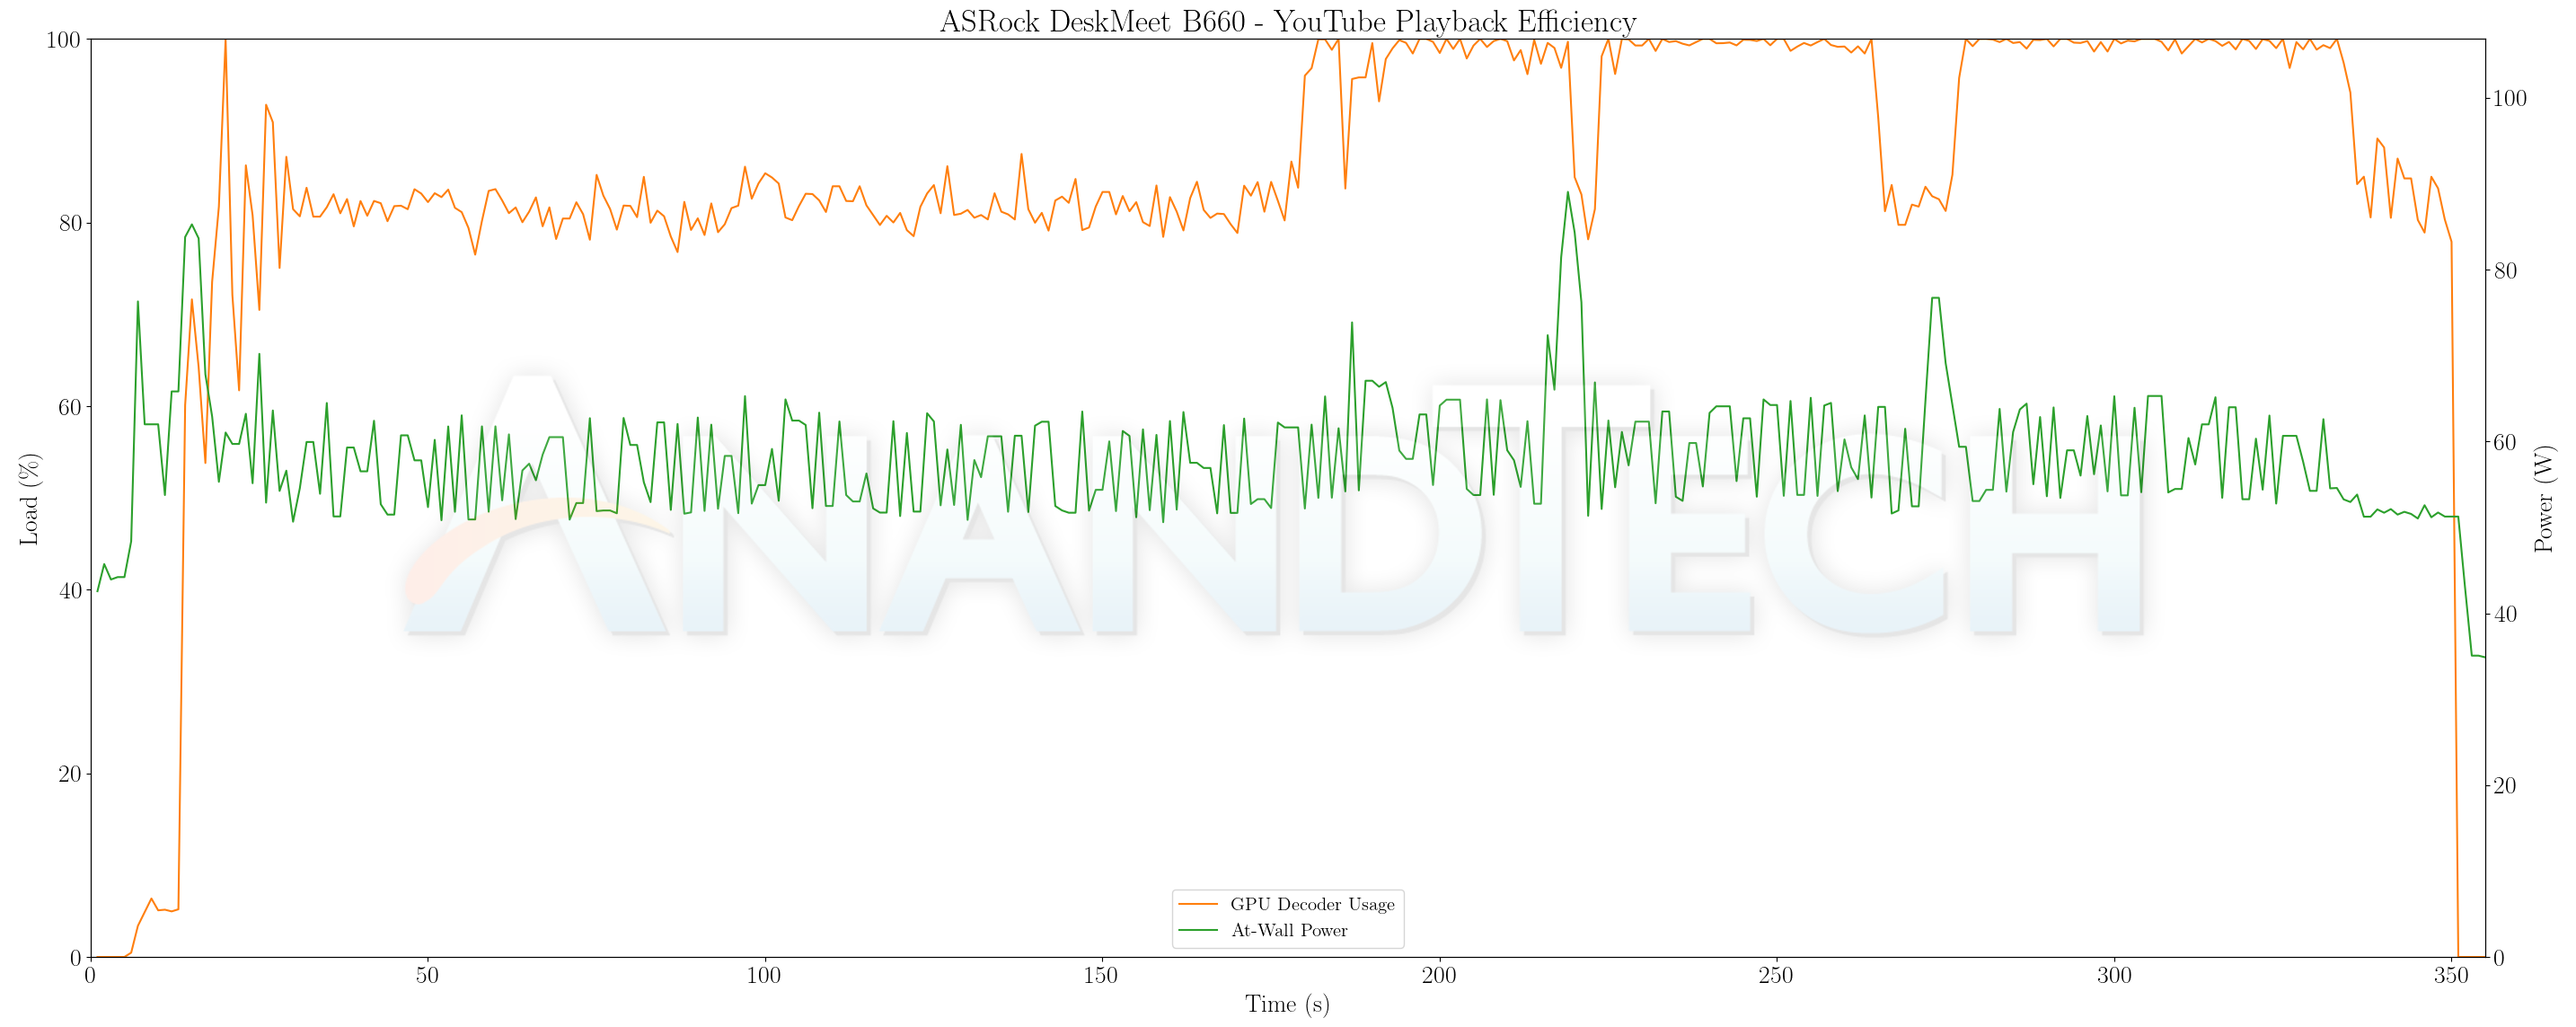

Thanks to the low power consumption of the RX 6400 relative to the discrete GPUs in the other systems, the energy consumption number is also low. But, this is not significantly great news given that there are plenty of dropped frames.
Hardware-Accelerated Encoding and Decoding
Our DeskMeet B660 configuration has no hardware-accelerated encoding capabilities, as the VCE feature is completely absent in the RX 6400. The capabilities of the decoder engine are brought out by DXVAChecker.
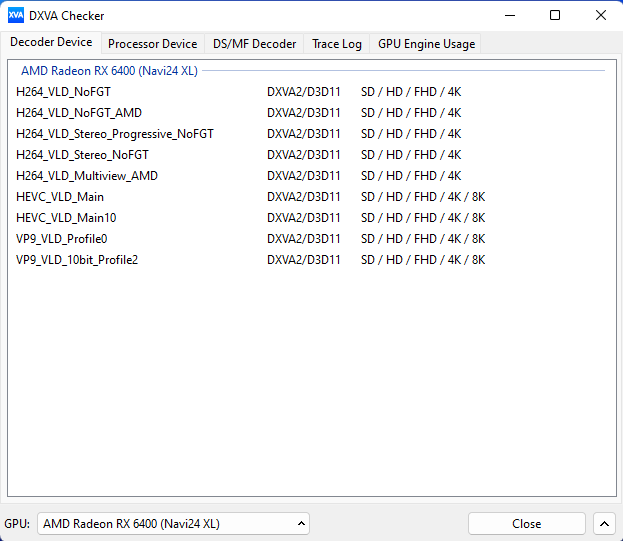
Video Decoding Hardware Acceleration in ASRock DeskMeet B660
Hardware decode is available for AVC, HEVC, and VP9. In our Cezenne review, I had pointed out that attempting to use the decoder engine for certain VC-1 clips resulted in a driver crash. Such an issue didn’t arise in the DeskMeet B660 case – AMD simply decided to do away with the hardware decode capabilities for the offending codec in the RX 6400.
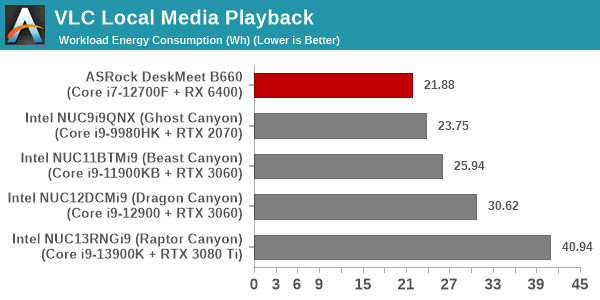
Local Media Playback
Evaluation of local media playback and video processing is done by playing back files encompassing a range of relevant codecs, containers, resolutions, and frame rates. A note of the efficiency is also made by tracking GPU usage and power consumption of the system at the wall. Users have their own preference for the playback software / decoder / renderer, and our aim is to have numbers representative of commonly encountered scenarios. Our Q4 2022 test suite update replaces MPC-HC (in LAV filters / madVR modes) with mpv. In addition to being cross-platform and open-source, the player allows easy control via the command-line to enable different shader-based post-processing algorithms. From a benchmarking perspective, the more attractive aspect is the real-time reporting of dropped frames in an easily parseable manner. The players / configurations considered in this subsection include:
- VLC 3.0.18
- Kodi 20.0rc2
- mpv 0.35 (hwdec auto, vo=gpu-next)
- mpv 0.35 (hwdec auto, vo=gpu-next, profile=gpu-hq)
Fourteen test streams (each of 90s duration) were played back from the local disk with an interval of 30 seconds in-between. Various metrics including GPU usage, at-wall power consumption, and total energy consumption were recorded during the course of this playback.
All our playback tests were done with the desktop HDR setting turned on. It is possible for certain system configurations to automatically turn on/off the HDR capabilities prior to the playback of a HDR video, but, we didn’t take advantage of that in our testing.
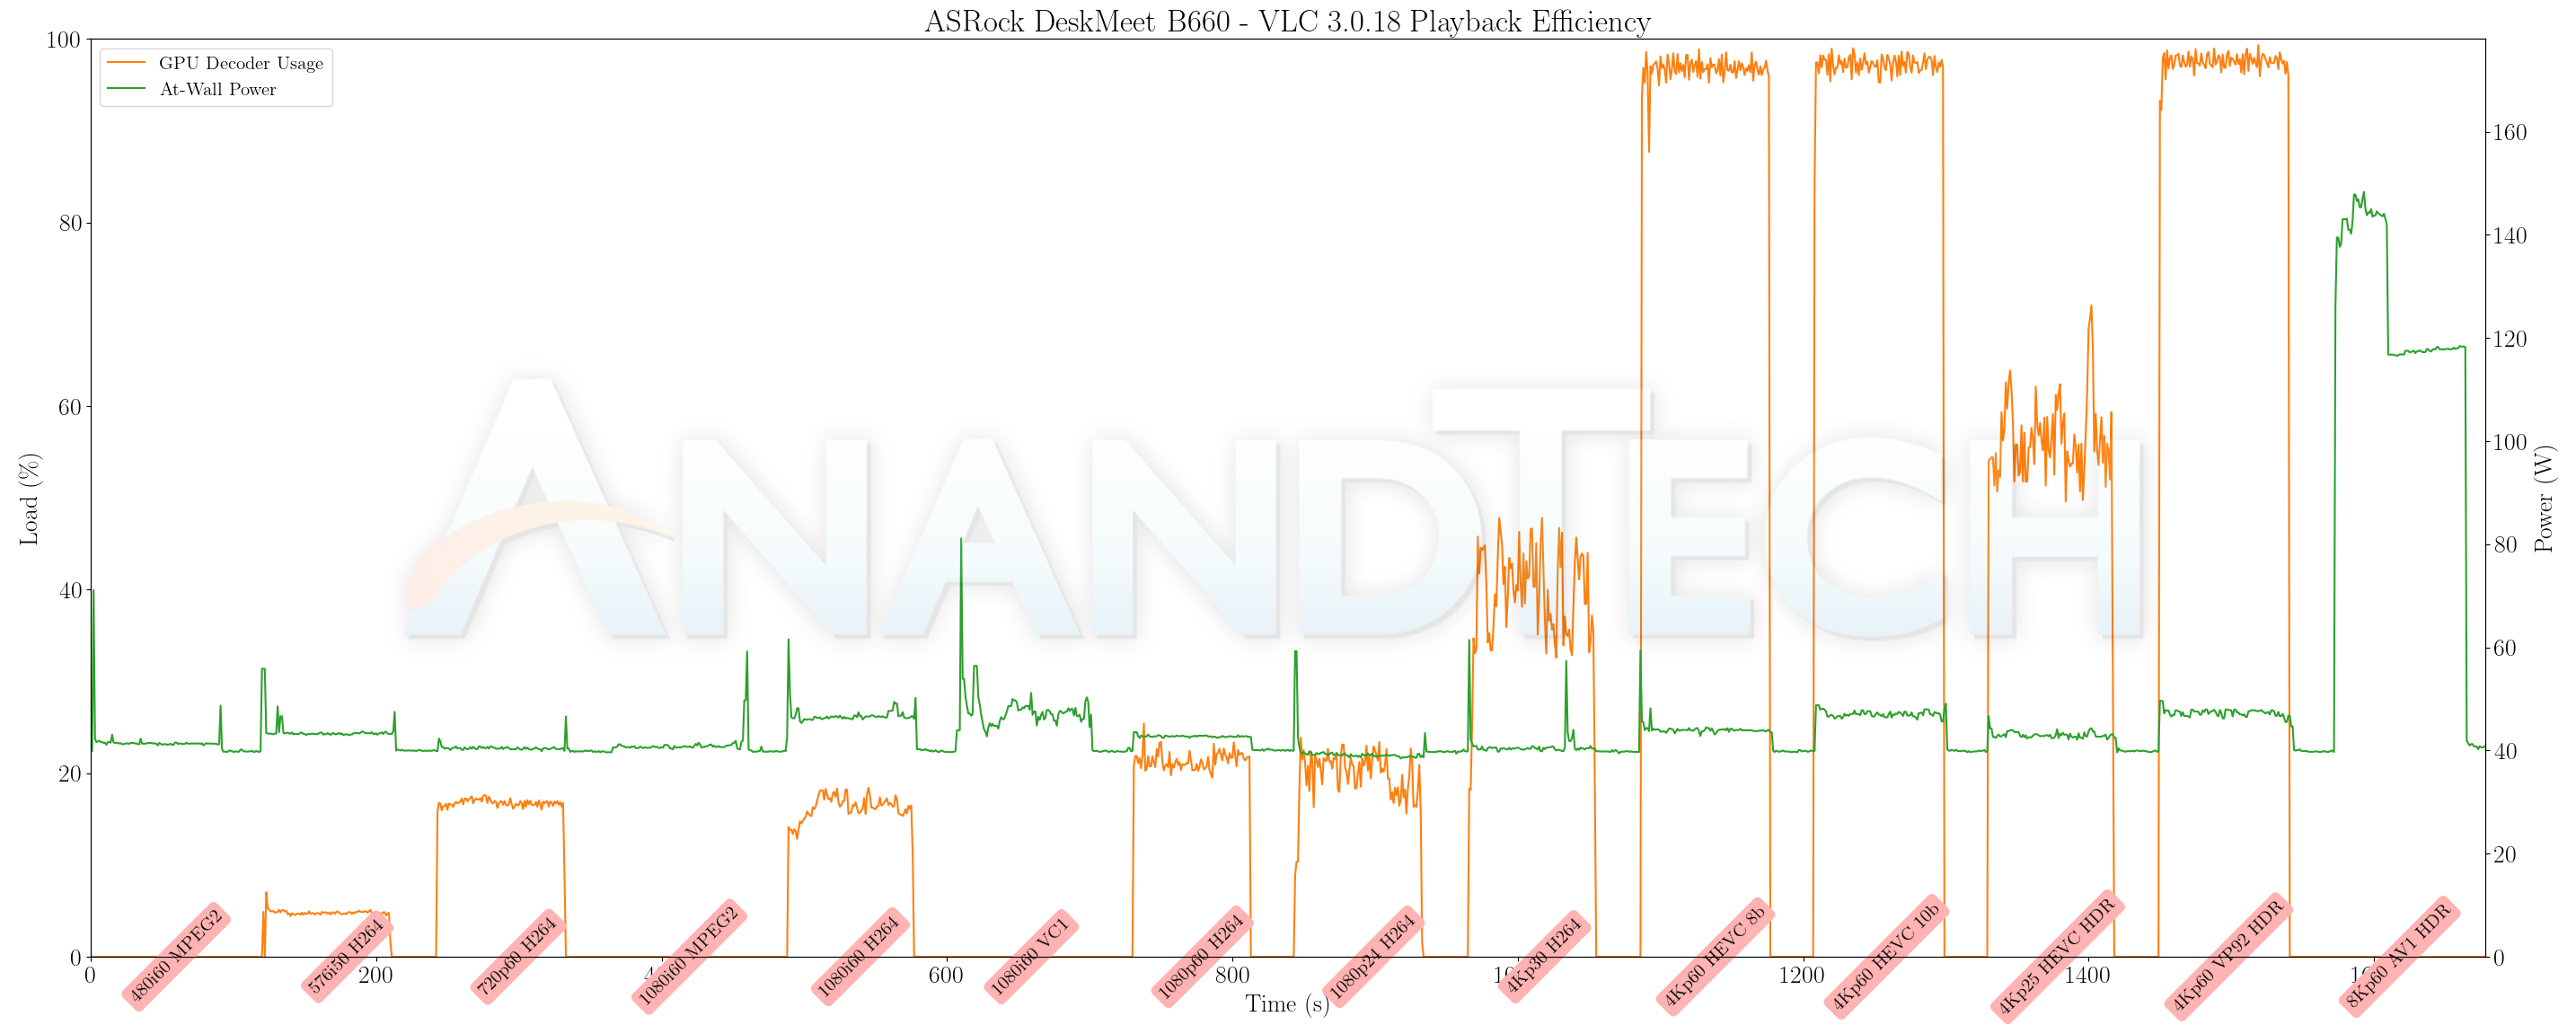
VLC has no trouble taking advantage of hardware acceleration for the supported codecs. The playback was also without any visible dropped frames, except for the AV1 clip.
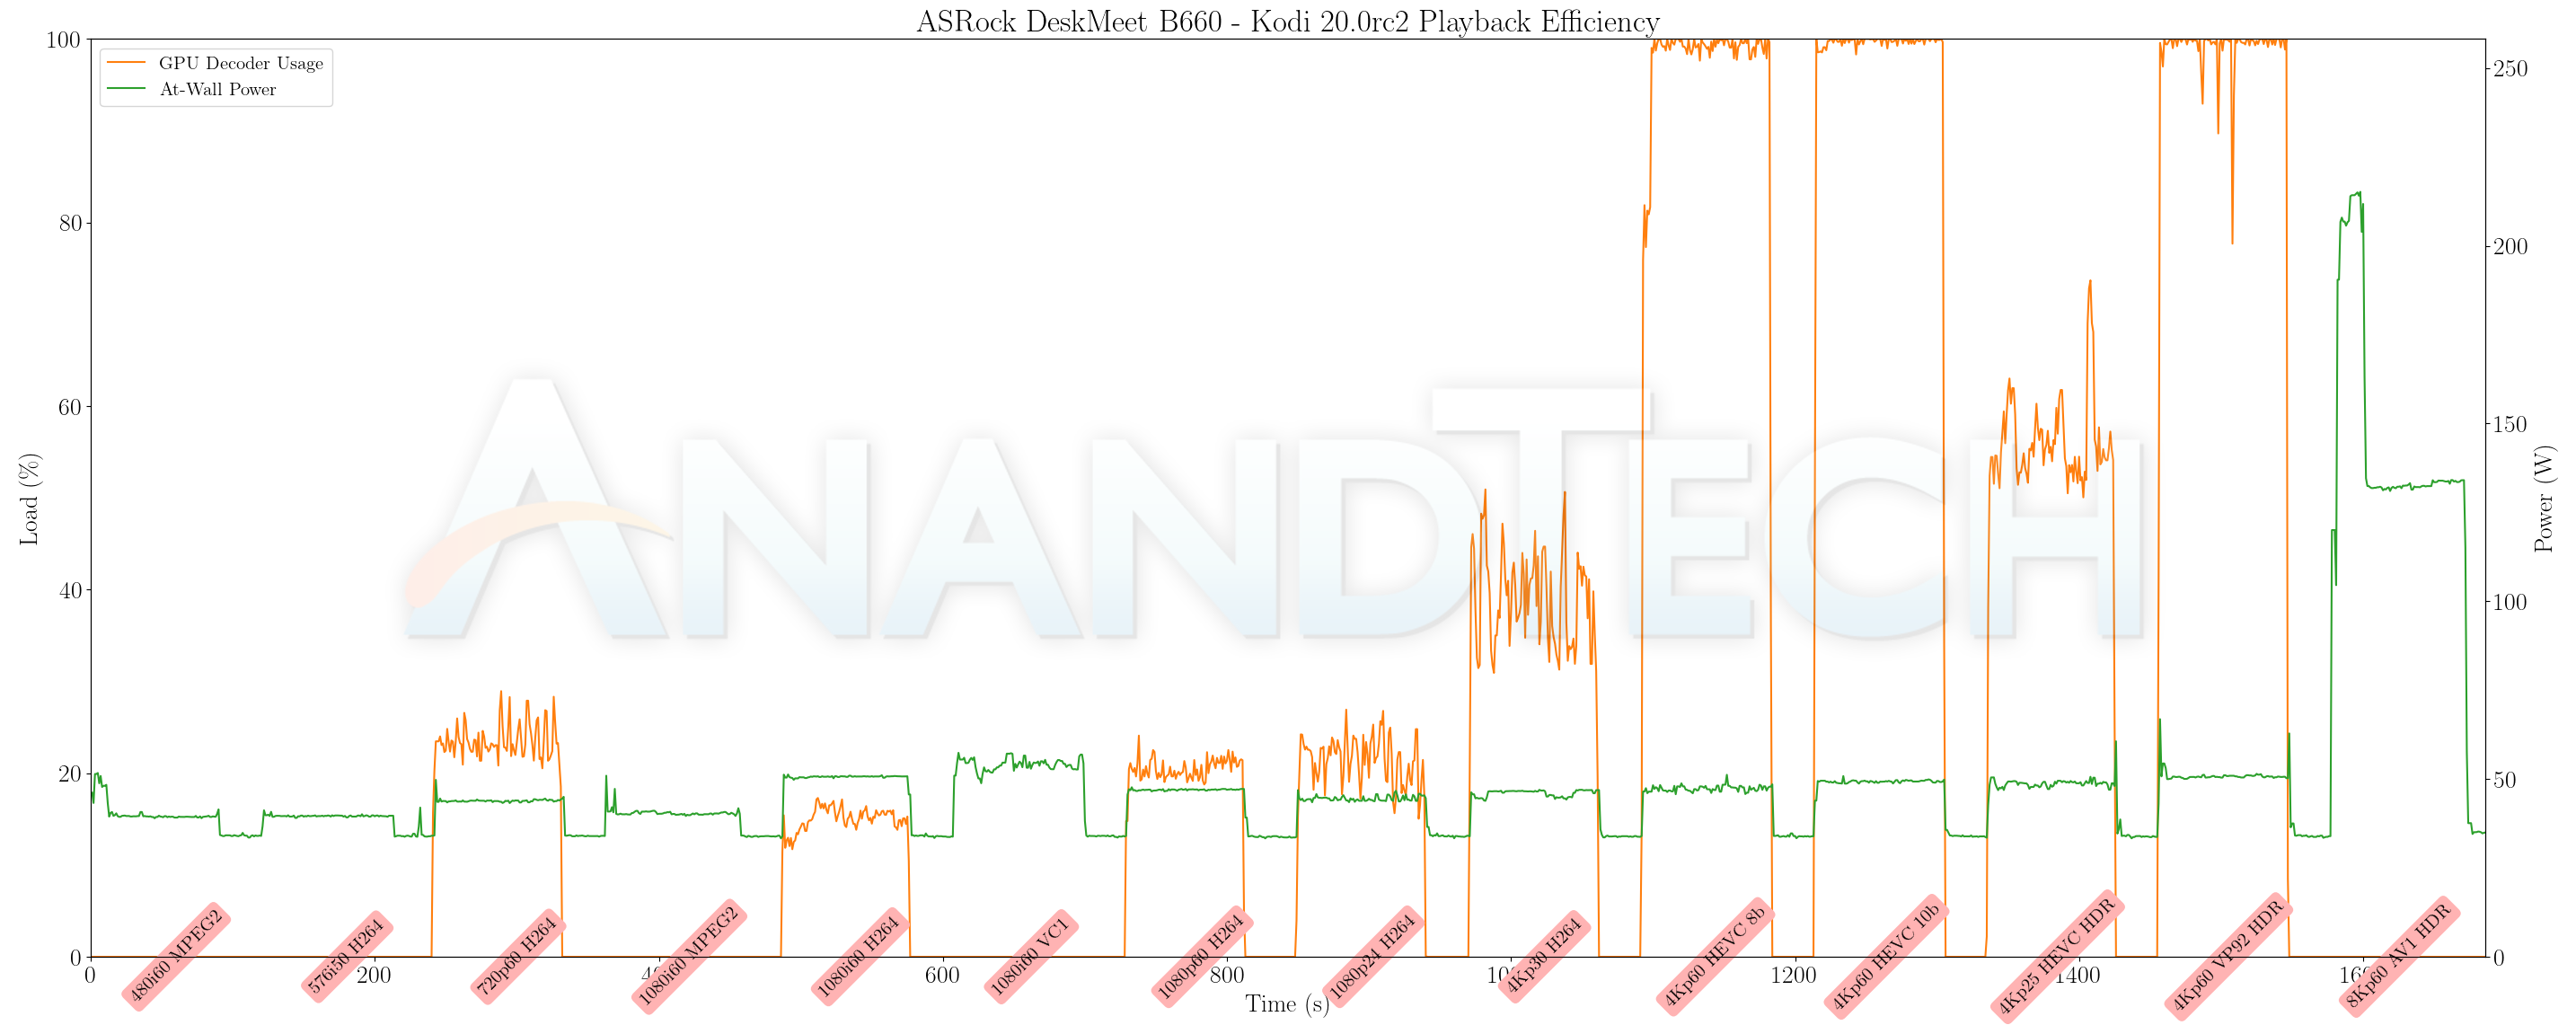

Kodi is a bit more taxing on the GPU, and the 4Kp60 clips started encountering playback issues. Ordinarily, even iGPUs have no trouble in this case, but the experience with the AMD GPU left a lot to be desired.
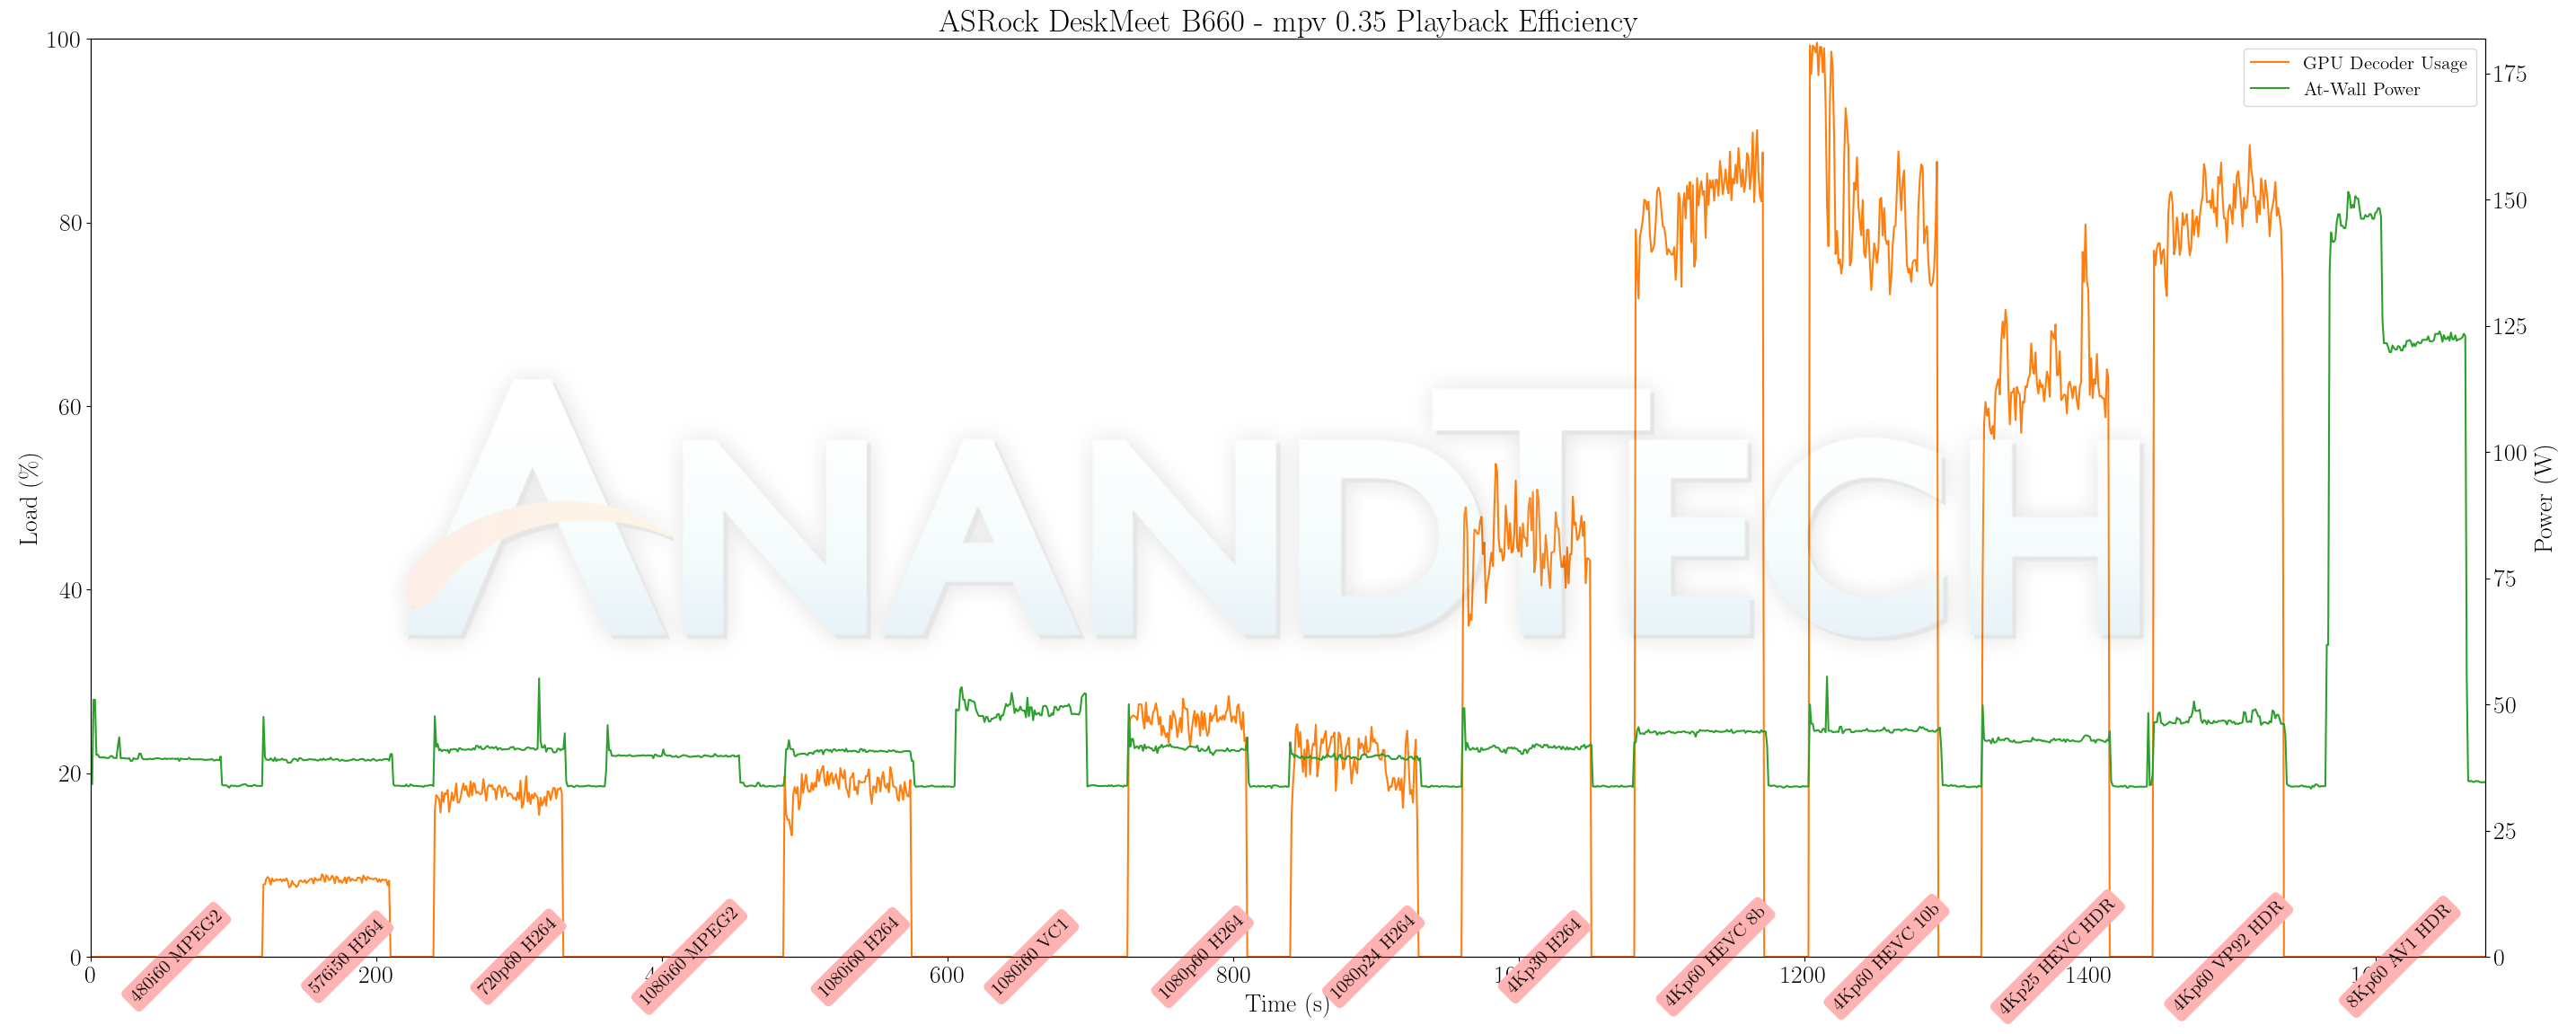
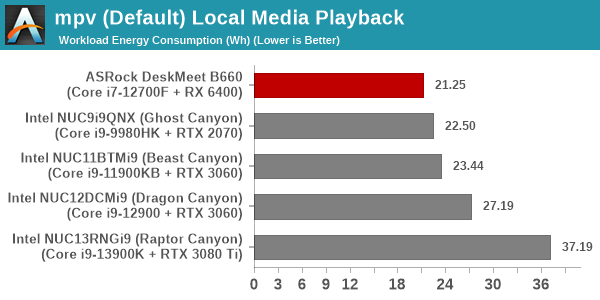
mpv is much more leaner on resources compared to Kodi, and that shows in the decoding efficiency graph above. Even with hardware decoding active, the other parts of the GPU are not stretched much, resulting in better GPU utilization compared to even VLC.
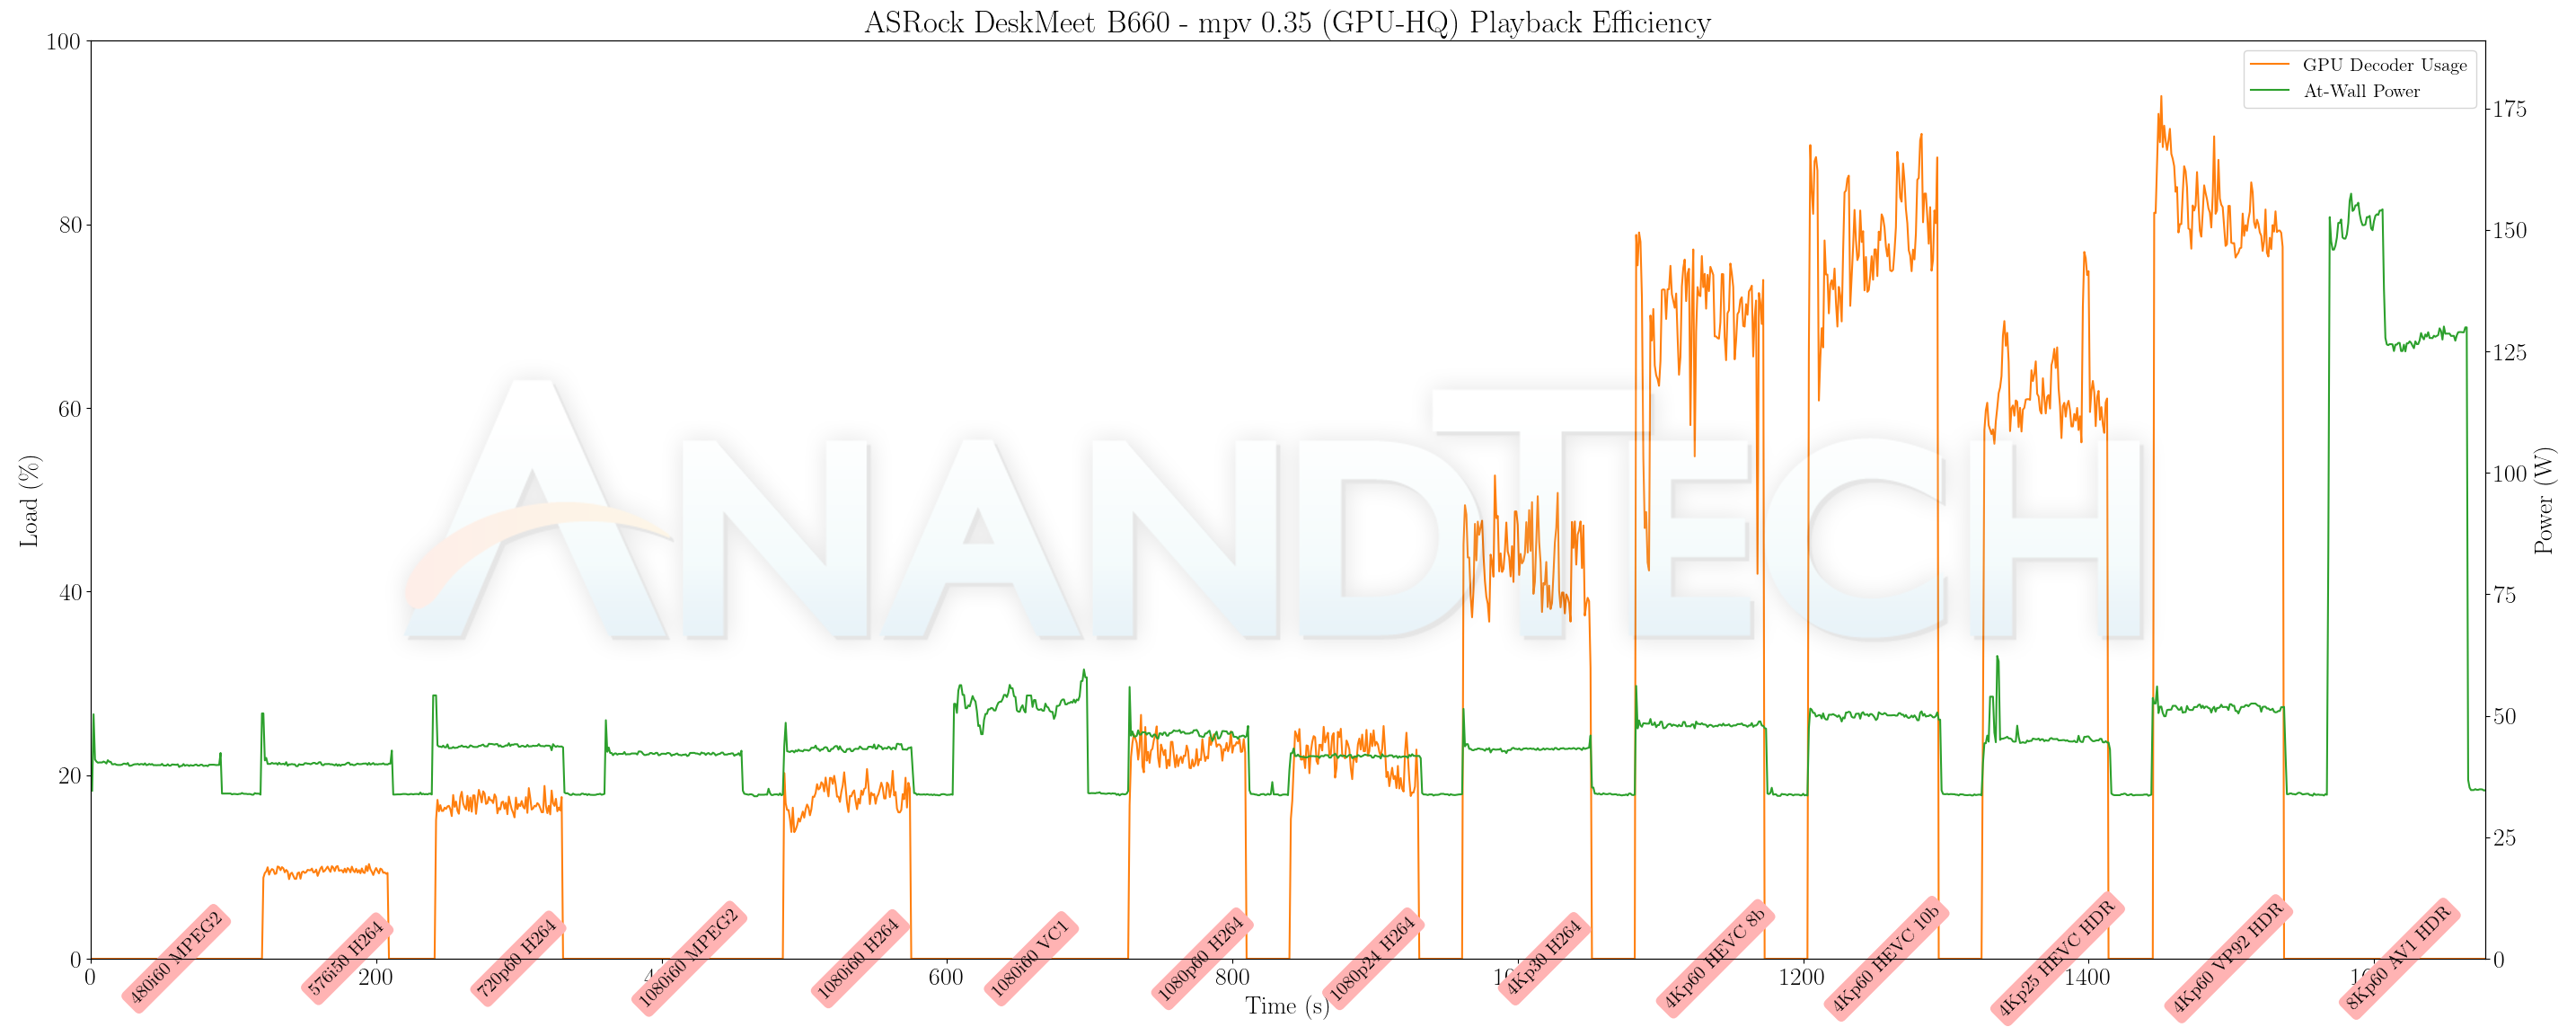

Adding shader operations for video post processing results in an increase in energy consumption, but there were no dropped frames in either case except for the 8Kp60 AV1 clip which played like a slideshow.
The power consumption at the wall was measured with a 4K display being driven through the HDMI port of the system. In the graph below, we compare the idle and load power of the ASRock DeskMeet B660 with other systems evaluated before. For load power consumption, we ran the AIDA64 System Stability Test with various stress components, as well as our custom stress test with Prime95 / Furmark, and noted the peak as well as idling power consumption at the wall.
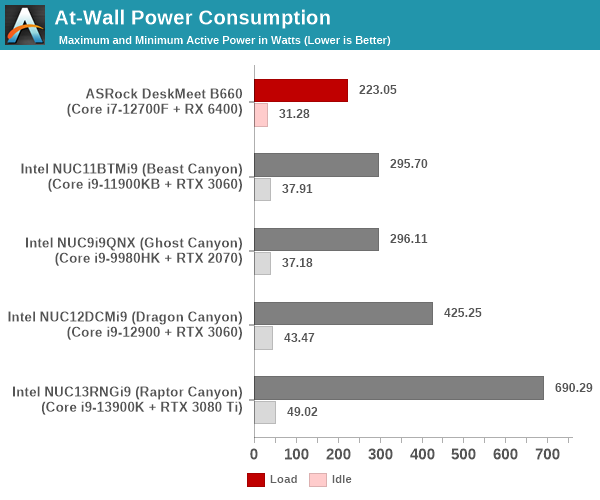
The numbers are consistent with the TDP and suggested PL1 / PL2 values for the processors in the systems, and do not come as any surprise. The Core i7-12700F is configured with a PL1 of 65W and PL2 of 126W, with PL1 duration locked to 28s, and PL2 to 2.44ms. Compared to the other processors, this is quite conservative. The discrete GPU is also rated for a 54W TDP, and these aspects contribute to the low load and idling power consumption numbers seen above.
Stress Testing
Our thermal stress routine is a combination of Prime95, Furmark, and Finalwire’s AIDA64 System Stability Test. The following 9-step sequence is followed, starting with the system at idle:
- Start with the Prime95 stress test configured for maximum power consumption
- After 30 minutes, add Furmark GPU stress workload
- After 30 minutes, terminate the Prime95 workload
- After 30 minutes, terminate the Furmark workload and let the system idle
- After 30 minutes of idling, start the AIDA64 System Stress Test (SST) with CPU, caches, and RAM activated
- After 30 minutes, terminate the previous AIDA64 SST and start a new one with the GPU, CPU, caches, and RAM activated
- After 30 minutes, terminate the previous AIDA64 SST and start a new one with only the GPU activated
- After 30 minutes, terminate the previous AIDA64 SST and start a new one with the CPU, GPU, caches, RAM, and SSD activated
- After 30 minutes, terminate the AIDA64 SST and let the system idle for 30 minutes
Traditionally, this test used to record the clock frequencies – however, with the increasing number of cores in modern processors and fine-grained clock control, frequency information makes the graphs cluttered and doesn’t contribute much to understanding the thermal performance of the system. The focus is now on the power consumption and temperature profiles to determine if throttling is in play.
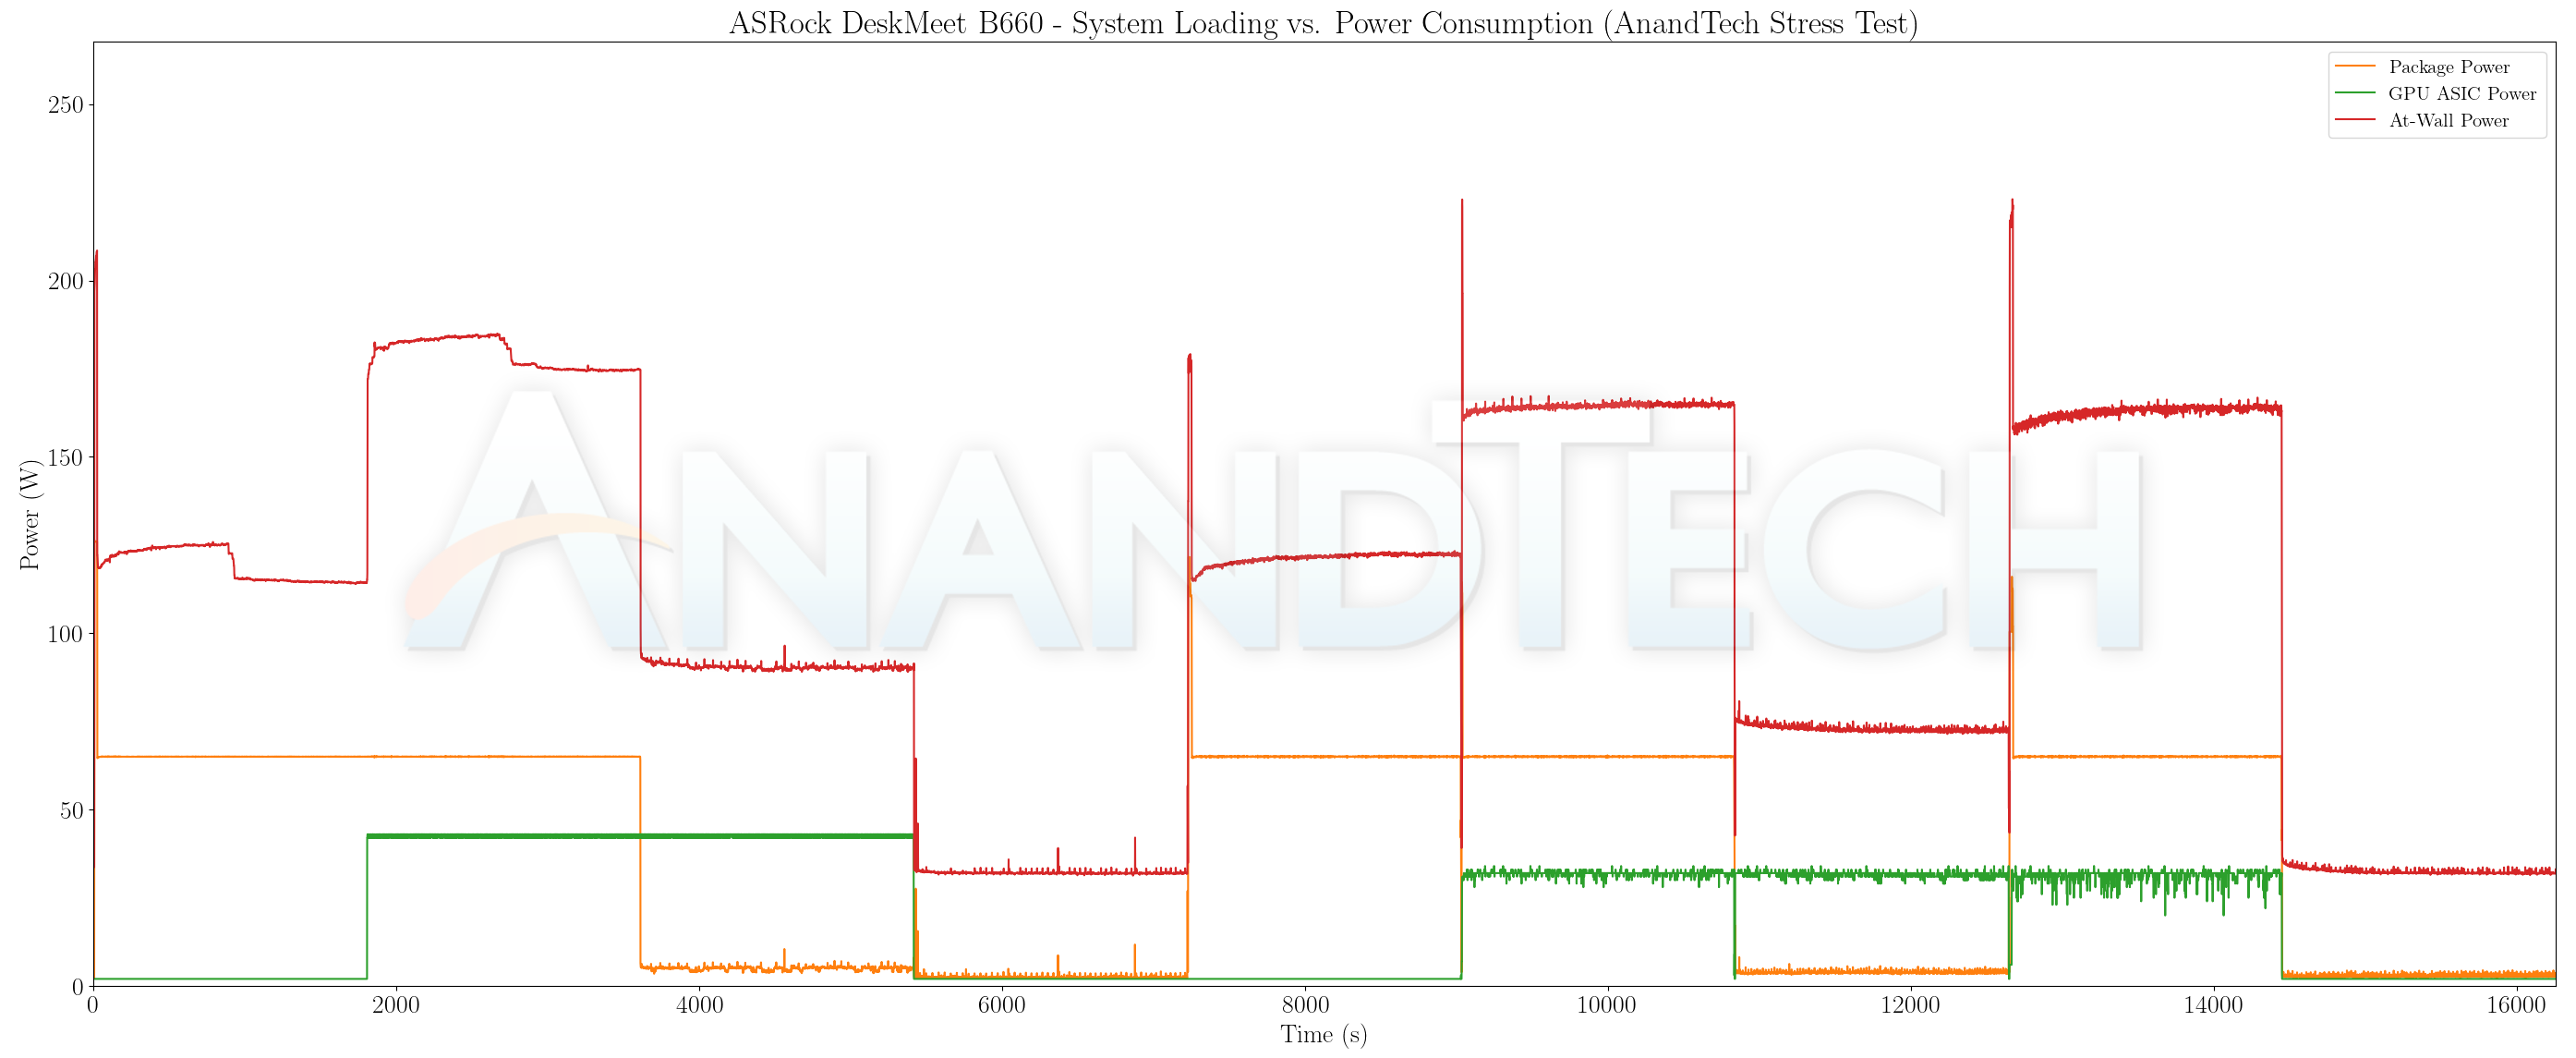
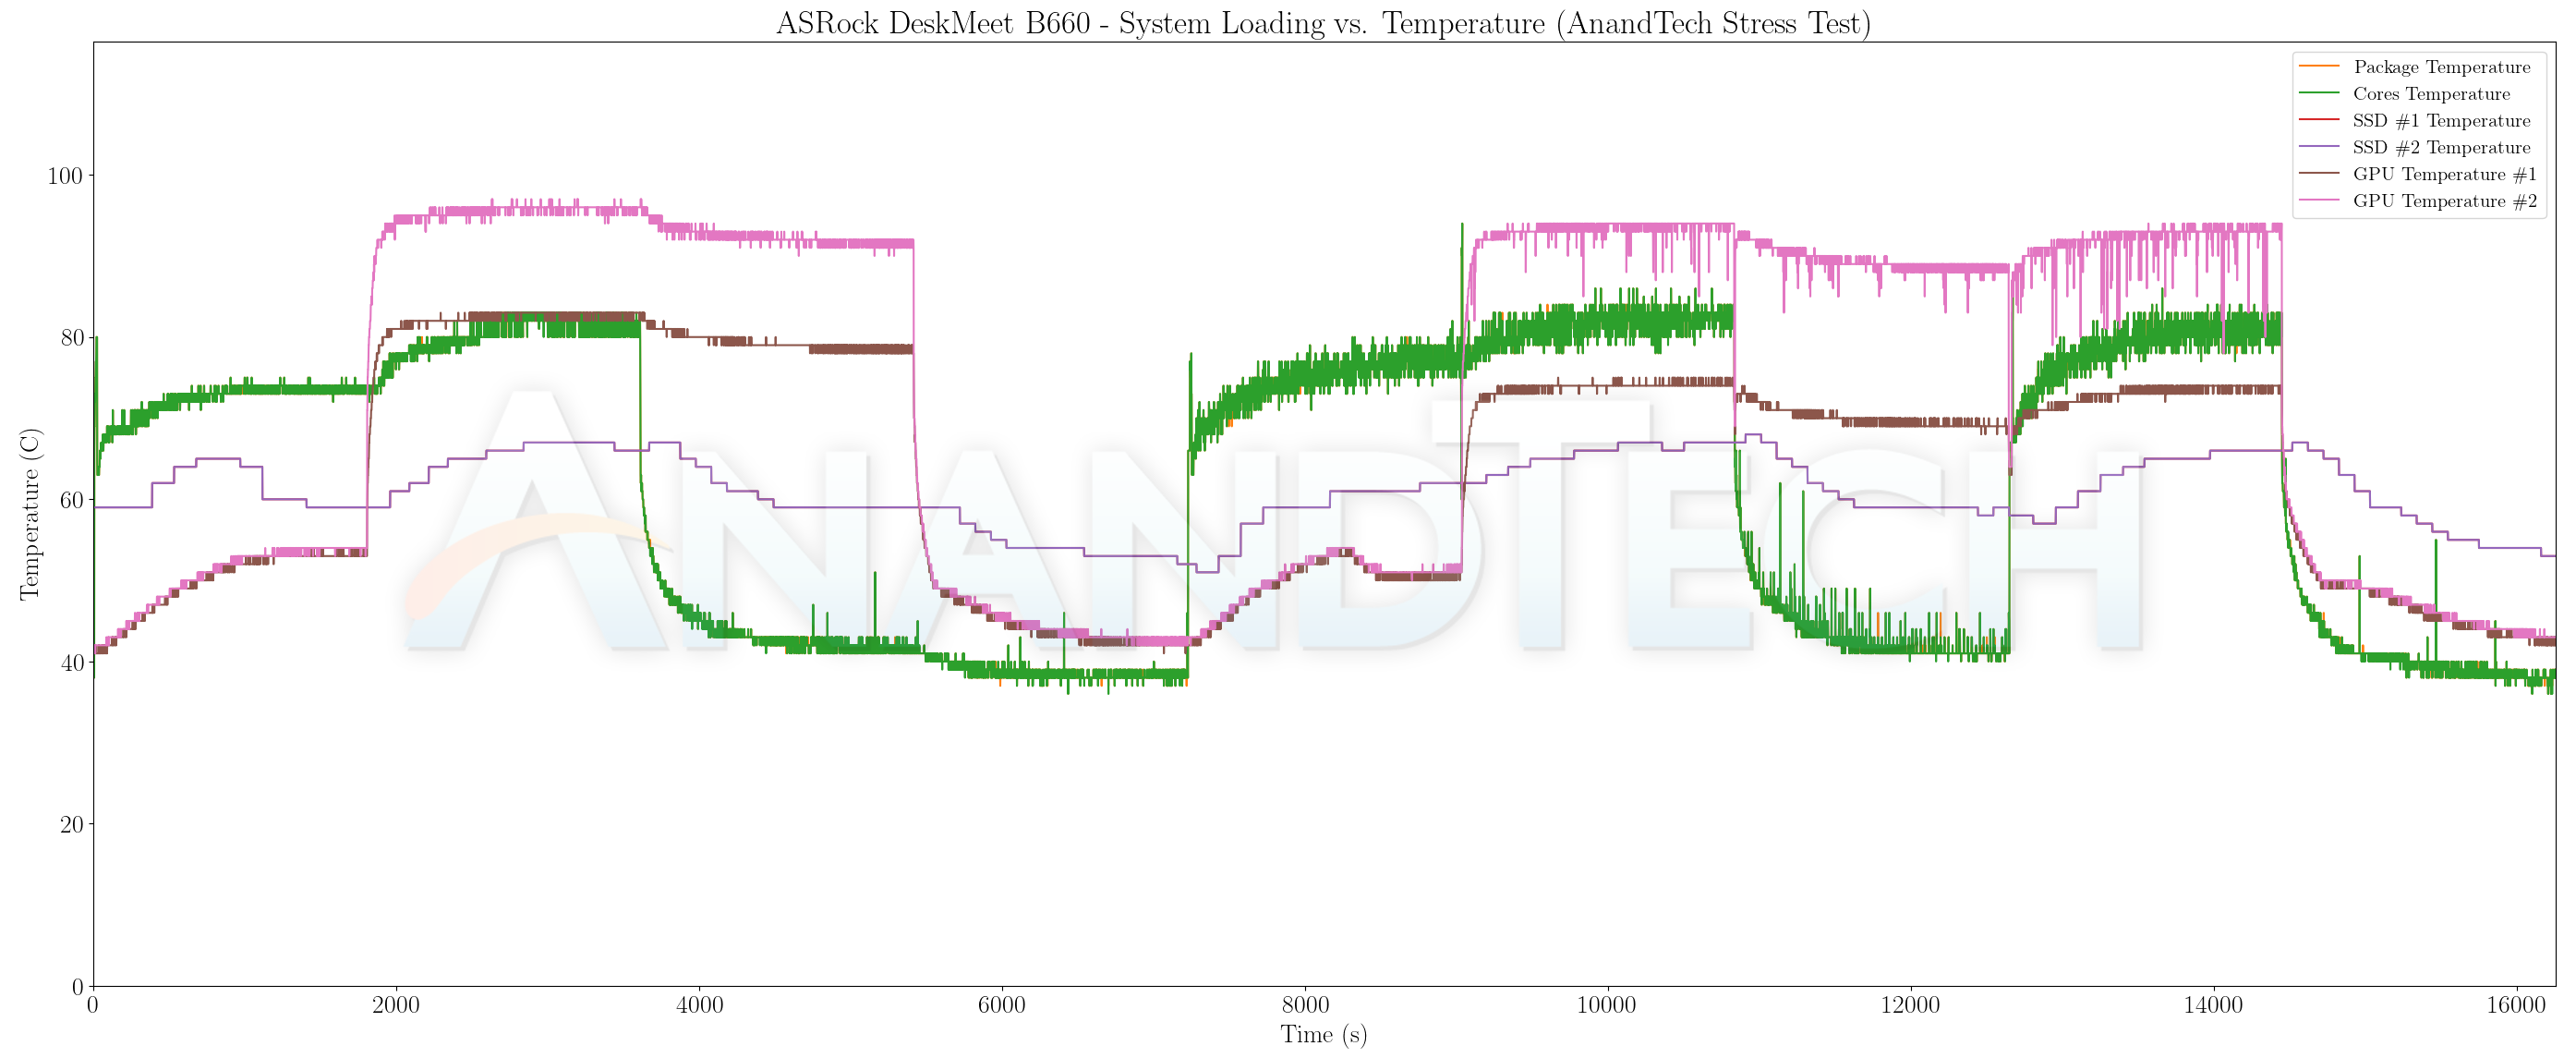
The power consumption numbers for the CPU package and GPU hardly waver under sustained load, and stay close to expectations (65W for the CPU package, and around 45W for the GPU – the ASIC power is a bit lower than the TDP). On the temperature front, the GPU does get a bit toasty, but probably stays well within rated numbers as the power consumption doesn’t change and the temperature ends up plateauing. The CPU package itself doesn’t go beyond 80C – a testament to the effectiveness of the Silverstone Hydrogon H90 ARGB cooler.
The worrisome part is actually the temperature of the SSD. It rarely drops below 60C even when subjected to no load. After finishing up our evaluation routine, we realized that the absence of a proper thermal solution coupled with the complete absence of airflow for the underside of the motherboard resulted in sub-optimal storage performance.
Networking and storage are aspects that may be of vital importance in specific PC use-cases. The ASRock DeskMeet B660 comes with a single GbE LAN port, and supports installation of a M.2 2230 Wi-Fi/BT combo module (either normal or CNVi WLAN cards). Our review configuration did not involve enabling of wireless networking capabilities. Gigabit networking with the Intel I-219V is the bare minimum expected from a B660 motherboard, and ASRock has opted to keep costs to the minimum by not opting for a 2.5GbE port or dual LAN capabilities.
On the storage side, ASRock provides support for up to 3 SATA ports (usable as 1x 3.5″ or 2x 2.5″ drives only due to chassis size limitations) and two M.2 2280 PCIe 4.0 x4 NVMe slots (one of which supports SATA SSDs too). The review system was configured with a Mushkin Vortex Redline NVMe SSD. From a benchmarking perspective, we provide results from the WPCstorage test of SPECworkstation 3.1. This benchmark replays access traces from various programs used in different verticals and compares the score against the one obtained with a 2017 SanDisk 512GB SATA SSD in the SPECworkstation 3.1 reference system.
| SPECworkstation 3.1.0 – WPCstorage SPEC Ratio Scores | |||

The graphs above present results for different verticals, as grouped by SPECworkstation 3.1. The storage workload consists of 60 subtests. Access traces from CFD solvers and programs such as Catia, Creo, and Soidworks come under ‘Product Development’. Storage access traces from the NAMD and LAMMPS molecular dynamics simulator are under the ‘Life Sciences’ category. ‘General Operations’ includes access traces from 7-Zip and Mozilla programs. The ‘Energy’ category replays traces from the energy-02 SPECviewperf workload. The ‘Media and Entertainment’ vertical includes Handbrake, Maya, and 3dsmax. Due to thermal limitations and the absence of cooling for the SSD installed on the underside of the motherboard, the drive only performed as good as a SATA SSD. Our advice to system builders looking at the DeskMeet B660 is to utilize the M.2 slot closer to the PCH and also equip it with an appropriate cooling solution. The airflow around the area is a bit suspect, particularly when an add-in card is installed in the PCIe slot – so, even regular PCIe 3.0 NVMe cards might suffer from reduced performance.
Closing Thoughts
The ASRock DeskMeet B660 provided us with the opportunity to evaluate an alternative to the NUC Extreme models. The company’s focus has been on the value proposition. There are no fancy features like NBASE-T LAN ports or Thunderbolt 4. The USB ports are also run of the mill, and the absence of a Gen 2×2 port despite the PCH supporting it is a missed opportunity. However, these choices have enabled ASRock to market the motherboard, case, and PSU together for just $191. This is much lower compared to the $1000+ pricing for the NUC Extreme units, but the processor price is not budgeted in.
Leaving the processor choice to the end consumer is perfect for the market, but we are not pleased with some of the shortcuts taken to achieve the lower price. In particular, the placement of the M.2 SSD slot on the motherboard’s underside without accounting for airflow or any other thermal solution is very disappointing. The documentation (in terms of explicitly pointing out the distribution of the platform’s high-speed I/O lanes to the various ports in the system) could also do with a bit of an update.
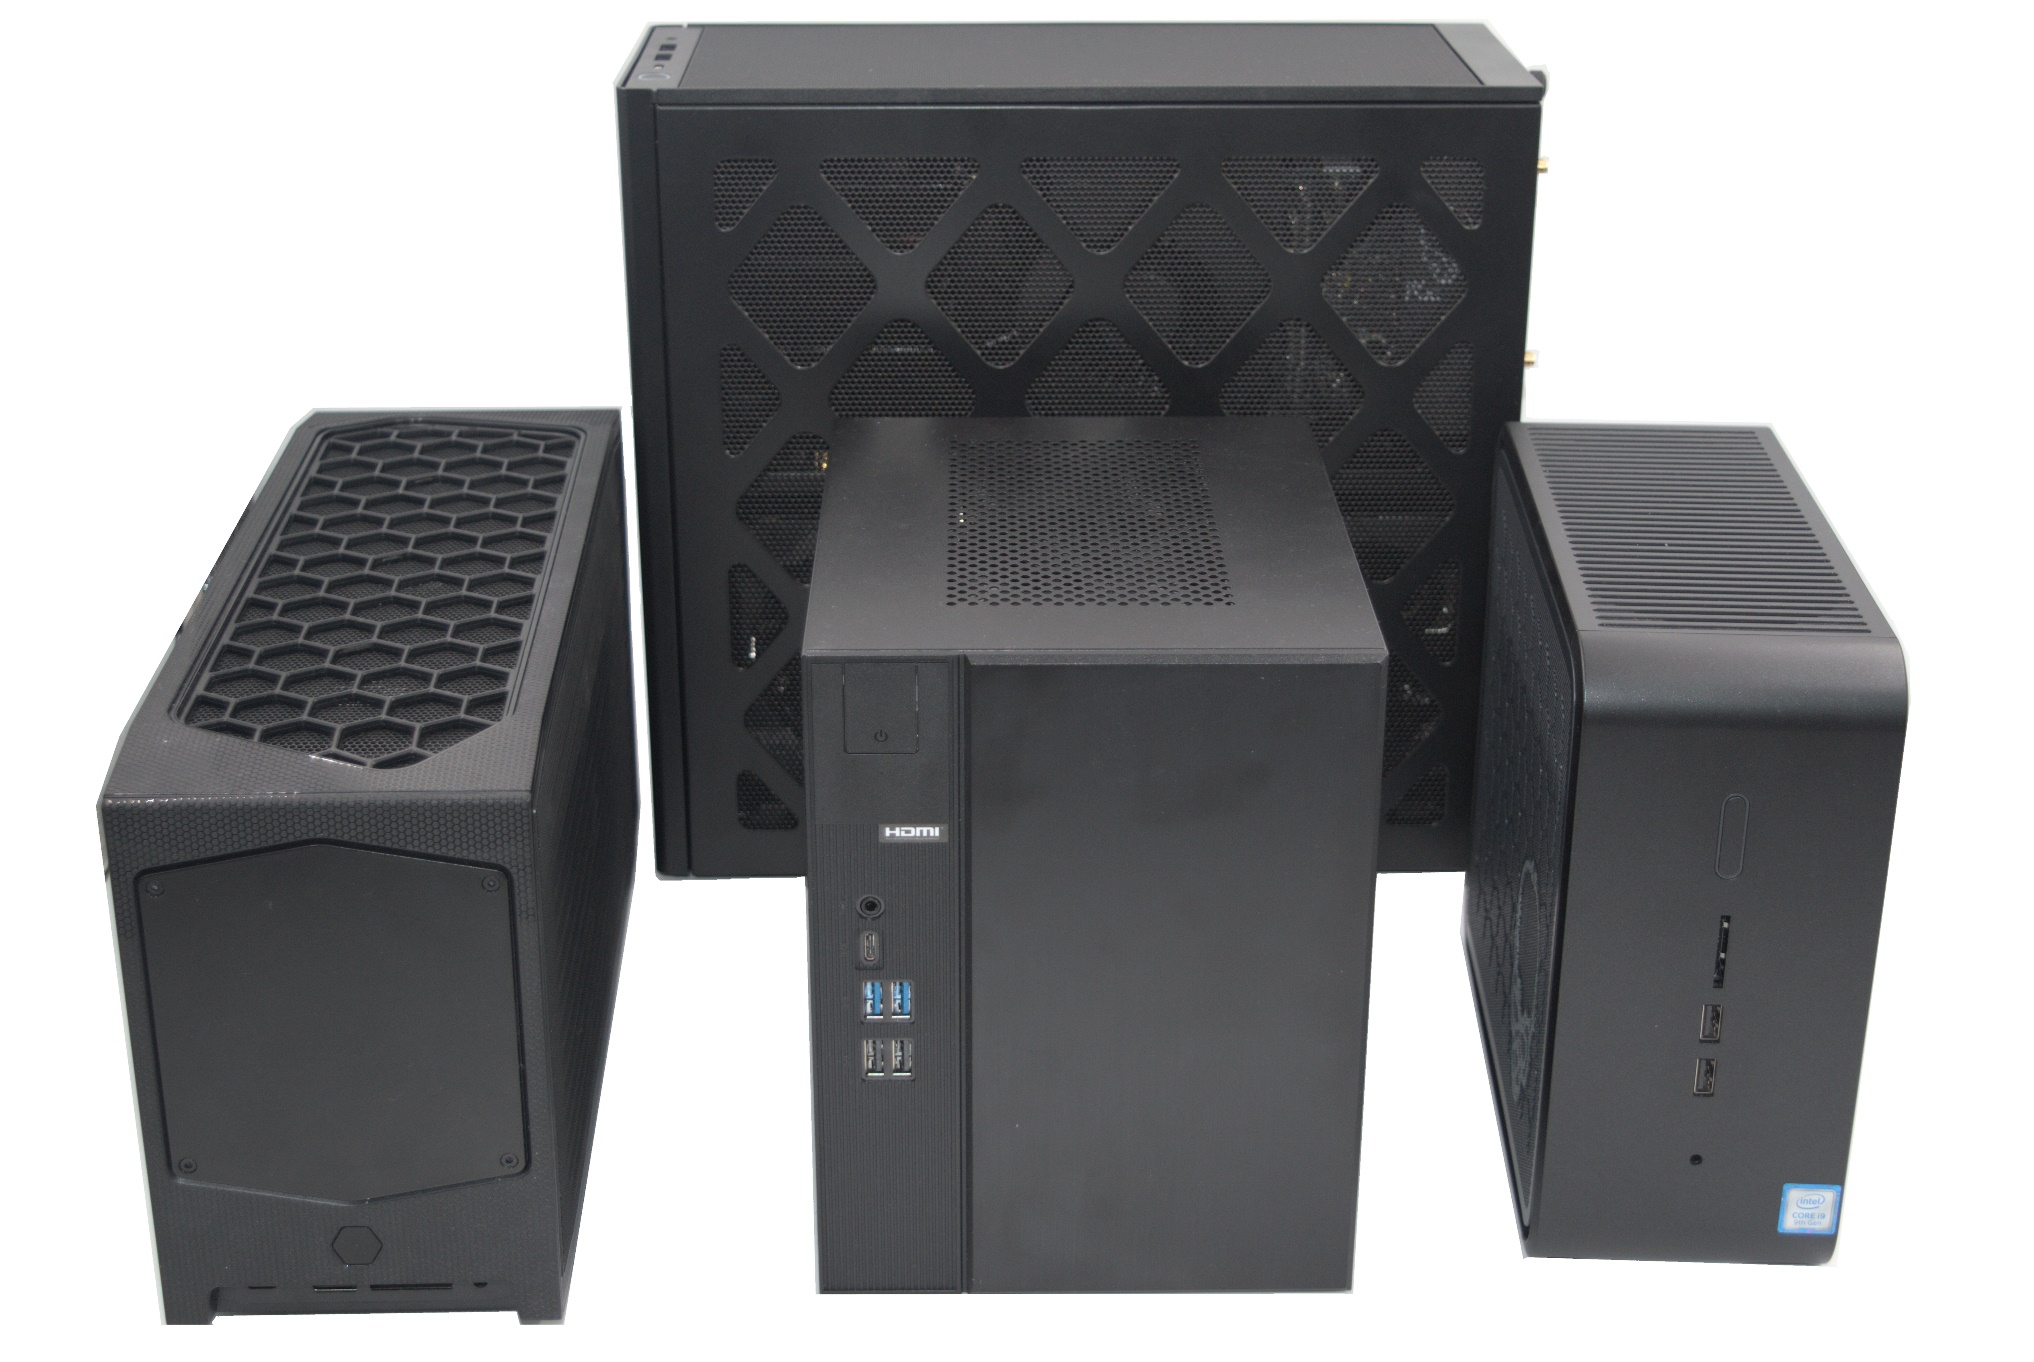
The ASRock DeskMeet B660 and NUC Extreme Models
In terms of the review configuration choices, the Core i7-12700F is an ideal fit for this system. In terms of CPU prowess, the DeskMeet B660 is able to easily rival the Dragon Canyon NUC. The RX 6400 is a passable GPU that helps the end user to keep the power consumption numbers as well as total system cost low. Gaming performance is passable – most games can be played at 1080p resolution with medium settings. Multimedia performance leaves a lot to be desired, as described in the HTPC section. The system does allow for installation of GPUs up to 200mm in length. Options include the ASUS Dual GeForce RTX™ 3060 Ti MINI OC Edition and the ASRock AMD Radeon™ RX 6600 XT Challenger ITX 8GB.
Despite some minor quibbles, we have to say that the ASRock DeskMeet B660 presents consumers with an effective low-cost alternative to the NUC Extreme models. Obviously, the lower price point means that consumers lose out on a number of premium features and overall system characteristics such as thermal solution effectiveness and I/O capabilities. If CPU and GPU performance are the only criteria, the DeskMeet B660 can definitely fit the bill with an appropriate choice of components. The presence of four DIMM slots also helps it serve use-cases that require a large amount of RAM (such as running multiple virtual machines simultaneously) – in this aspect, the DeskMeet B660 is able to surpass even the NUC Extreme models. Support for both Alder Lake and Raptor Lake CPUs gives the product a longer runway in the market. Overall, the system is also very competitively priced when compared to DIY builds requiring the purchase of a mini-ITX board, case, and PSU separately.