The What’s Next Western Digital event back in May 2022 saw the introduction of new products in the WD_BLACK lineup. On the portable SSD (PSSD) front, the WD_BLACK P40 Game Drive SSD augmented the company’s strong set of offerings in the gaming market. As a complement to the popular WD_BLACK P50 Game Drive SSD, the new PSSD retained the USB 3.2 Gen 2×2 (20 Gbps) link while adding RGB lighting to the case.
The P40 was launched at a much lower price point compared to the P50. In order to achieve the lower price point and make the P40 a mid-range offering, the company has cut some corners while still advertising the drive as a 2GBps-class one. The review below presents a detailed evaluation of the WD_BLCK P40 Game Drive SSD and compares it against a host of other PSSDs in the same capacity class. Our analysis reveals use-cases where the P40 does make sense to use without spending much more for the premium-class P50.
External bus-powered storage devices have grown both in storage capacity as well as speeds over the last decade. Thanks to rapid advancements in flash technology (including the advent of 3D NAND and NVMe) as well as faster host interfaces (such as Thunderbolt 3 and USB 3.x), we now have palm-sized flash-based storage devices capable of delivering 3GBps+ speeds. While those speeds can be achieved with Thunderbolt, mass-market devices have to rely on USB. Within the USB ecosystem, USB 3.2 Gen 2 (10 Gbps) is fast becoming the entry level for thumb drives and portable SSDs. Premium devices sporting the USB 3.2 Gen 2×2 (20 Gbps) interface have been making it to the market over the last couple of years, with host support in desktops and other computing platforms starting to pick up. Broadly speaking, there are five distinct performance levels in this market:
- 2GBps+ drives with Thunderbolt 3 or USB4, using NVMe SSDs
- 2GBps drives with USB 3.2 Gen 2×2, using NVMe SSDs or direct USB flash drive (UFD) controllers
- 1GBps drives with USB 3.2 Gen 2, using NVMe SSDs or direct UFD controllers
- 500MBps drives with USB 3.2 Gen 1 (or, Gen 2, in some cases), using SATA SSDs
- Sub-400MBps drives with USB 3.2 Gen 1, using UFD controllers
The PSSD we are looking at today – the WD_BLACK P40 Game Drive – belongs to the second category in the above list. Western Digital’s WD_BLACK lineup of products targets the gaming market, with focus on performance numbers as well as industrial design / RGB lighting. The company has also been using the lineup to bring new technology to the market – such as the WD_BLACK P50 Game Drive SSD back in 2019. It was one of the first 20 Gbps PSSDs to hit the market when it was launched. This allowed the company to charge a premium for the high-performance product that continues to this day. In an attempt to expand the lineup with a mid-range offering, WD launched the P40 Game Drive SSD with very similar specs (up to 2000 MBps) earlier this year at a much lower price point.
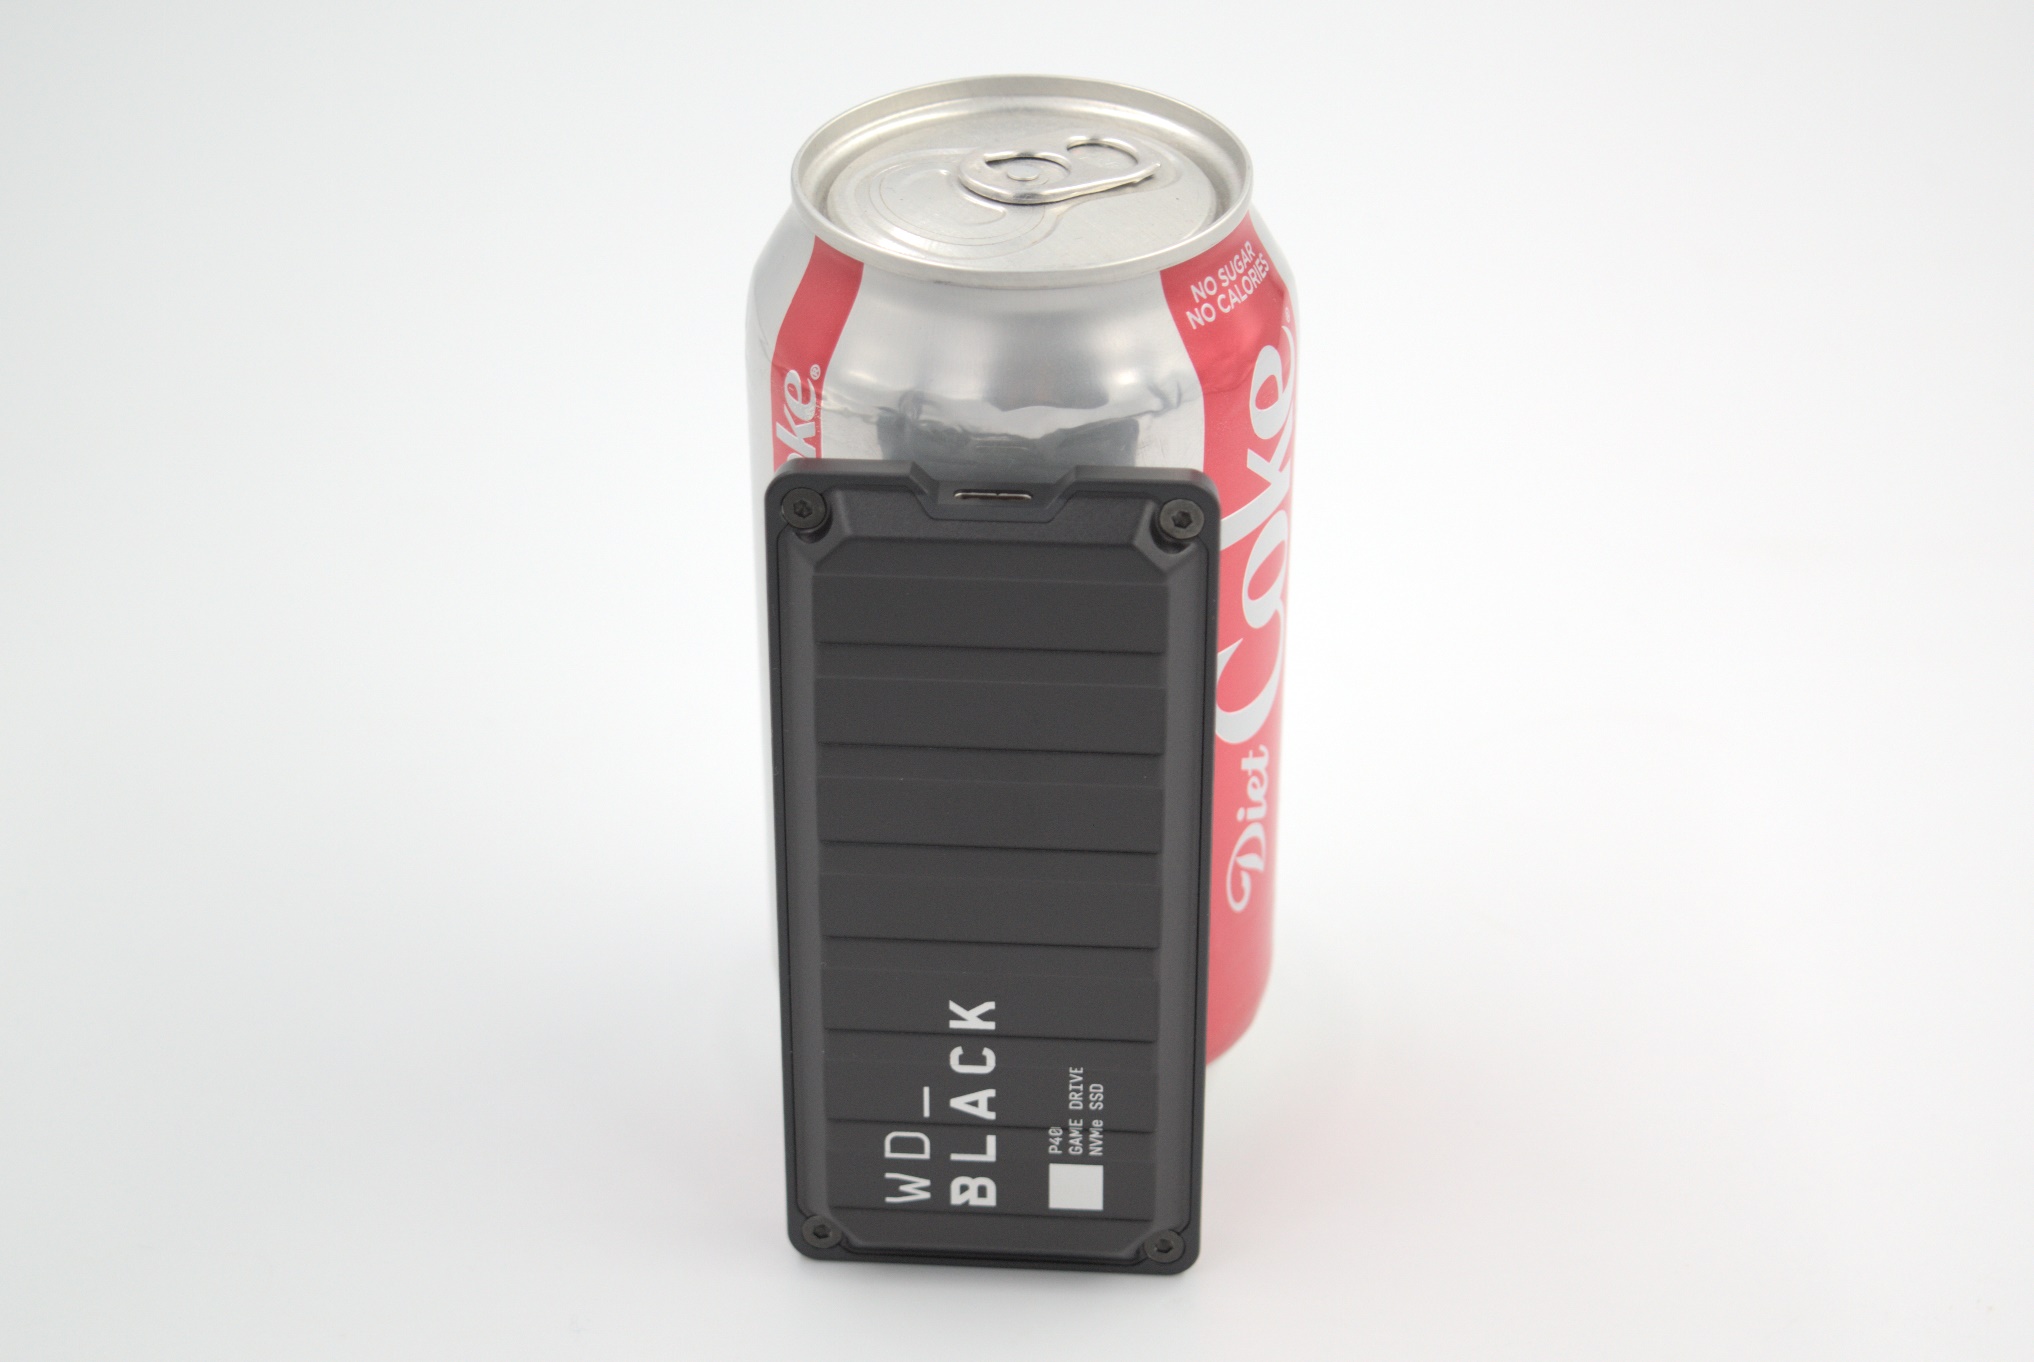
The WD_BLACK P40 Game Drive SSD retains the industrial design and appearance of its premium sibling, while being slightly more compact. One of the key updates appreciated by the target market is the addition of RGB lighting (controllable via WD’s dashboard software) to the case. Instead of supplying two separate cables, WD is providing a single Type-C to Type-C cable with an attached Type-C to Type-A adapter.
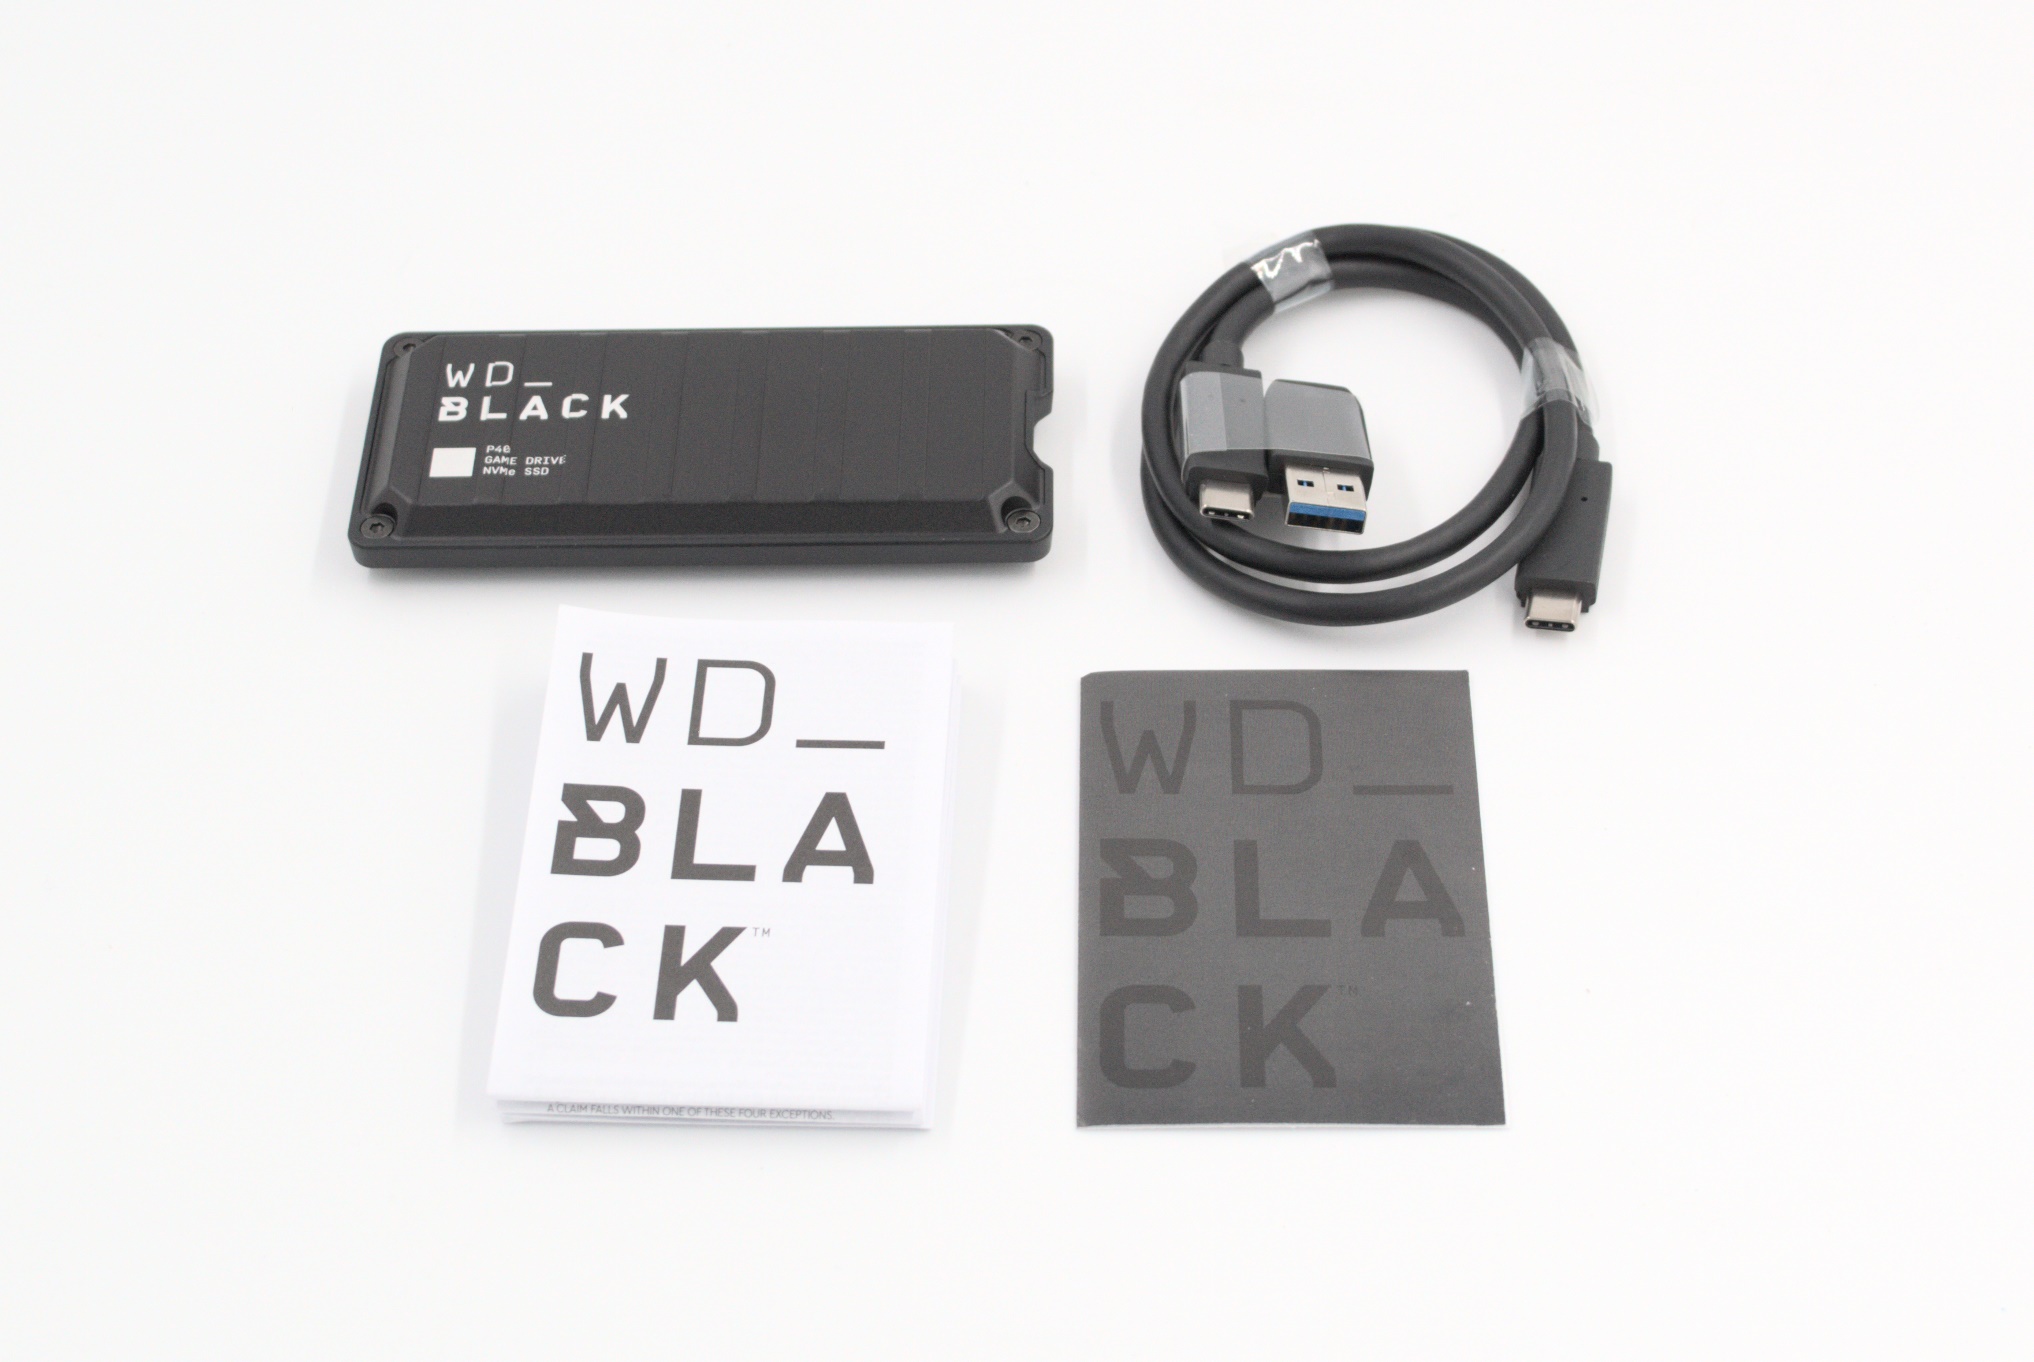
WD_BLACK P40 Game Drive SSD – Package Contents
The solid aluminum metal casing lends a rugged look to the drive, and lays to rest any potential thermal concerns during operation.
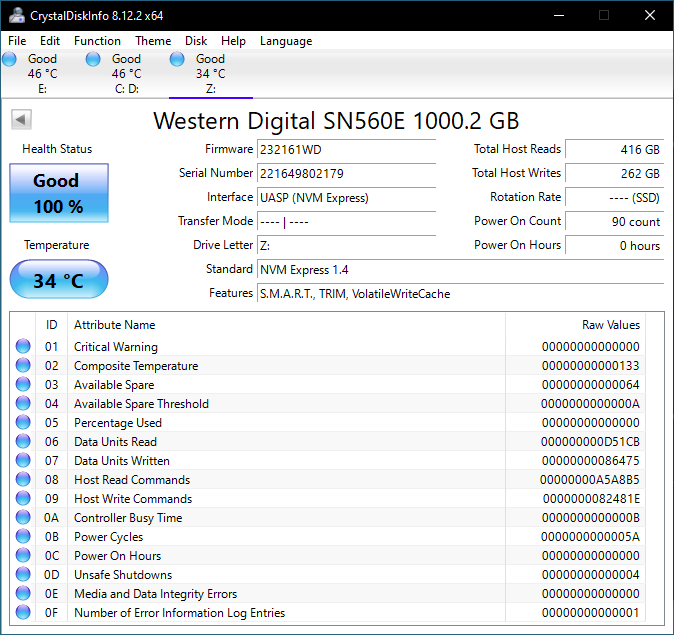
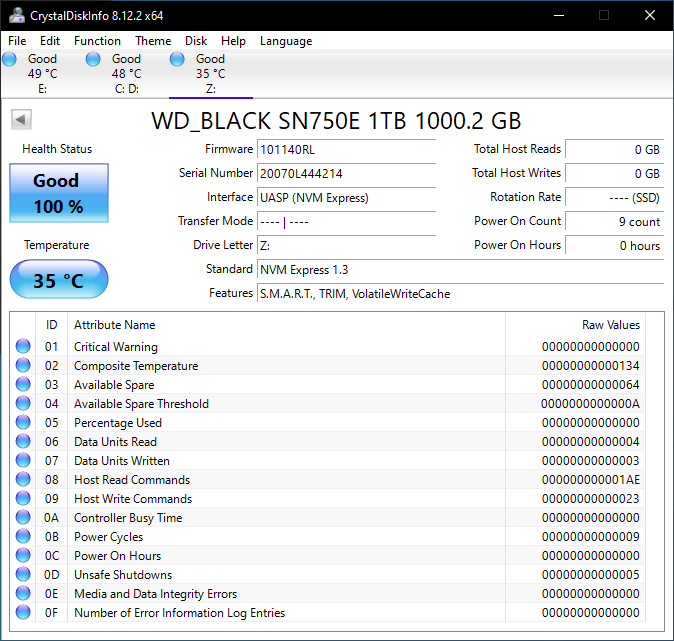
CrystalDiskInfo provides a quick overview of the PSSD as seen by the host system. The P40 support S.M.A.R.T passthrough and TRIM, as shown in the screenshot below. Compared to the DRAM-equipped SN750E used in the P50, WD is using a DRAM-less SN560E in the P40. The cost-savings translate to the lower price on the P40 compared to the P50.
| S.M.A.R.T Passthrough – CrystalDiskInfo | |
 |
 |
The table below presents a comparative view of the specifications of the different storage bridges presented in this review.
| Comparative Direct-Attached Storage Devices Configuration | ||
| Aspect | ||
| Downstream Port | 1x PCIe 3.0 x4 (M.2 NVMe) | 1x PCIe 3.0 x4 (M.2 NVMe) |
| Upstream Port | USB 3.2 Gen 2×2 Type-C | USB 3.2 Gen 2×2 Type-C |
| Bridge Chip | ASMedia ASM2364 | ASMedia ASM2364 |
| Power | Bus Powered | Bus Powered |
| Use Case | Mid-range 2GBps-class, compact, and sturdy portable SSD in a gumstick form-factor targeting the gaming market | Premium 2GBps-class, compact, and sturdy portable SSD in a gumstick form-factor targeting the gaming market |
| Physical Dimensions | 107 mm x 51 mm x 13 mm | 118 mm x 62 mm x 14 mm |
| Weight | 79 grams (without cable) | 115 grams (without cable) |
| Cable | 30 cm USB 3.2 Gen 2×2 Type-C to Type-C Attached Type-C female to Type-A male adapter (resultant Type-C to Type-A cable length : 33 cm) |
30 cm USB 3.2 Gen 2×2 Type-C to Type-C 30 cm USB 3.2 Gen 2 Type-C to Type-A |
| S.M.A.R.T Passthrough | Yes | Yes |
| UASP Support | Yes | Yes |
| TRIM Passthrough | Yes | Yes |
| Hardware Encryption | Not Available | Not Available |
| Evaluated Storage | Western Digital SN560E PCIe 3.0 x4 M.2 2280 NVMe SSD SanDisk / Toshiba BiCS 5 112L 3D TLC |
Western Digital SN750E PCIe 3.0 x4 M.2 2280 NVMe SSD SanDisk / Toshiba BiCS 4 96L 3D TLC |
| Price | USD 130 | USD 210 |
| Review Link | WD_BLACK P40 Game Drive SSD 1TB Review | WD_BLACK P50 Game Drive SSD 1TB Review #1 (2020) WD_BLACK P50 Game Drive SSD 1TB Review #2 (2021) |
Prior to looking at the benchmark numbers, power consumption, and thermal solution effectiveness, a description of the testbed setup and evaluation methodology is provided.
Testbed Setup and Evaluation Methodology
Direct-attached storage devices are evaluated using the Quartz Canyon NUC (essentially, the Xeon / ECC version of the Ghost Canyon NUC) configured with 2x 16GB DDR4-2667 ECC SODIMMs and a PCIe 3.0 x4 NVMe SSD – the IM2P33E8 1TB from ADATA.
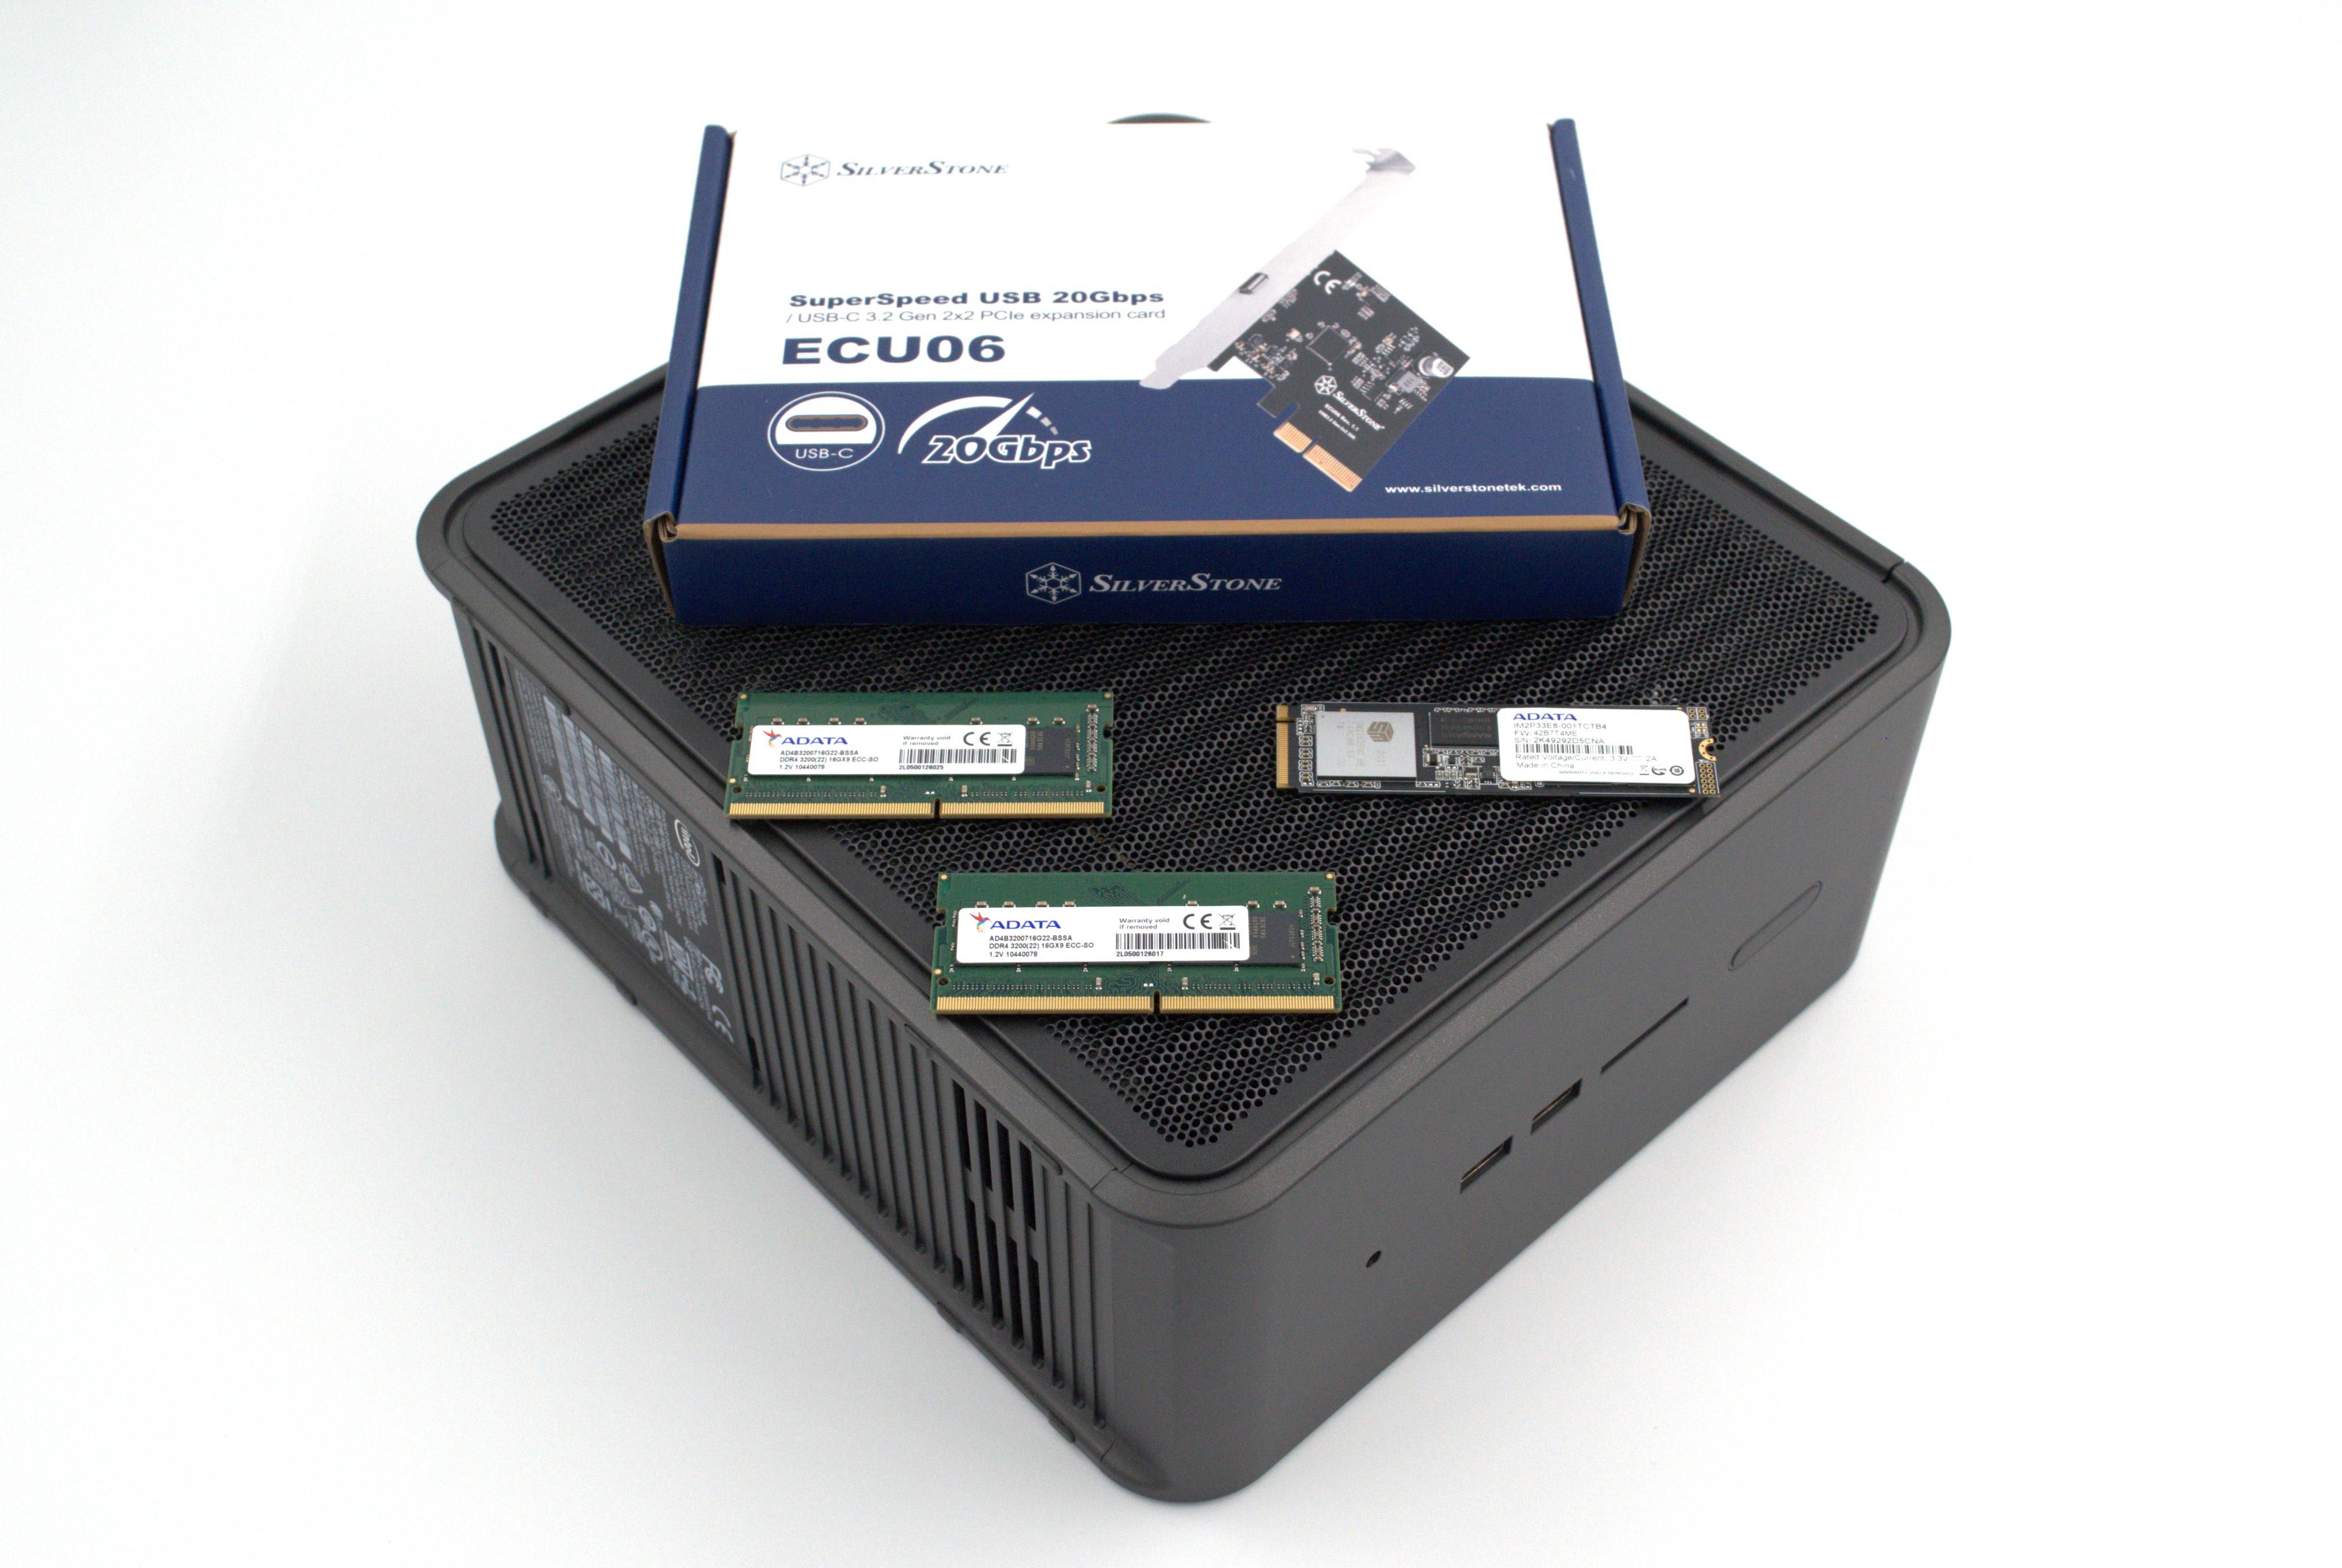
The most attractive aspect of the Quartz Canyon NUC is the presence of two PCIe slots (electrically, x16 and x4) for add-in cards. In the absence of a discrete GPU – for which there is no need in a DAS testbed – both slots are available. In fact, we also added a spare SanDisk Extreme PRO M.2 NVMe SSD to the CPU direct-attached M.2 22110 slot in the baseboard in order to avoid DMI bottlenecks when evaluating Thunderbolt 3 devices. This still allows for two add-in cards operating at x8 (x16 electrical) and x4 (x4 electrical). Since the Quartz Canyon NUC doesn’t have a native USB 3.2 Gen 2×2 port, Silverstone’s SST-ECU06 add-in card was installed in the x4 slot. All non-Thunderbolt devices are tested using the Type-C port enabled by the SST-ECU06.
The specifications of the testbed are summarized in the table below:
| The 2021 AnandTech DAS Testbed Configuration | |
| System | Intel Quartz Canyon NUC9vXQNX |
| CPU | Intel Xeon E-2286M |
| Memory | ADATA Industrial AD4B3200716G22 32 GB (2x 16GB) DDR4-3200 ECC @ 22-22-22-52 |
| OS Drive | ADATA Industrial IM2P33E8 NVMe 1TB |
| Secondary Drive | SanDisk Extreme PRO M.2 NVMe 3D SSD 1TB |
| Add-on Card | SilverStone Tek SST-ECU06 USB 3.2 Gen 2×2 Type-C Host |
| OS | Windows 10 Enterprise x64 (21H1) |
| Thanks to ADATA, Intel, and SilverStone Tek for the build components | |
The testbed hardware is only one segment of the evaluation. Over the last few years, the typical direct-attached storage workloads for memory cards have also evolved. High bit-rate 4K videos at 60fps have become quite common, and 8K videos are starting to make an appearance. Game install sizes have also grown steadily even in portable game consoles, thanks to high resolution textures and artwork. Keeping these in mind, our evaluation scheme for direct-attached storage devices involves multiple workloads which are described in detail in the corresponding sections.
- Synthetic workloads using CrystalDiskMark and ATTO
- Real-world access traces using PCMark 10’s storage benchmark
- Custom robocopy workloads reflective of typical DAS usage
- Sequential write stress test
In the next section, we have an overview of the performance of the WD_BLACK P40 Game Drive SSD in these benchmarks. Prior to providing concluding remarks, we have some observations on the device’s power consumption numbers and thermal solution also.
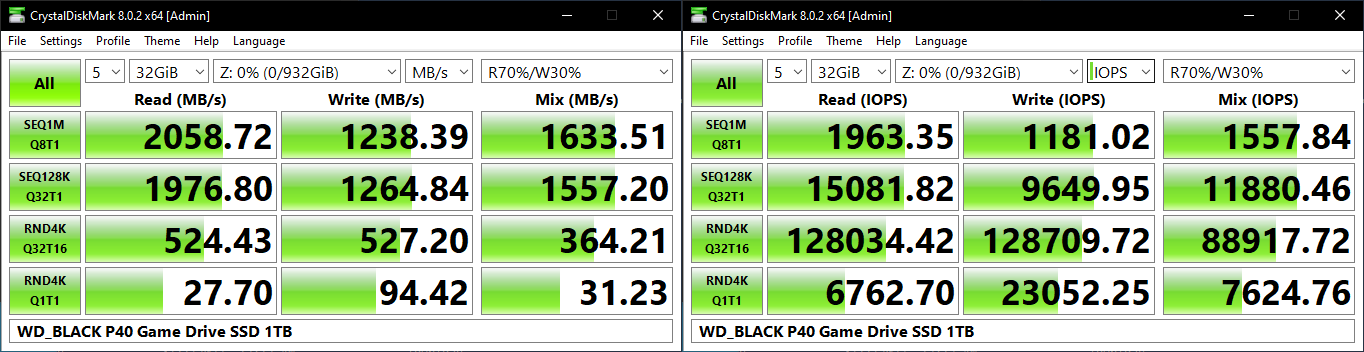
Benchmarks such as ATTO and CrystalDiskMark help provide a quick look at the performance of the direct-attached storage device. The results translate to the instantaneous performance numbers that consumers can expect for specific workloads, but do not account for changes in behavior when the unit is subject to long-term conditioning and/or thermal throttling. Yet another use of these synthetic benchmarks is the ability to gather information regarding support for specific storage device features that affect performance.
Western Digital claims read and write speeds of 2000 MBps, but these are not backed up by any of our usual synthetic benchmarks. As we shall see further down in this review, the P40 can sustain the advertised numbers only over a very small data size. One can run ATTO with a 256MB file size and CrystalDiskMark with a 1GB span and back up WD’s numbers, but those are not the sizes we use for evaluation.
ATTO benchmarking is restricted to a single configuration in terms of queue depth, and is only representative of a small sub-set of real-world workloads. It does allow the visualization of change in transfer rates as the I/O size changes. For a 32GB file size, optimal write performance is reached for an I/O size of 128KB. Reads are ot affected much, reaching very close to advertised numbers at 512KB and sustaining it beyond that for a queue depth of 4. It is a matter of concern that none of the other 20 Gbps-class PSSDs have a problem with the ATTO file size used in our evaluation.
| ATTO Benchmarks | |
| TOP: | BOTTOM: |
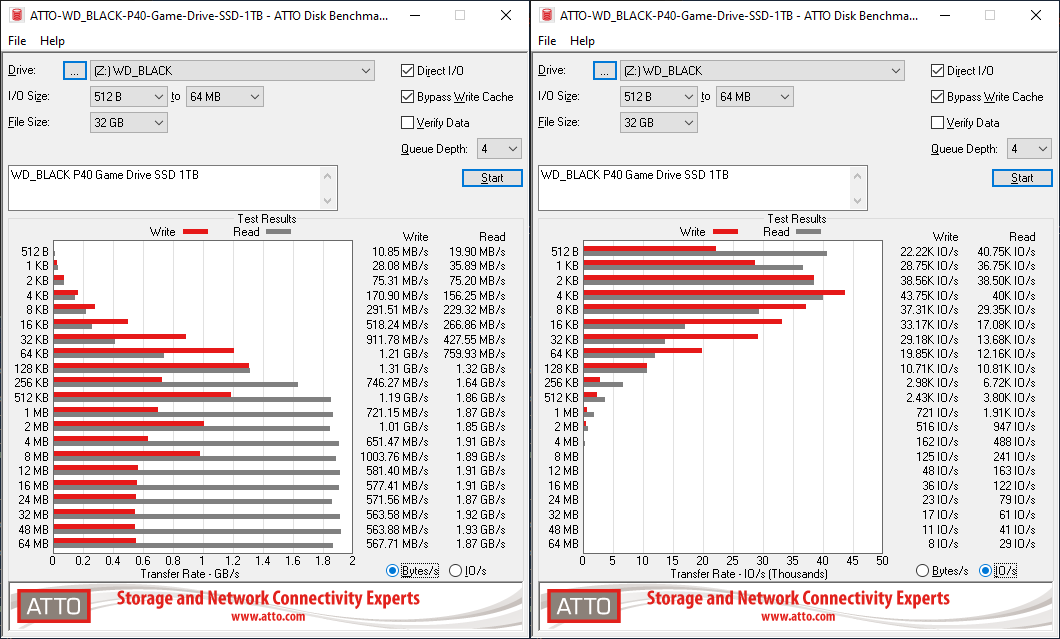 |
|
 |
|
CrystalDiskMark uses four different access traces for reads and writes over a configurable region size. Two of the traces are sequential accesses, while two are 4K random accesses. Internally, CrystalDiskMark uses the Microsoft DiskSpd storage testing tool. The ‘Seq128K Q32T1’ sequential traces use 128K block size with a queue depth of 32 from a single thread, while the ‘4K Q32T16’ one does random 4K accesses with the same queue configuration, but from multiple threads. The ‘Seq1M’ traces use a 1MiB block size. The plain ‘Rnd4K’ one uses only a single queue and single thread . Comparing the ‘4K Q32T16’ and ‘4K Q1T1’ numbers can quickly tell us whether the storage device supports NCQ (native command queuing) / UASP (USB-attached SCSI protocol). If the numbers for the two access traces are in the same ballpark, NCQ / UASP is not supported. This assumes that the host port / drivers on the PC support UASP.
| CrystalDiskMark Benchmarks | |
| TOP: | BOTTOM: |
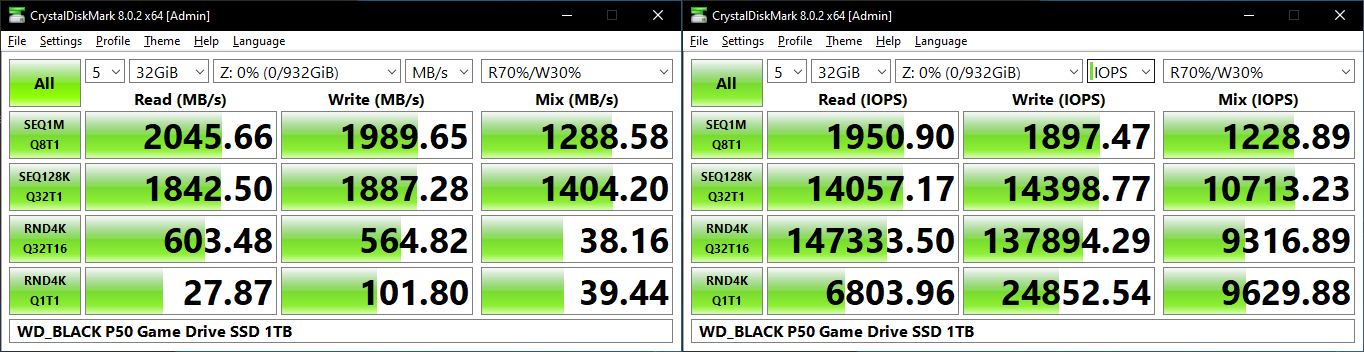 |
|
The P40 can only average around 1250 MBps writes over a 32GB span. Every other PSSD in its class can sustain 1800 MBps+ for similar sequential accesses. The reads and high-queue depth random accesses are a bit of a saving grace for the P40 when compared to other PSSDs. Low queue-depth performance suffers due to the lack of on-board DRAM.
Our testing methodology for storage bridges / direct-attached storage units takes into consideration the usual use-case for such devices. The most common usage scenario is transfer of large amounts of photos and videos to and from the unit. Other usage scenarios include the use of the unit as a download or install location for games and importing files directly from it into a multimedia editing program such as Adobe Photoshop. Some users may even opt to boot an OS off an external storage device.
The AnandTech DAS Suite tackles the first use-case. The evaluation involves processing five different workloads:
- AV: Multimedia content with audio and video files totalling 24.03 GB over 1263 files in 109 sub-folders
- Home: Photos and document files totalling 18.86 GB over 7627 files in 382 sub-folders
- BR: Blu-ray folder structure totalling 23.09 GB over 111 files in 10 sub-folders
- ISOs: OS installation files (ISOs) totalling 28.61 GB over 4 files in one folder
- Disk-to-Disk: Addition of 223.32 GB spread over 171 files in 29 sub-folders to the above four workloads (total of 317.91 GB over 9176 files in 535 sub-folders)
Except for the ‘Disk-to-Disk’ workload, each data set is first placed in a 29GB RAM drive, and a robocopy command is issue to transfer it to the external storage unit (formatted in exFAT for flash-based units, and NTFS for HDD-based units).
robocopy /NP /MIR /NFL /J /NDL /MT:32 $SRC_PATH $DEST_PATH
Upon completion of the transfer (write test), the contents from the unit are read back into the RAM drive (read test) after a 10 second idling interval. This process is repeated three times for each workload. Read and write speeds, as well as the time taken to complete each pass are recorded. Whenever possible, the temperature of the external storage device is recorded during the idling intervals. Bandwidth for each data set is computed as the average of all three passes.
The ‘Disk-to-Disk’ workload involves a similar process, but with one iteration only. The data is copied to the external unit from the CPU-attached NVMe drive, and then copied back to the internal drive. It does include more amount of continuous data transfer in a single direction, as data that doesn’t fit in the RAM drive is also part of the workload set.
The P40 is in the top three in all of the read workloads. The writes are a different case altogether – the performance is sometimes even worse than 1GBps-class PSSDs such as the Samsung T7 Touch. The write penalty is particularly high for small-sized files. Power users may want to dig deeper to understand the limits of each device. To address this concern, we also instrumented our evaluation scheme for determining performance consistency.
Performance Consistency
Aspects influencing the performance consistency include SLC caching and thermal throttling / firmware caps on access rates to avoid overheating. This is important for power users, as the last thing that they want to see when copying over 100s of GB of data is the transfer rate going down to USB 2.0 speeds.
In addition to tracking the instantaneous read and write speeds of the DAS when processing the AnandTech DAS Suite, the temperature of the drive was also recorded. In earlier reviews, we used to track the temperature all through. However, we have observed that SMART read-outs for the temperature in NVMe SSDs using USB 3.2 Gen 2 bridge chips end up negatively affecting the actual transfer rates. To avoid this problem, we have restricted ourselves to recording the temperature only during the idling intervals. The graphs below present the recorded data.
| AnandTech DAS Suite – Performance Consistency | |
| TOP: | BOTTOM: |
 |
|
 |
|
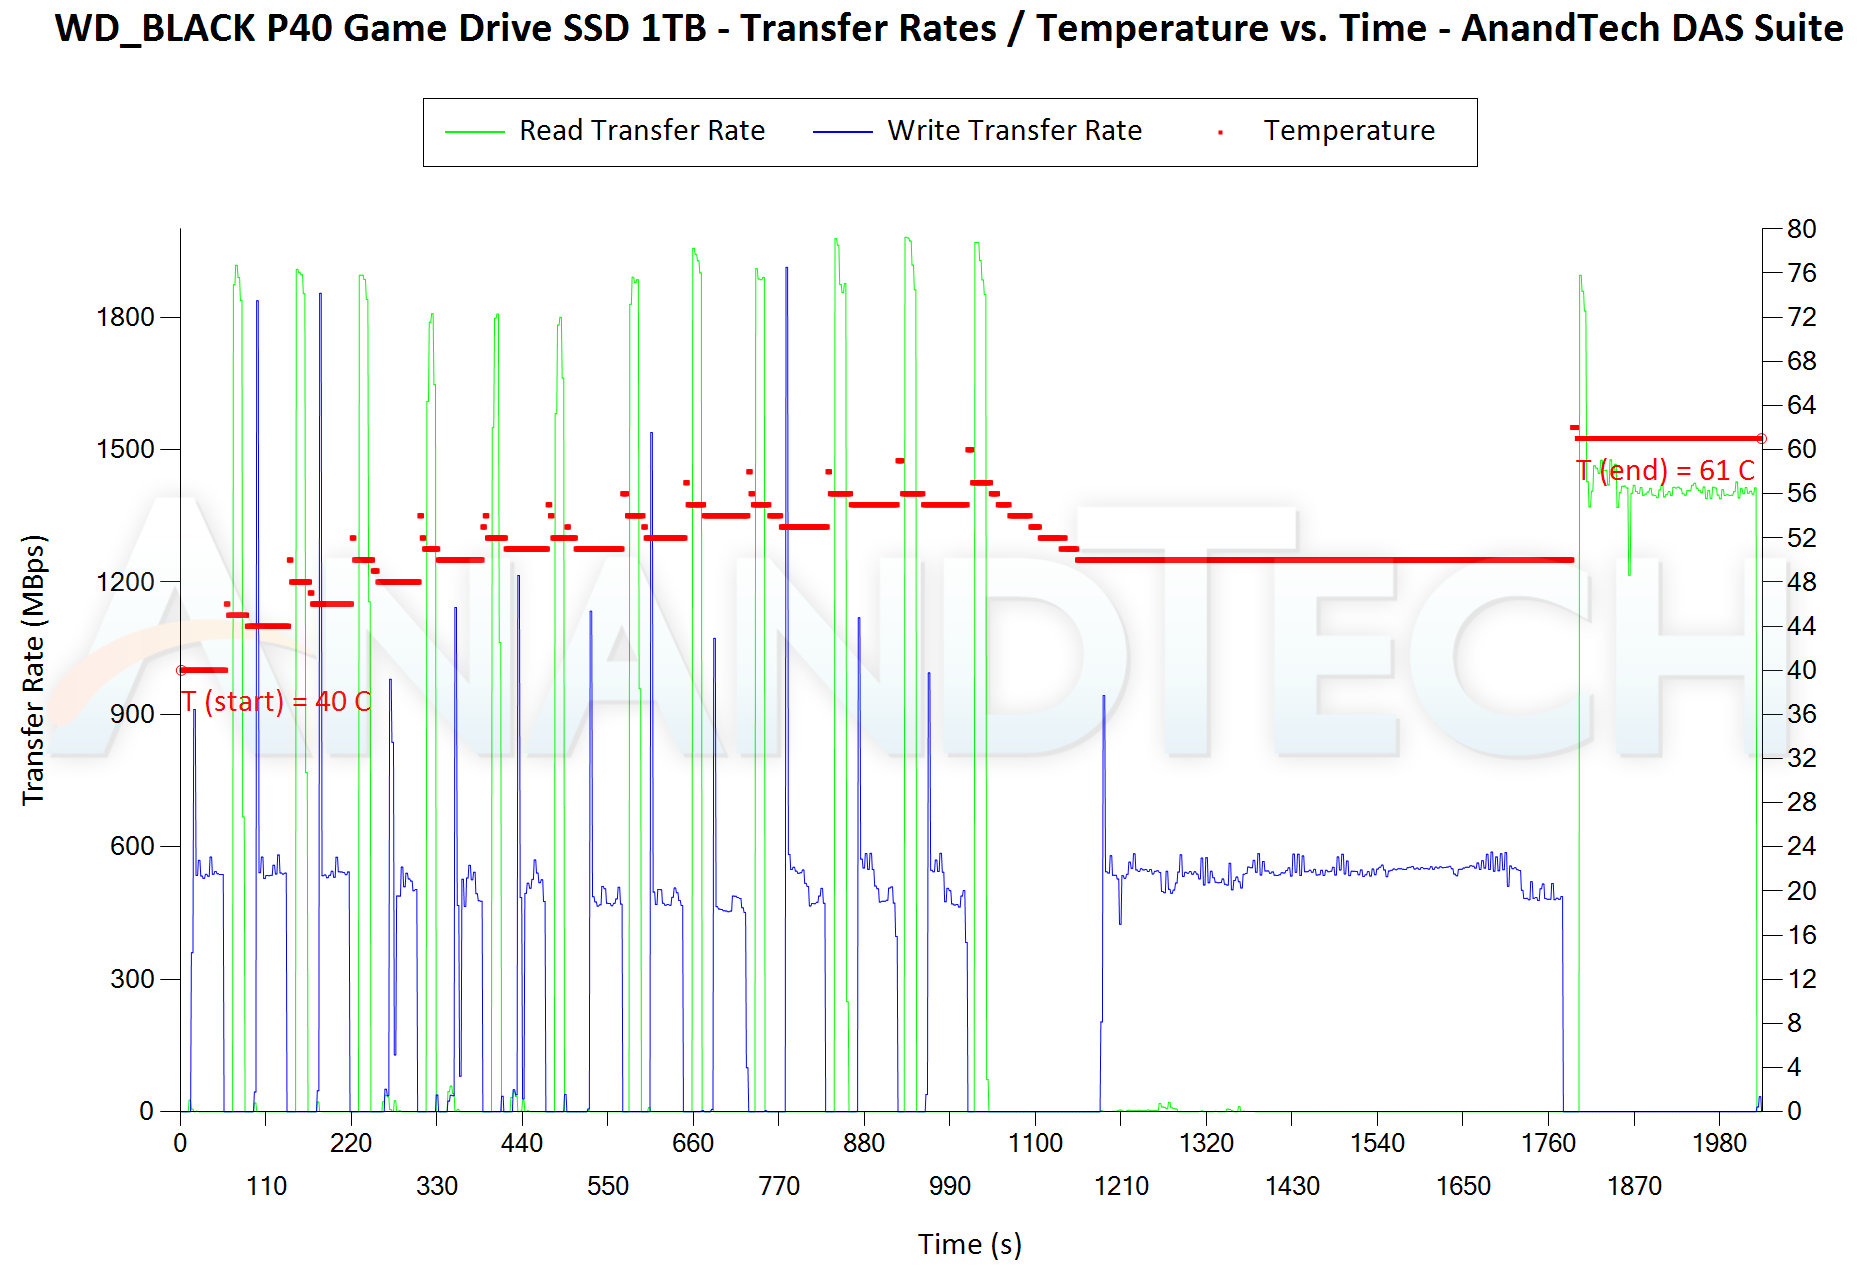
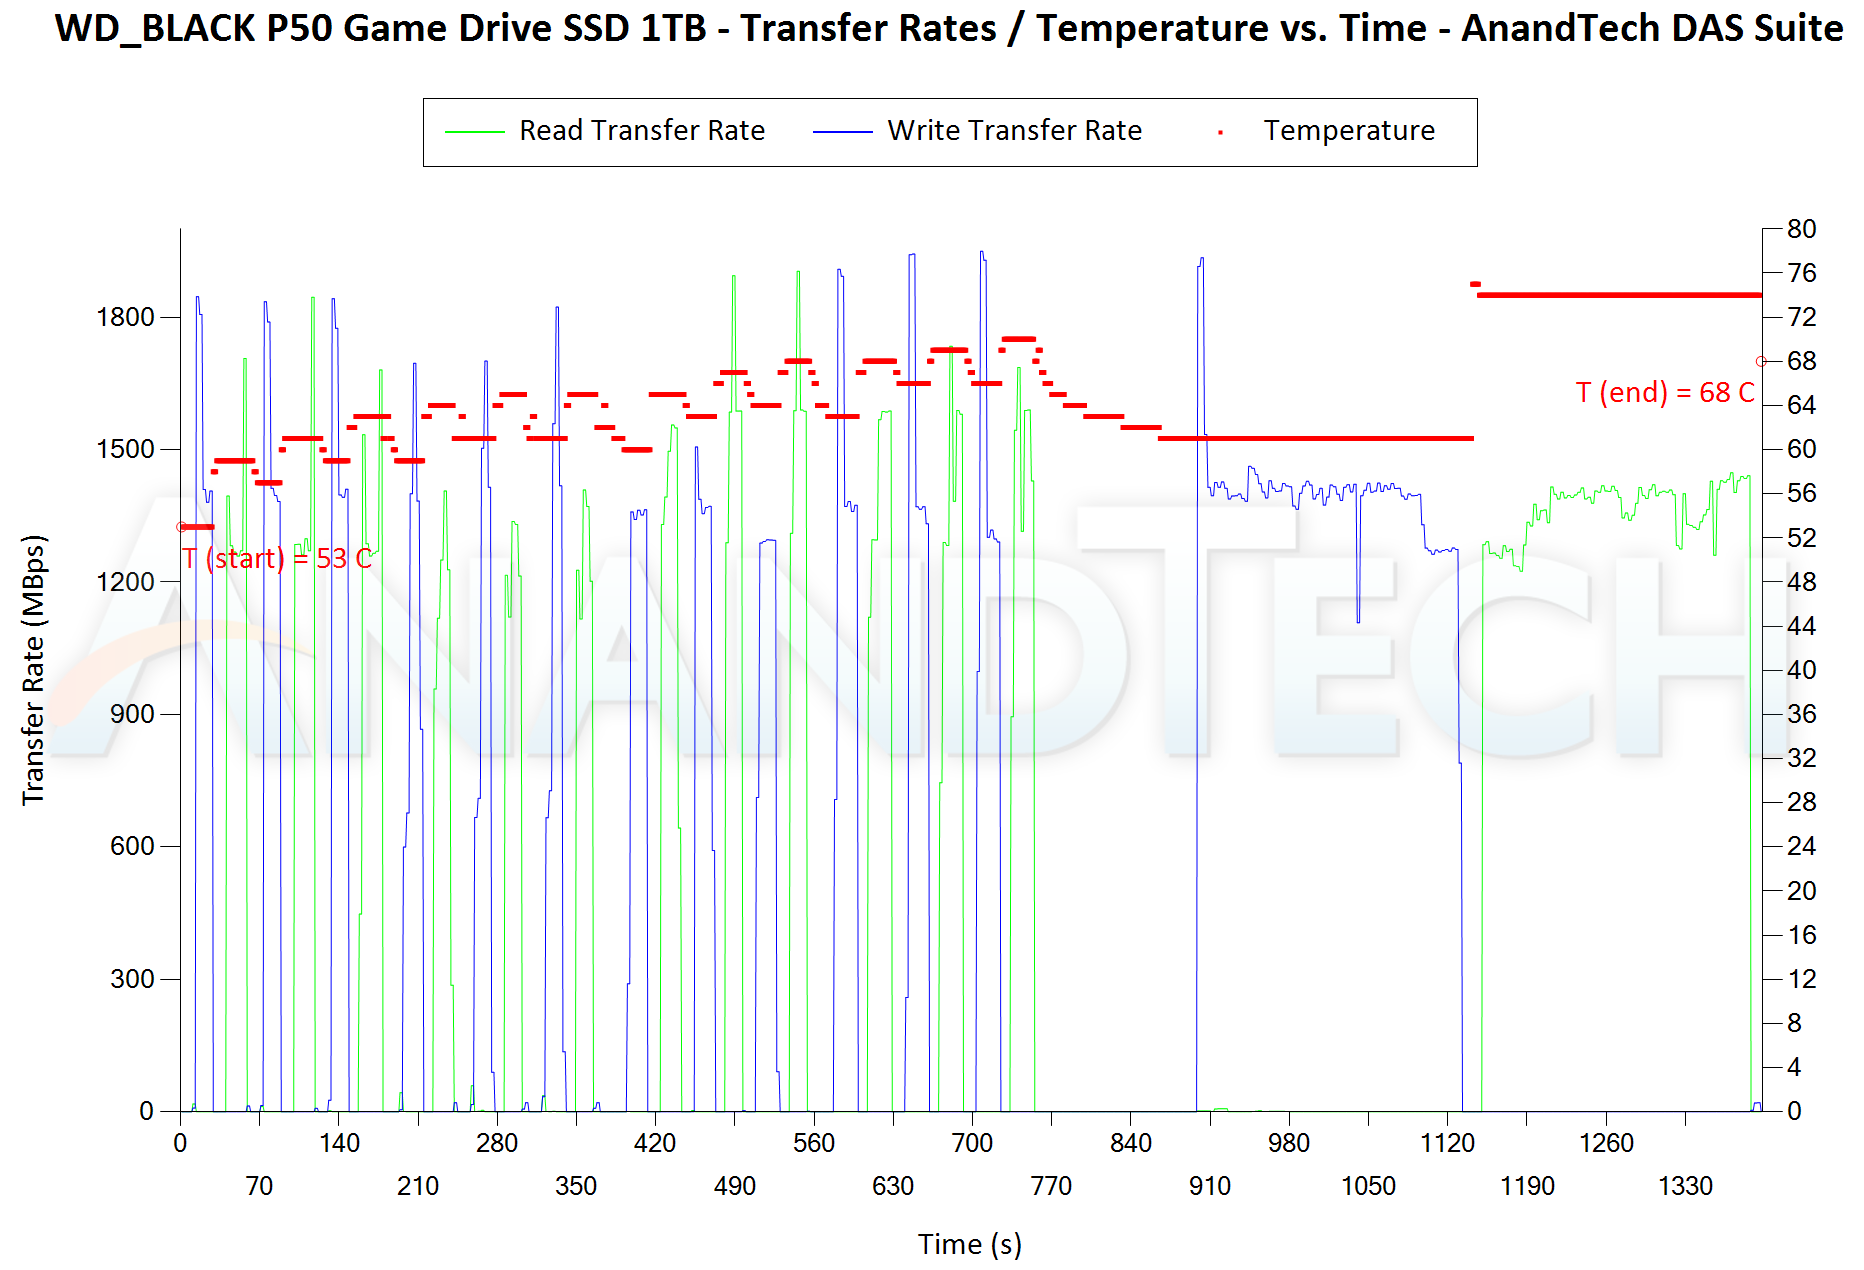
The first three sets of writes and reads correspond to the AV suite. A small gap (for the transfer of the video suite from the internal SSD to the RAM drive) is followed by three sets for the Home suite. Another small RAM-drive transfer gap is followed by three sets for the Blu-ray folder. This is followed up with the large-sized ISO files set. Finally, we have the single disk-to-disk transfer set. It can be seen that the P40 can indeed go as high as 1800 MBps for the writes, but only for a very short duration. The good news seems to be that it appears to regain the SLC cache relatively quickly. Sustained writes are a problem for the drive, unfortunately. The above graphs show the reason for the PSSD’s abysmal showing in the graphs in the previous sub-section. On the thermal front, the temperature is lower than all other 2GBps-class PSSDs except the Seagate Firecuda (which has a completely different performance profile allowing it to cool down rapidly towards the end of the test).
There are a number of storage benchmarks that can subject a device to artificial access traces by varying the mix of reads and writes, the access block sizes, and the queue depth / number of outstanding data requests. We saw results from two popular ones – ATTO, and CrystalDiskMark – in a previous section. More serious benchmarks, however, actually replicate access traces from real-world workloads to determine the suitability of a particular device for a particular workload. Real-world access traces may be used for simulating the behavior of computing activities that are limited by storage performance. Examples include booting an operating system or loading a particular game from the disk.
PCMark 10’s storage bench (introduced in v2.1.2153) includes four storage benchmarks that use relevant real-world traces from popular applications and common tasks to fully test the performance of the latest modern drives:
- The Full System Drive Benchmark uses a wide-ranging set of real-world traces from popular applications and common tasks to fully test the performance of the fastest modern drives. It involves a total of 204 GB of write traffic.
- The Quick System Drive Benchmark is a shorter test with a smaller set of less demanding real-world traces. It subjects the device to 23 GB of writes.
- The Data Drive Benchmark is designed to test drives that are used for storing files rather than applications. These typically include NAS drives, USB sticks, memory cards, and other external storage devices. The device is subjected to 15 GB of writes.
- The Drive Performance Consistency Test is a long-running and extremely demanding test with a heavy, continuous load for expert users. In-depth reporting shows how the performance of the drive varies under different conditions. This writes more than 23 TB of data to the drive.
Despite the data drive benchmark appearing most suitable for testing direct-attached storage, we opt to run the full system drive benchmark as part of our evaluation flow. Many of us use portable flash drives as boot drives and storage for Steam games. These types of use-cases are addressed only in the full system drive benchmark.
The Full System Drive Benchmark comprises of 23 different traces. For the purpose of presenting results, we classify them under five different categories:
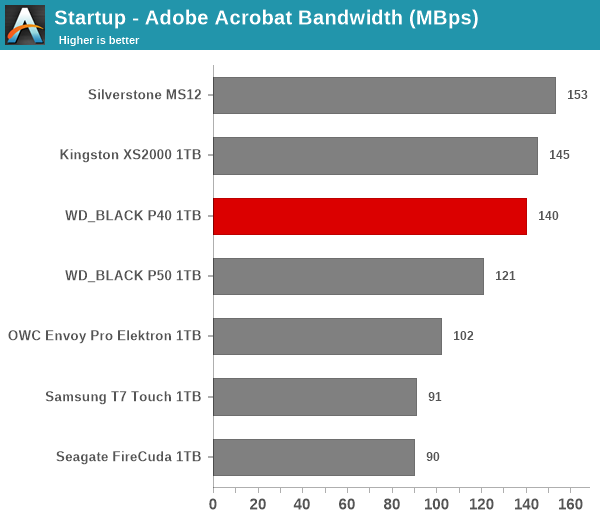
- Boot: Replay of storage access trace recorded while booting Windows 10
- Creative: Replay of storage access traces recorded during the start up and usage of Adobe applications such as Acrobat, After Effects, Illustrator, Premiere Pro, Lightroom, and Photoshop.
- Office: Replay of storage access traces recorded during the usage of Microsoft Office applications such as Excel and Powerpoint.
- Gaming: Replay of storage access traces recorded during the start up of games such as Battlefield V, Call of Duty Black Ops 4, and Overwatch.
- File Transfers: Replay of storage access traces (Write-Only, Read-Write, and Read-Only) recorded during the transfer of data such as ISOs and photographs.
PCMark 10 also generates an overall score, bandwidth, and average latency number for quick comparison of different drives. The sub-sections in the rest of the page reference the access traces specified in the PCMark 10 Technical Guide.
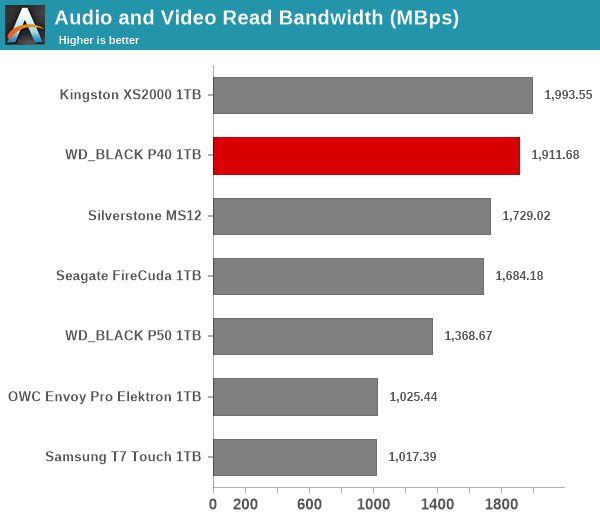
Booting Windows 10
The read-write bandwidth recorded for each drive in the boo access trace is presented below.
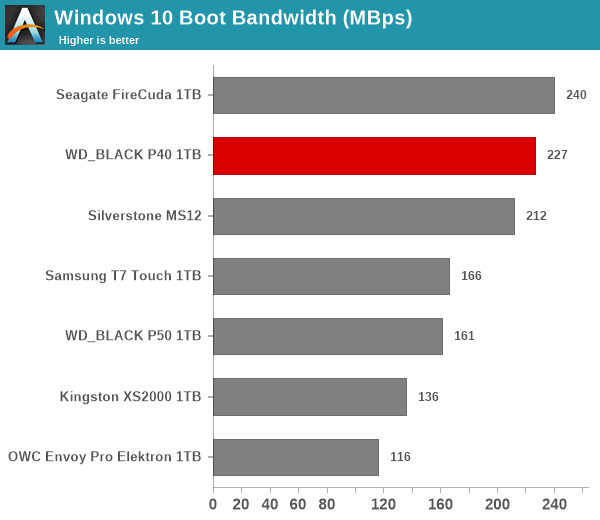
The read-heavy nature of the workload allows the P40 to shine here. As we saw in the earlier sections, reads are the strong suite for the P40.
Creative Workloads
The read-write bandwidth recorded for each drive in the sacr, saft, sill, spre, slig, sps, aft, exc, ill, ind, psh, and psl access traces are presented below.
Creative workloads are either read-heavy (startup cases) or deal with small writes. Fortunately for the WD_BLACK P40, the writes fit within the SLC cache of the drive. It also appears that the drive has enough time to recover the SLC cache, allowing the P40 to be in the top 3 performers across all the workloads in this segment.
Office Workloads
The read-write bandwidth recorded for each drive in the exc and pow access traces are presented below.
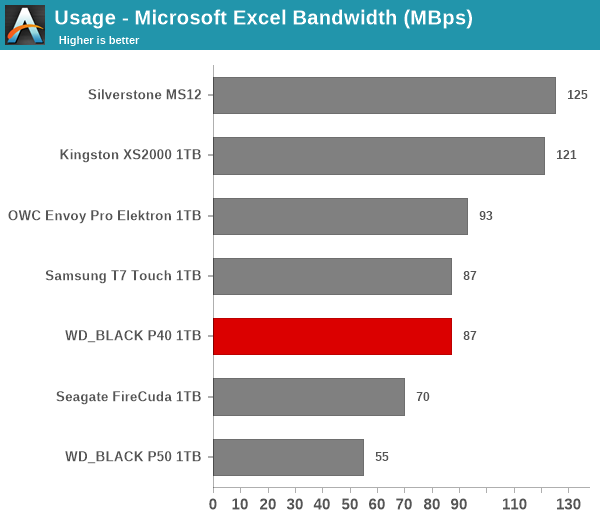
Office workloads appear to be a bit of a challenge for the firmware optimizations in the WD_BLACK series. In fact, we see the gaming-focused SSDs from both WD and Seagate not performing well in both sub-tests.
Gaming Workloads
The read-write bandwidth recorded for each drive in the bf, cod, and ow access traces are presented below.
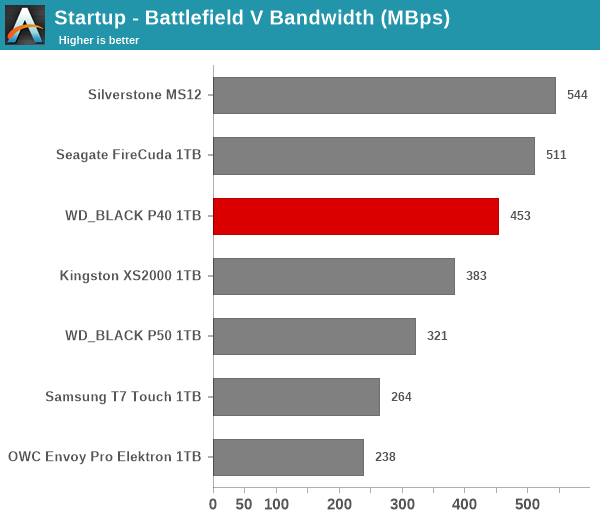
Moving on to the workloads relevant to the P40’s target market, we find the tag of a mid-range product working well for the drive. It lands right in the middle of the pack in all three game-loading scenarios.
Files Transfer Workloads
The read-write bandwidth recorded for each drive in the cp1, cp2, cp3, cps1, cps2, and cps3 access traces are presented below.
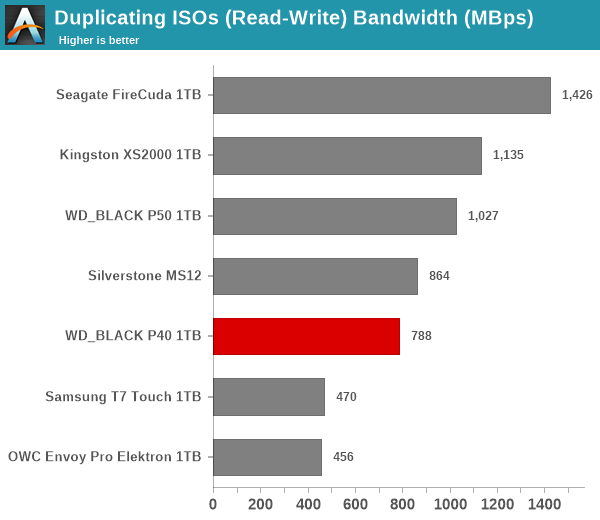
Read-only and mixed workloads see the P40 performing fairly well for a mid-range product, but the write-heavy workloads are it slip down in the rankings.
Overall Scores
PCMark 10 reports an overall score based on the observed bandwidth and access times for the full workload set. The score, bandwidth, and average access latency for each of the drives are presented below.
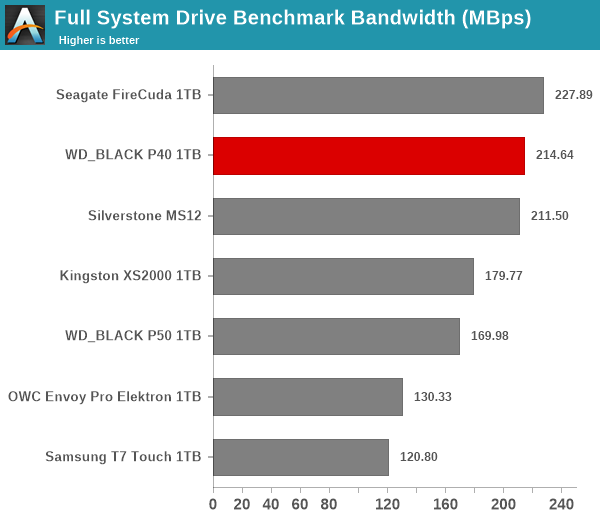
The P40 lives up to its mid-range moniker well, performing very decently across the board to land in the top three in the overall results.
The performance of the storage bridges / drives in various real-world access traces as well as synthetic workloads was brought out in the preceding sections. We also looked at the performance consistency for these cases. Power users may also be interested in performance consistency under worst-case conditions, as well as drive power consumption. The latter is also important when used with battery powered devices such as notebooks and smartphones. Pricing is also an important aspect. We analyze each of these in detail below.
Worst-Case Performance Consistency
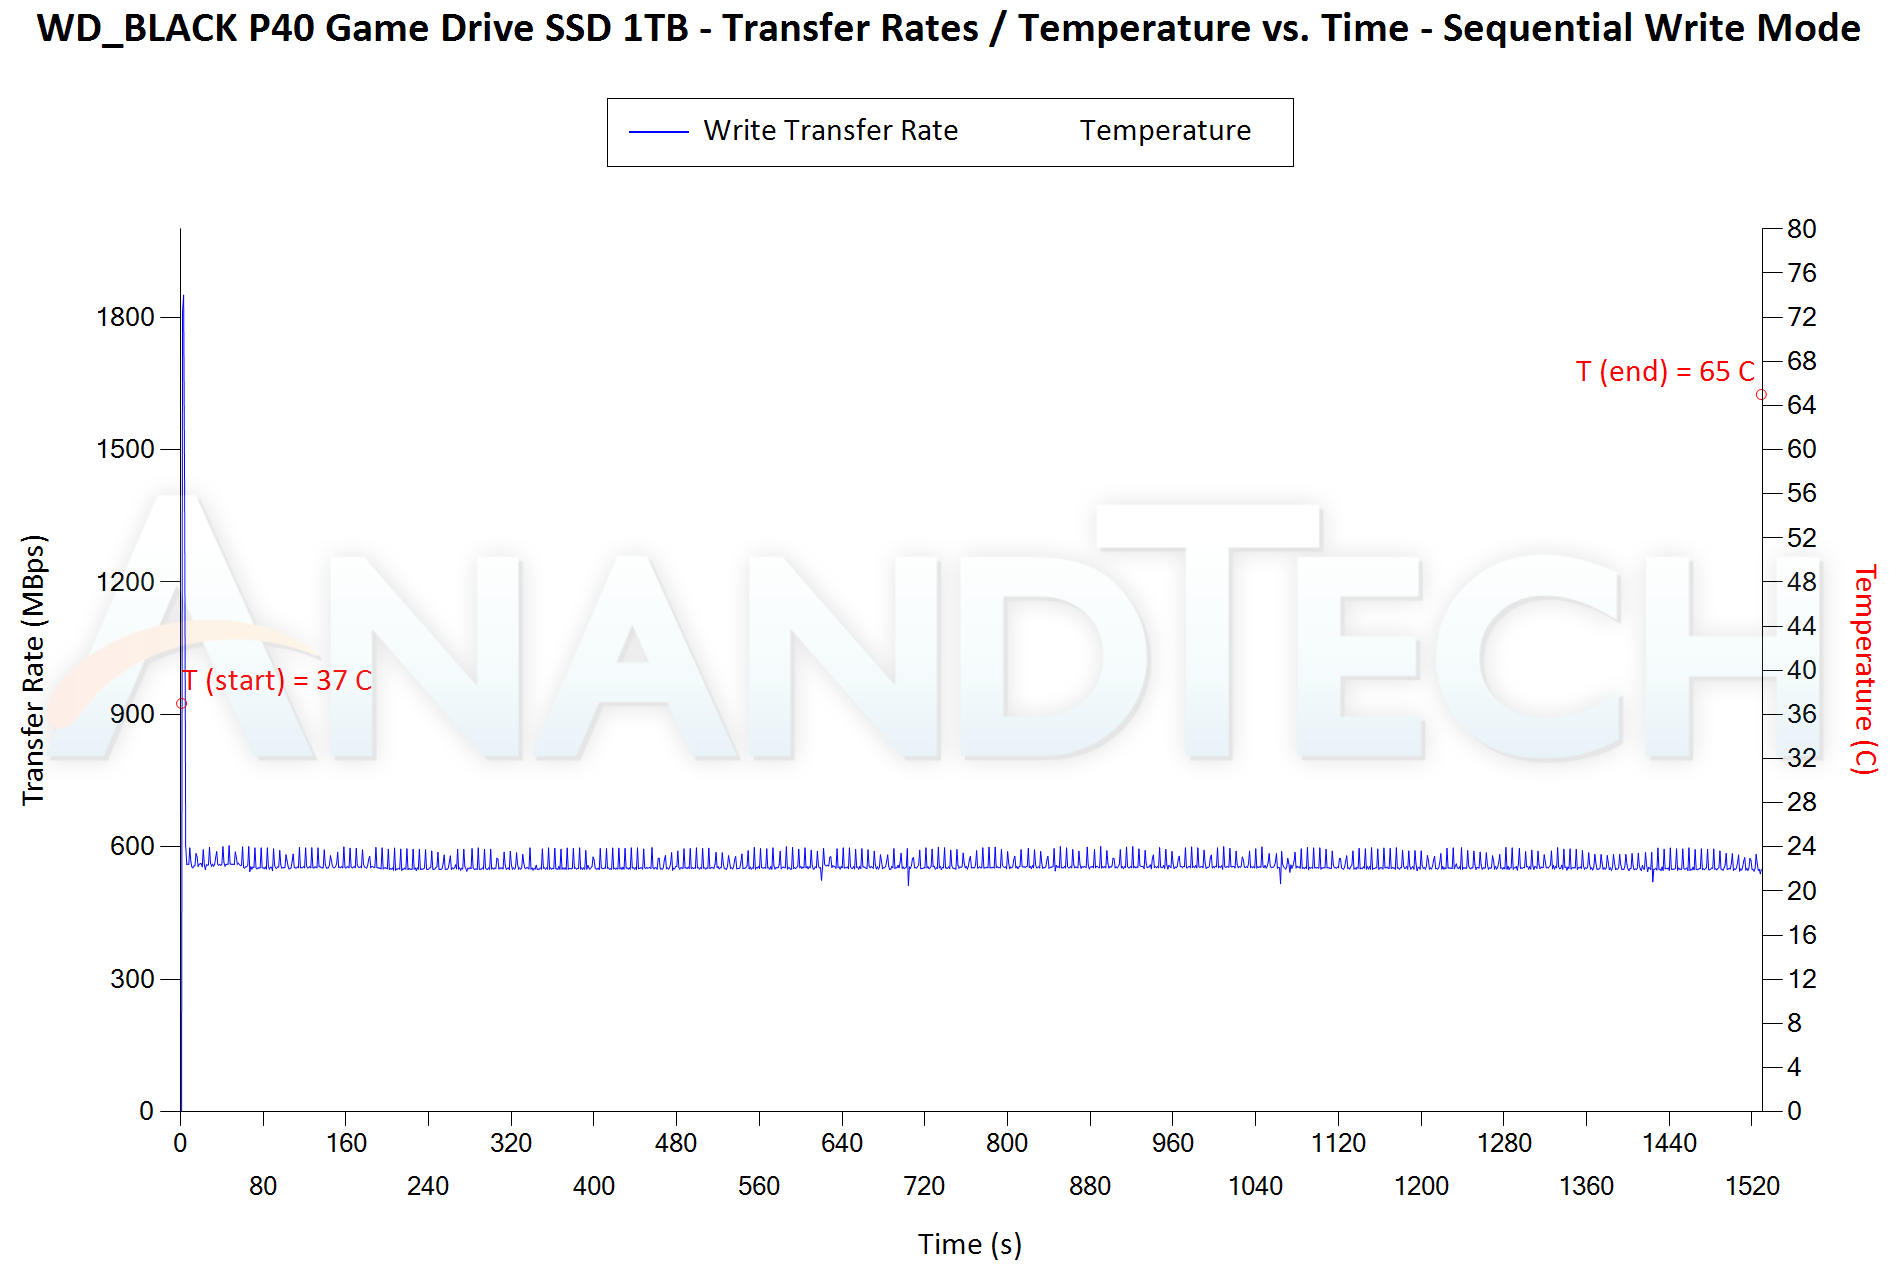
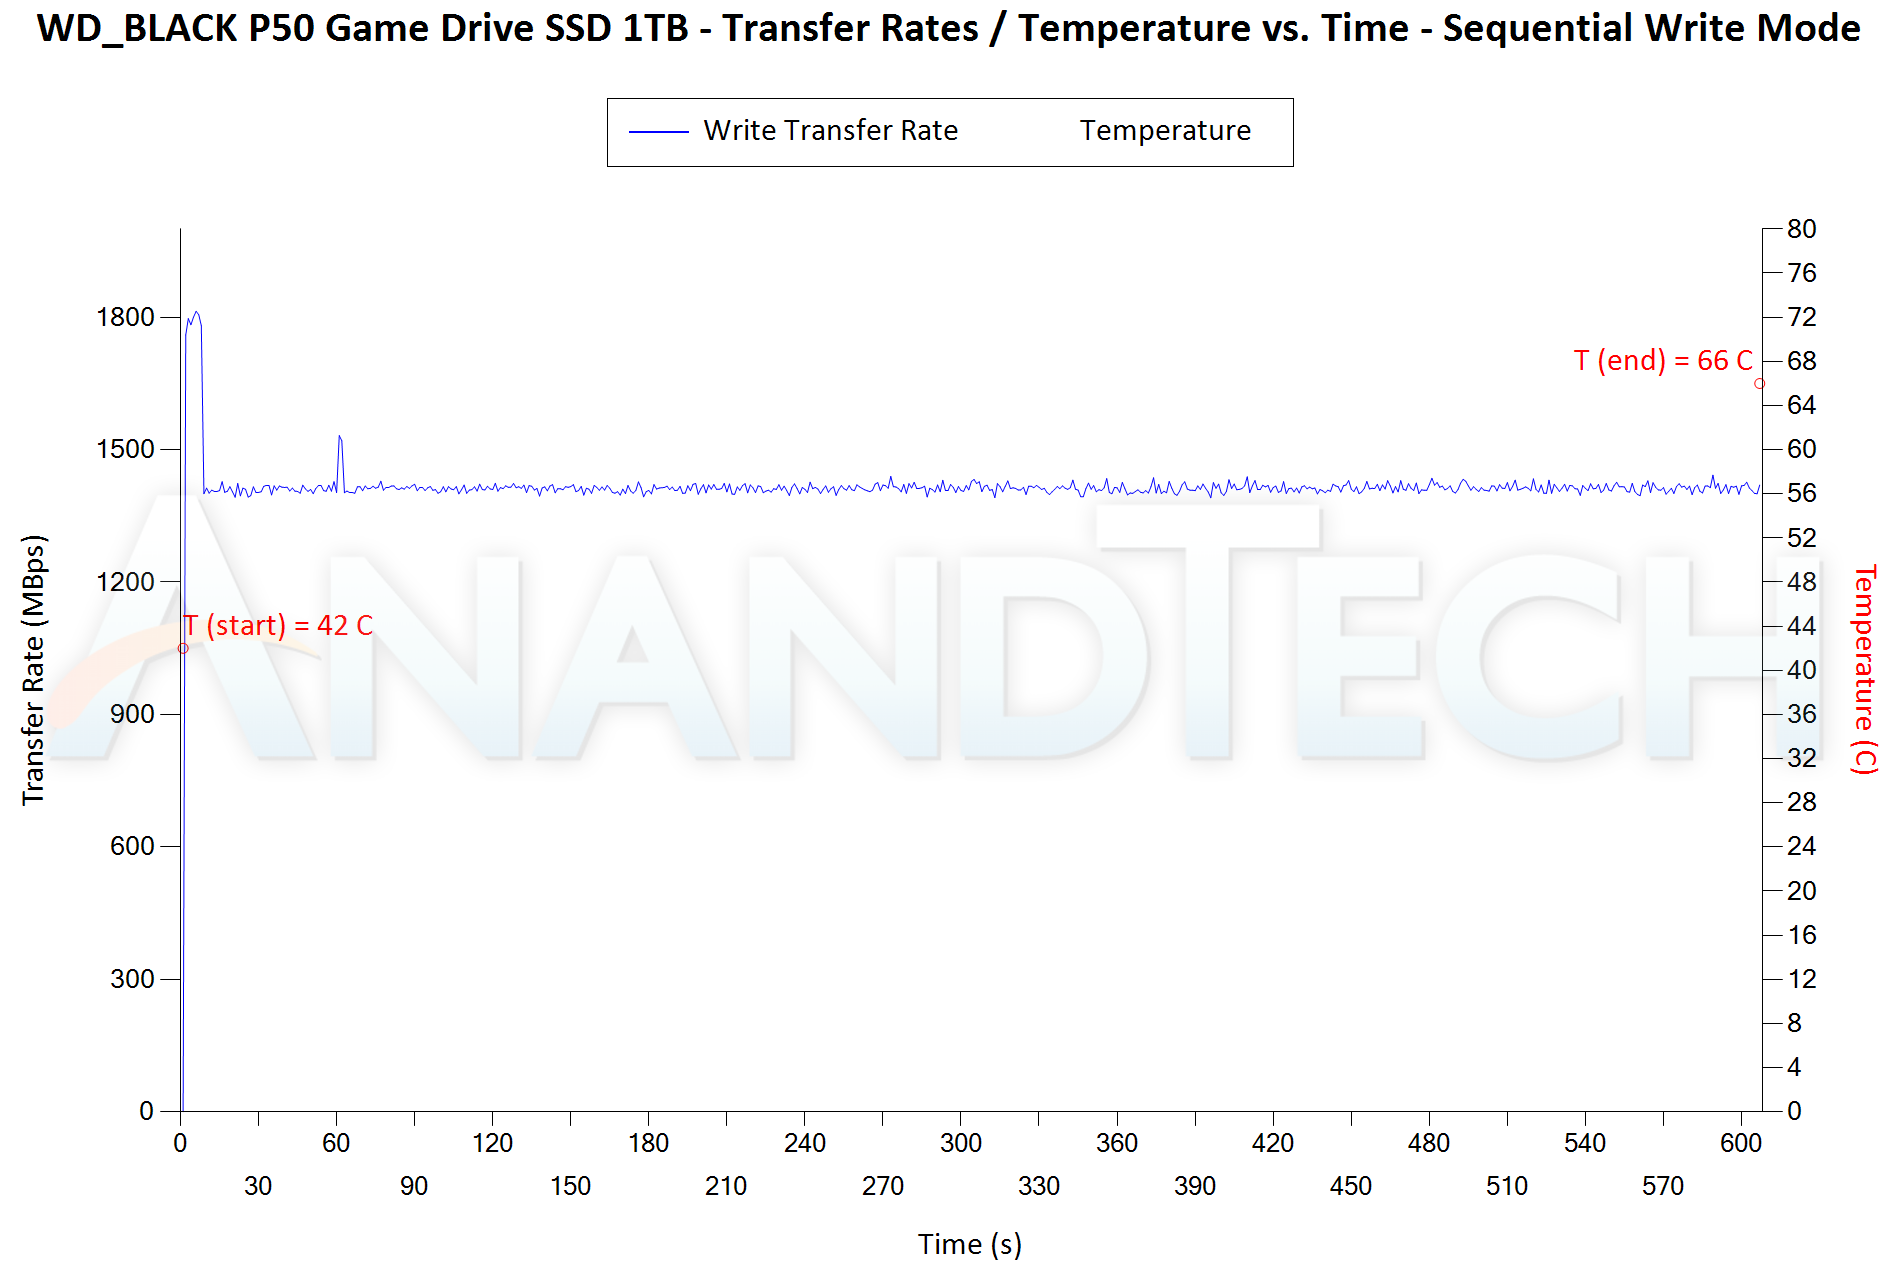
Flash-based storage devices tend to slow down in unpredictable ways when subject to a large number of small-sized random writes. Many benchmarks use that scheme to pre-condition devices prior to the actual testing in order to get a worst-case representative number. Fortunately, such workloads are uncommon for direct-attached storage devices, where workloads are largely sequential in nature. Use of SLC caching as well as firmware caps to prevent overheating may cause drop in write speeds when a flash-based DAS device is subject to sustained sequential writes.
Our Sequential Writes Performance Consistency Test configures the device as a raw physical disk (after deleting configured volumes). A fio workload is set up to write sequential data to the raw drive with a block size of 128K and iodepth of 32 to cover 90% of the drive capacity. The internal temperature is recorded at either end of the workload, while the instantaneous write data rate and cumulative total write data amount are recorded at 1-second intervals.
| Sequential Writes to 90% Capacity – Performance Consistency | |
| TOP: | BOTTOM: |
 |
|
 |
|
The WD_BLACK P40 can sustain its advertised numbers for around 3 seconds before running out of SLC cache (this is with an empty drive). This translates to around 5.5 GB of SLC cache. Any data span beyond this results in a performance drop (down to the 600 MBps range). Only the Kingston XS2000 has a worse performance profile in this test, but that has the excuse of sporting a native UFD controller.
Power Consumption
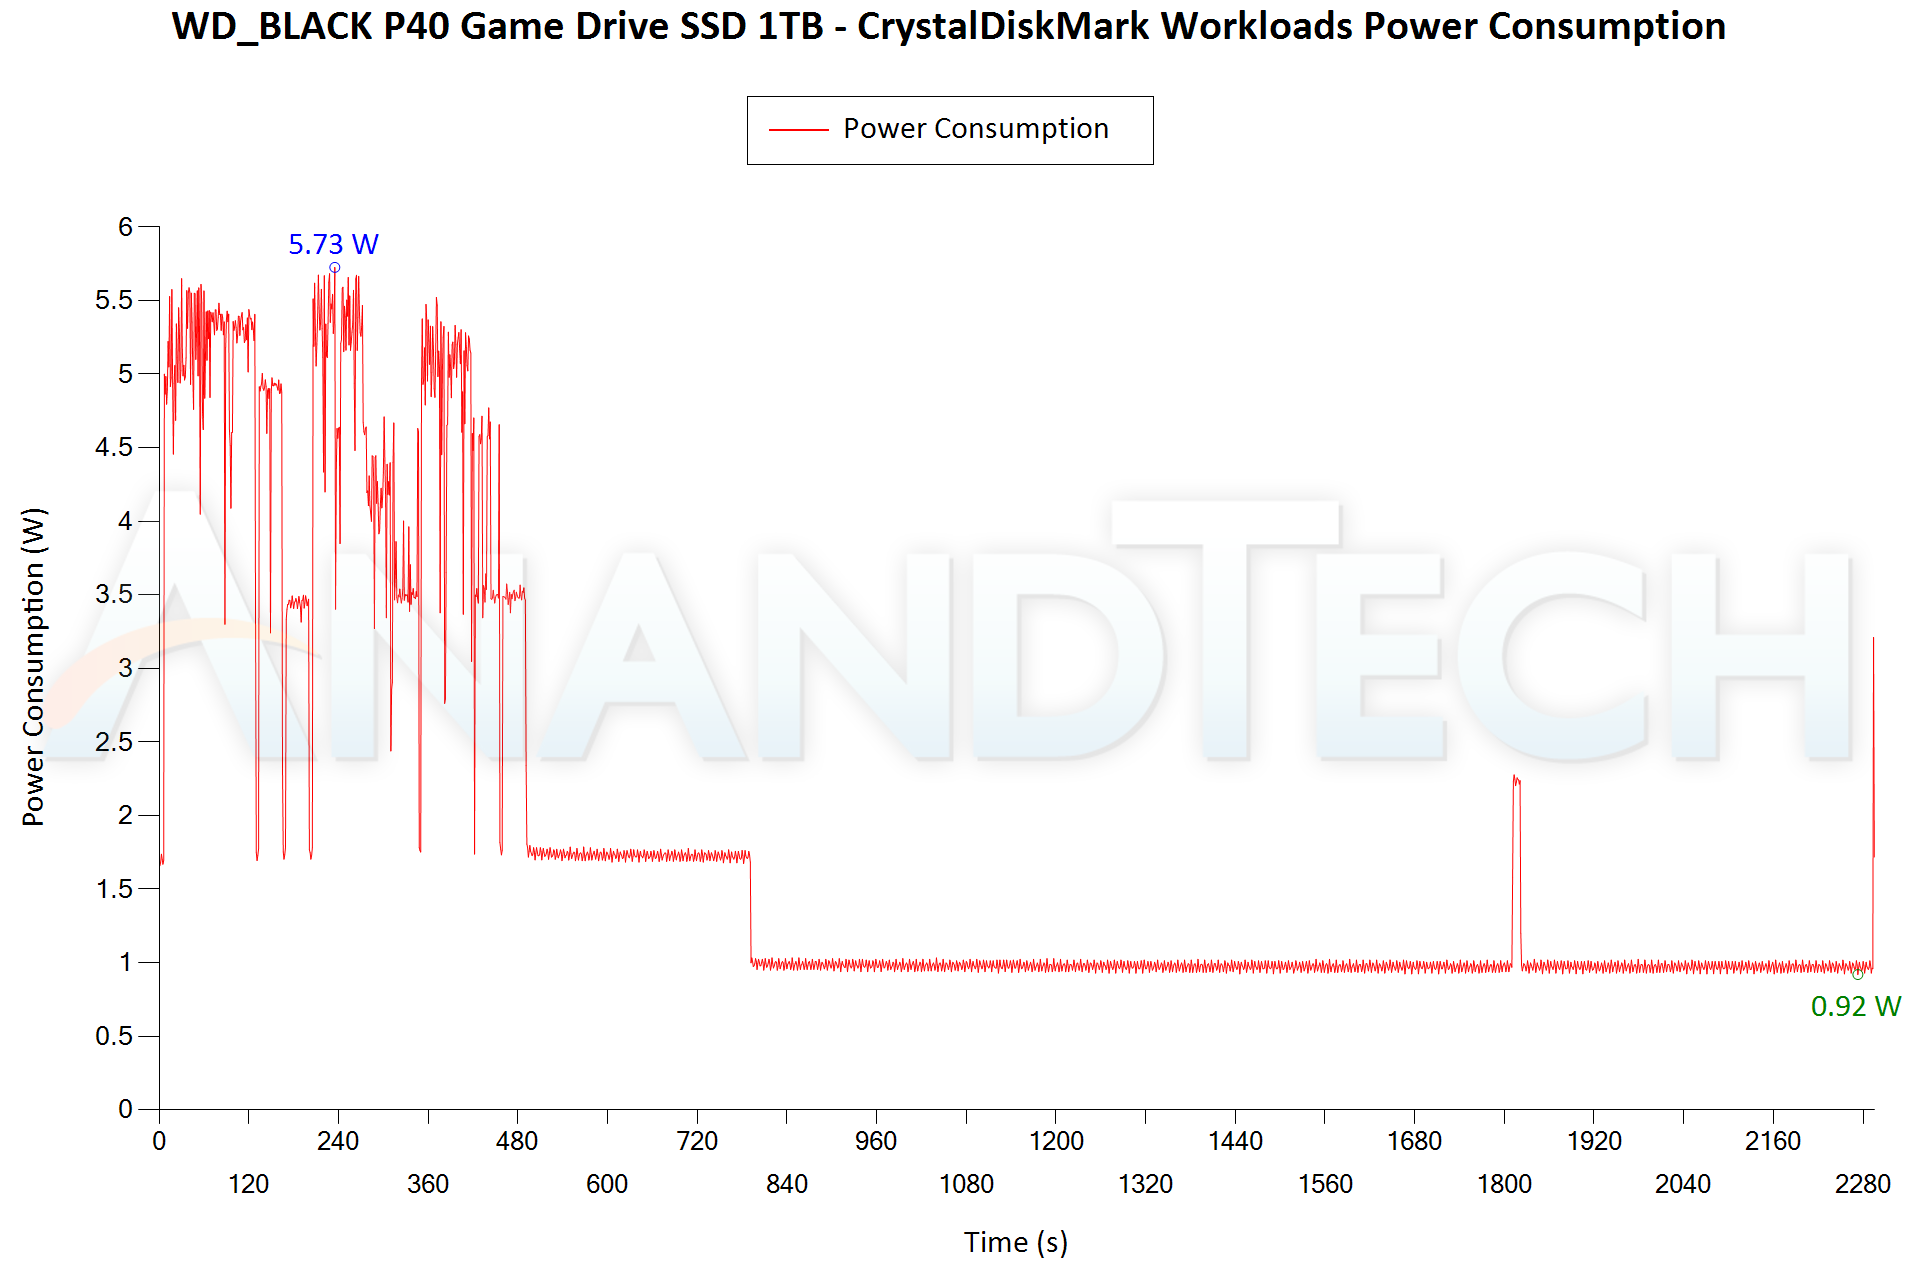
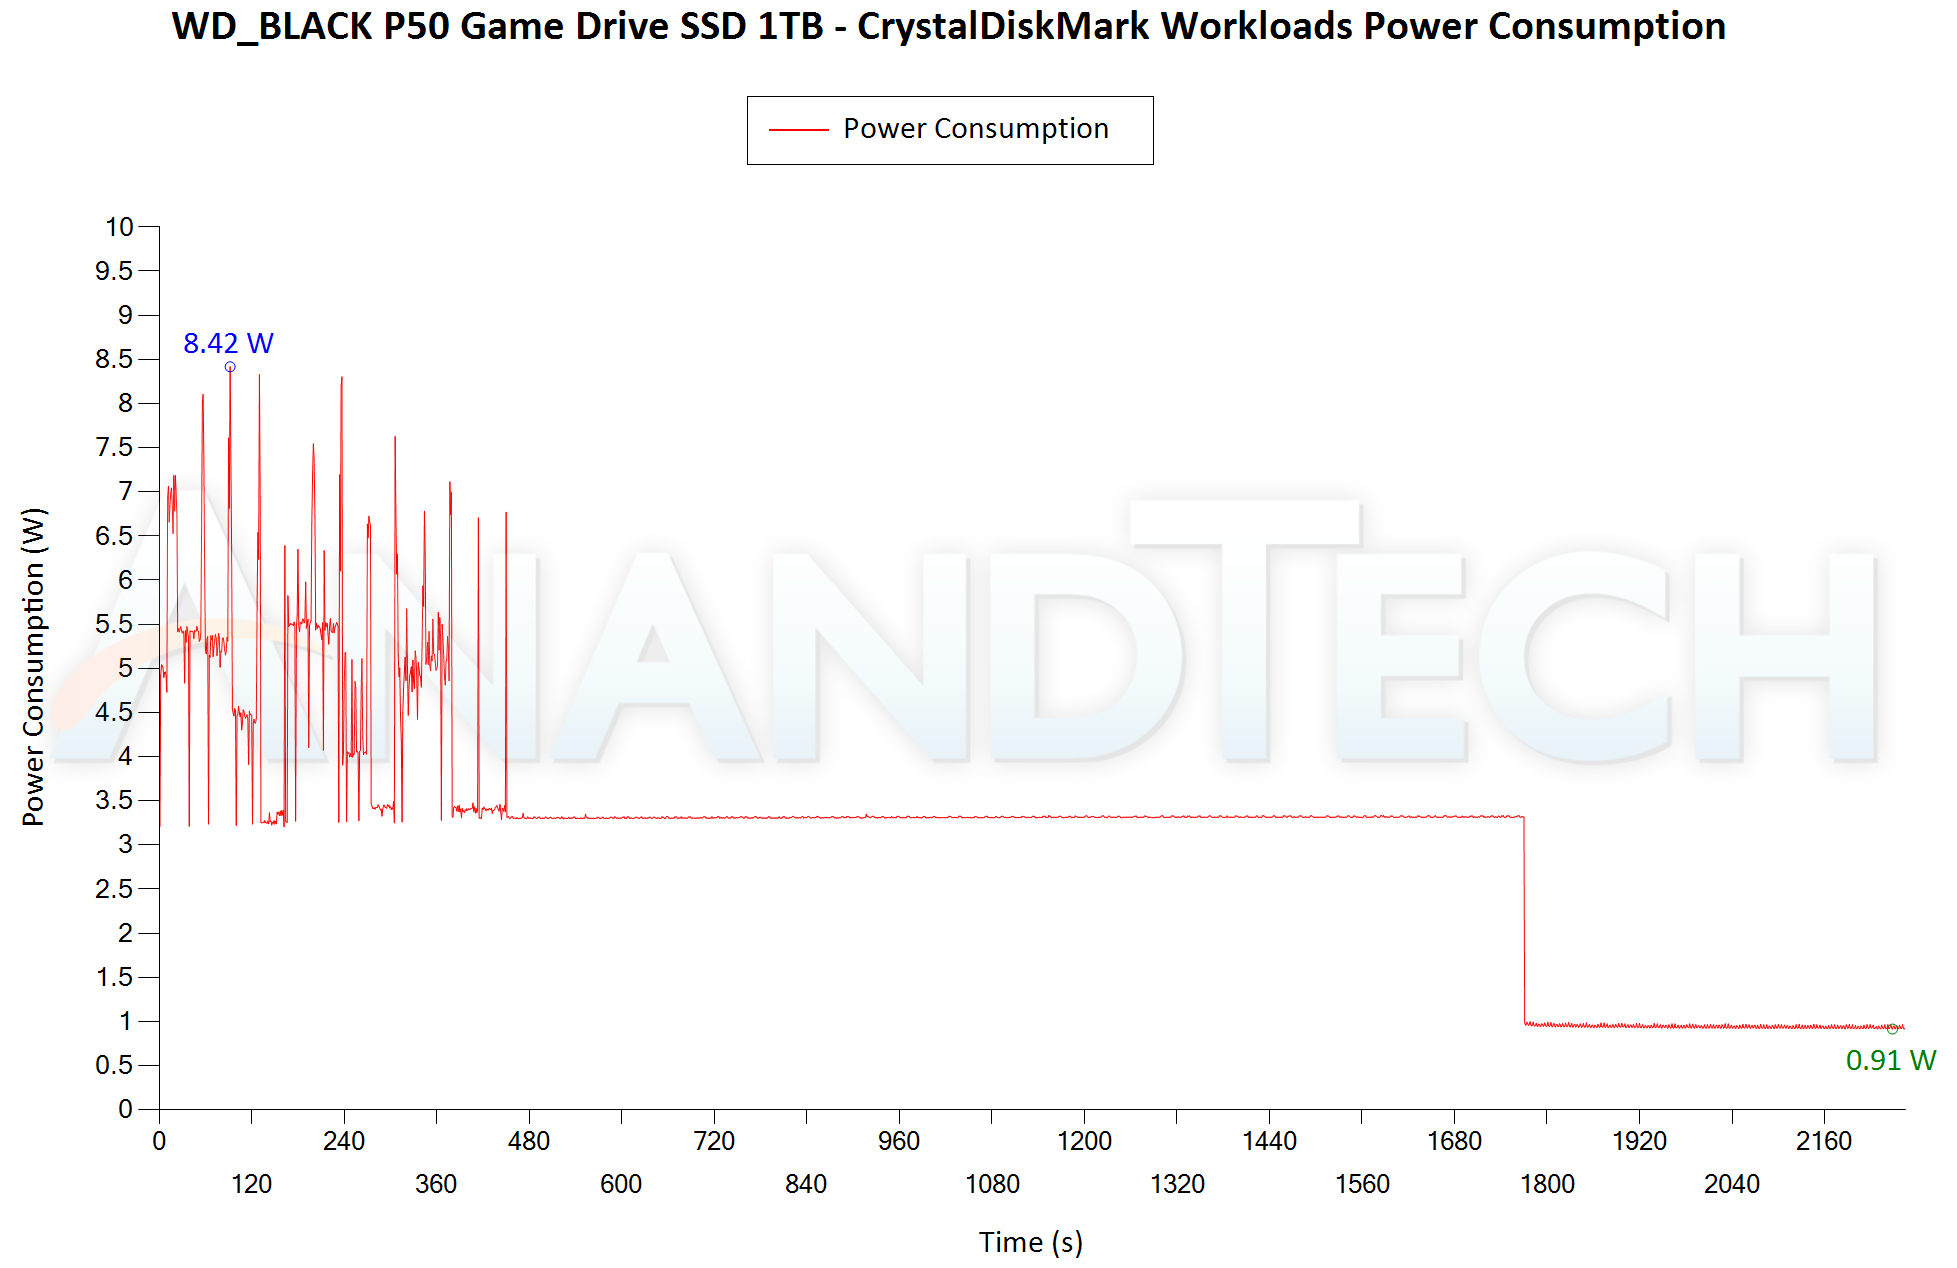
Bus-powered devices can configure themselves to operate within the power delivery constraints of the host port. While Thunderbolt ports are guaranteed to supply up to 15W for client devices, USB 2.0 ports are guaranteed to deliver only 4.5W (900mA @ 5V). In this context, it is interesting to have a fine-grained look at the power consumption profile of the various external drives. Using the Plugable USBC-TKEY, the bus power consumption of the drives was tracked while processing the CrystalDiskMark workloads (separated by 5s intervals). The graphs below plot the instantaneous bus power consumption against time, while singling out the maximum and minimum power consumption numbers.
| CrystalDiskMark Workloads – Power Consumption | |
| TOP: | BOTTOM: |
 |
|
 |
|
The power consumption profile of the P40 is much better than the P50 despite the addition of the RGB lighting (which is on by default). A peak of 5.73W and a low-power idling state of 0.92W are good to see in a 20Gbps PSSD. The drive also enters the low-power state much quicker (5 minutes after last activity) compared to the P50 (around 20 minutes after last activity). A complete turn-off mode is implemented in the Seagate Firecuda (goes to around 0.2W) – that would be nice to see here. The Kingston XS2000 has a much lower power consumption number, but that is only expected given its single-chip UFD controller solution.
Pricing and Competitive Positioning
USB 3.2 Gen 2×2 PSSDs generally carry a pricing premium over the vanilla PSSDs. This has come down a bit after the introduction of native UFD controllers supporting the high-speed interface. With the WD_BLACK P40, Western Digital has brought down the pricing to normal USB 3.2 Gen 2 PSSD levels of last year.
The 1TB version evaluated above comes in at $130. At a similar capacity point, the P50 lands at $200. The XS2000 is obviously cheaper at $110, while the FireCuda is priced at $190. In terms of pricing, the P40 is hard to beat. For read-heavy workloads, it is a no-brainer. For writes, it performs better than the XS2000 over the whole drive span. However, for typical game sizes between 10GB and 100GB, the transfer time to the XS2000 is bound to be shorter given its 98GB SLC cache. The XS2000 also doesn’t have RGB lighting – so the P40 has a slight edge here in the gaming market.
Final Words
The WD_BLACK P40 Game Drive is an interesting budget addition to the gaming-targeted lineup. The lack of performance consistency in writing out huge amounts of data (common when transferring large Steam libraries between systems, for example) is a deal-breaker for performance enthusiasts. However, the drive is able to make use of the high-speed interface well when reading out data. So, the drive could still be beneficial to a subset of the gaming crowd – folks who rarely write out whole games to the drive, but play thenm directly off the PSSD. A segment of gamers may also appreciate the infusion of RGB lighting. The drive is also a solid mid-range performer for traditional use-cases as shown in the PCMark storage workloads.
The most attractive feature of the drive is the pricing. Our recommendation for overall performance and feature set for gamers looking to purchase a USB 3.2 Gen 2×2 drive continues to be the WD_BLACK P50. The SanDisk Extreme PRO v2 (targeting a different market segment) will probably be a better bet if a fancy industrial design, RGB, and other gamers-desired features are not essential. Western Digital offers PSSDs tuned for different price points in a wide range of markets. In that context, the P40 fills an important hole in the company’s portfolio even though it might not take the performance crown.