
Samsung’s portable SSD lineup has enjoyed significant market success since the launch of the T1 back in 2015. Despite the release of the Thunderbolt-capable X5 PSSD in 2018, the company has been focusing primarily on the mainstream market with its T series drives.
The first set of PSSDs from Samsung incorporated a SATA SSD behind a USB 3.2 Gen 1 bridge chip. With the T5 in 2017, the company moved to a USB 3.2 Gen 2 bridge while retaining the SATA SSD. In the T7 Touch launched in 2020, the SATA component was replaced by a NVMe SSD and the USB 3.2 Gen 2 SATA bridge was replaced by a NVMe one. The T7 series was augmented with IP65-rated models (the T7 Shield) in 2022. Despite the same T7 moniker, the Shield’s use of newer NAND enabled improvements in both latency and power consumption.
Samsung is introducing the 2 GBps-class Portable SSD T9 today. Equipped with a USB 3.2 Gen 2×2 (20 Gbps) interface, the PSSD advertises double the performance of the T7 Shield. The company sent over the highest capacity version (4 TB) to put through our rigorous evaluation routine for direct-attached storage devices. The review below presents an in-depth investigation into the design and performance profile of the Samsung Portable SSD T9.
External bus-powered storage devices have grown both in storage capacity as well as speeds over the last decade. Thanks to rapid advancements in flash technology (including the advent of 3D NAND and NVMe) as well as faster host interfaces (such as Thunderbolt and USB 3.x / USB4), we now have palm-sized flash-based storage devices capable of delivering 3GBps+ speeds. While those speeds can be achieved with Thunderbolt, mass-market devices have to rely on USB. Within the USB ecosystem, USB 3.2 Gen 2 (10 Gbps) is fast becoming the entry level for thumb drives and portable SSDs. USB 3.2 Gen 2×2 (20 Gbps) got off to a slow start, but recent computing platforms from both Intel and AMD have started to support it on the host side. The introduction of native USB 3.2 Gen 2×2 flash controllers such as the Phison U18 and Silicon Motion SM2320 has enabled PSSD vendors to bring low-cost power-efficient 20 Gbps external drives to the market.
Broadly speaking, there are five distinct performance levels in this market:
- 2GBps+ drives with Thunderbolt 3 or USB4, using NVMe SSDs
- 2GBps drives with USB 3.2 Gen 2×2, using NVMe SSDs or direct USB flash drive (UFD) controllers
- 1GBps drives with USB 3.2 Gen 2, using NVMe SSDs or direct UFD controllers
- 500MBps drives with USB 3.2 Gen 1 (or, Gen 2, in some cases), using SATA SSDs
- Sub-400MBps drives with USB 3.2 Gen 1, using UFD controllers
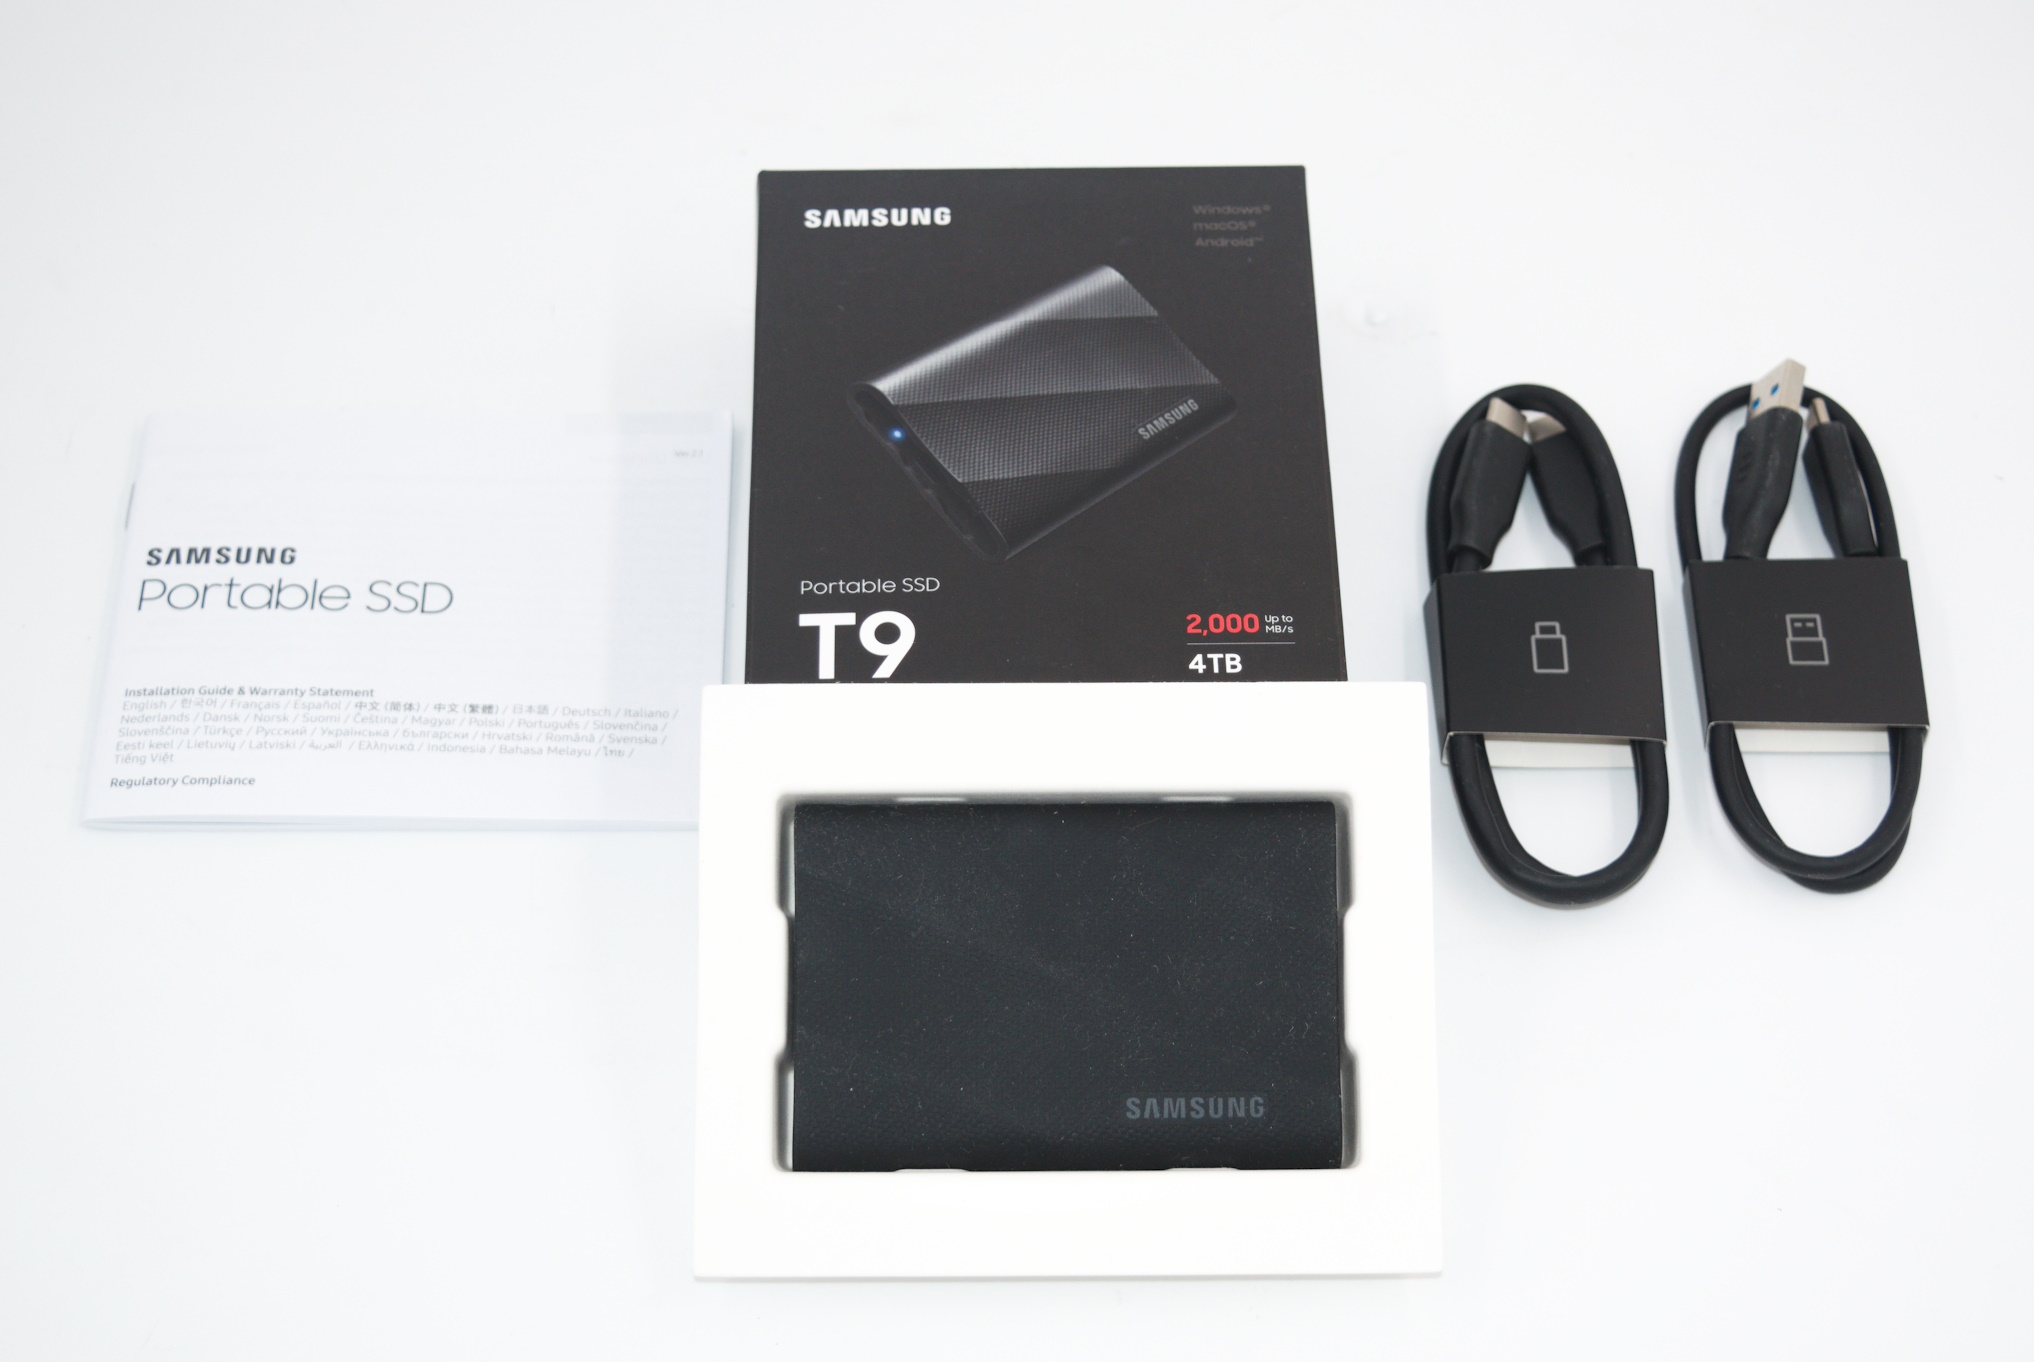
Within each of these levels, there is further segmentation into entry-level, mid-range, and premium based on the choice of internal components. The Samsung Portable SSD T9 4 TB we are looking at today belongs to the second category in the above list. The T9 package comes with the main unit, an installation guide, and two 45 cm USB cables. The Type-C to Type-C one supports 20 Gbps speeds, while the Type-C to Type-A is restricted to 10 Gbps speeds. The main unit has a LED indicator and a Type-C female port (USB 3.2 Gen 2×2 is supported only with Type-C ports).
The main unit has a rubber sleeve, providing it with a bit of ruggedness (withstanding drops, etc.). However, the T9 does not have an IP rating. Disassembling the unit is fairly trivial – after removal of the sleeve, we can see four screws holding the two aluminum blocks together. Other than these, there are four screws hidden behind the label on either end as shown in the gallery below. The PSSD’s main board is sandwiched between the two blocks.


This design is slightly different from the earlier T series drives. We see a more thorough thermal solution with plenty of thermal pads spread out across the board. The aluminum blocks also have raised profiles on the inside in order to ensure good contact with the heat generating components of the board.
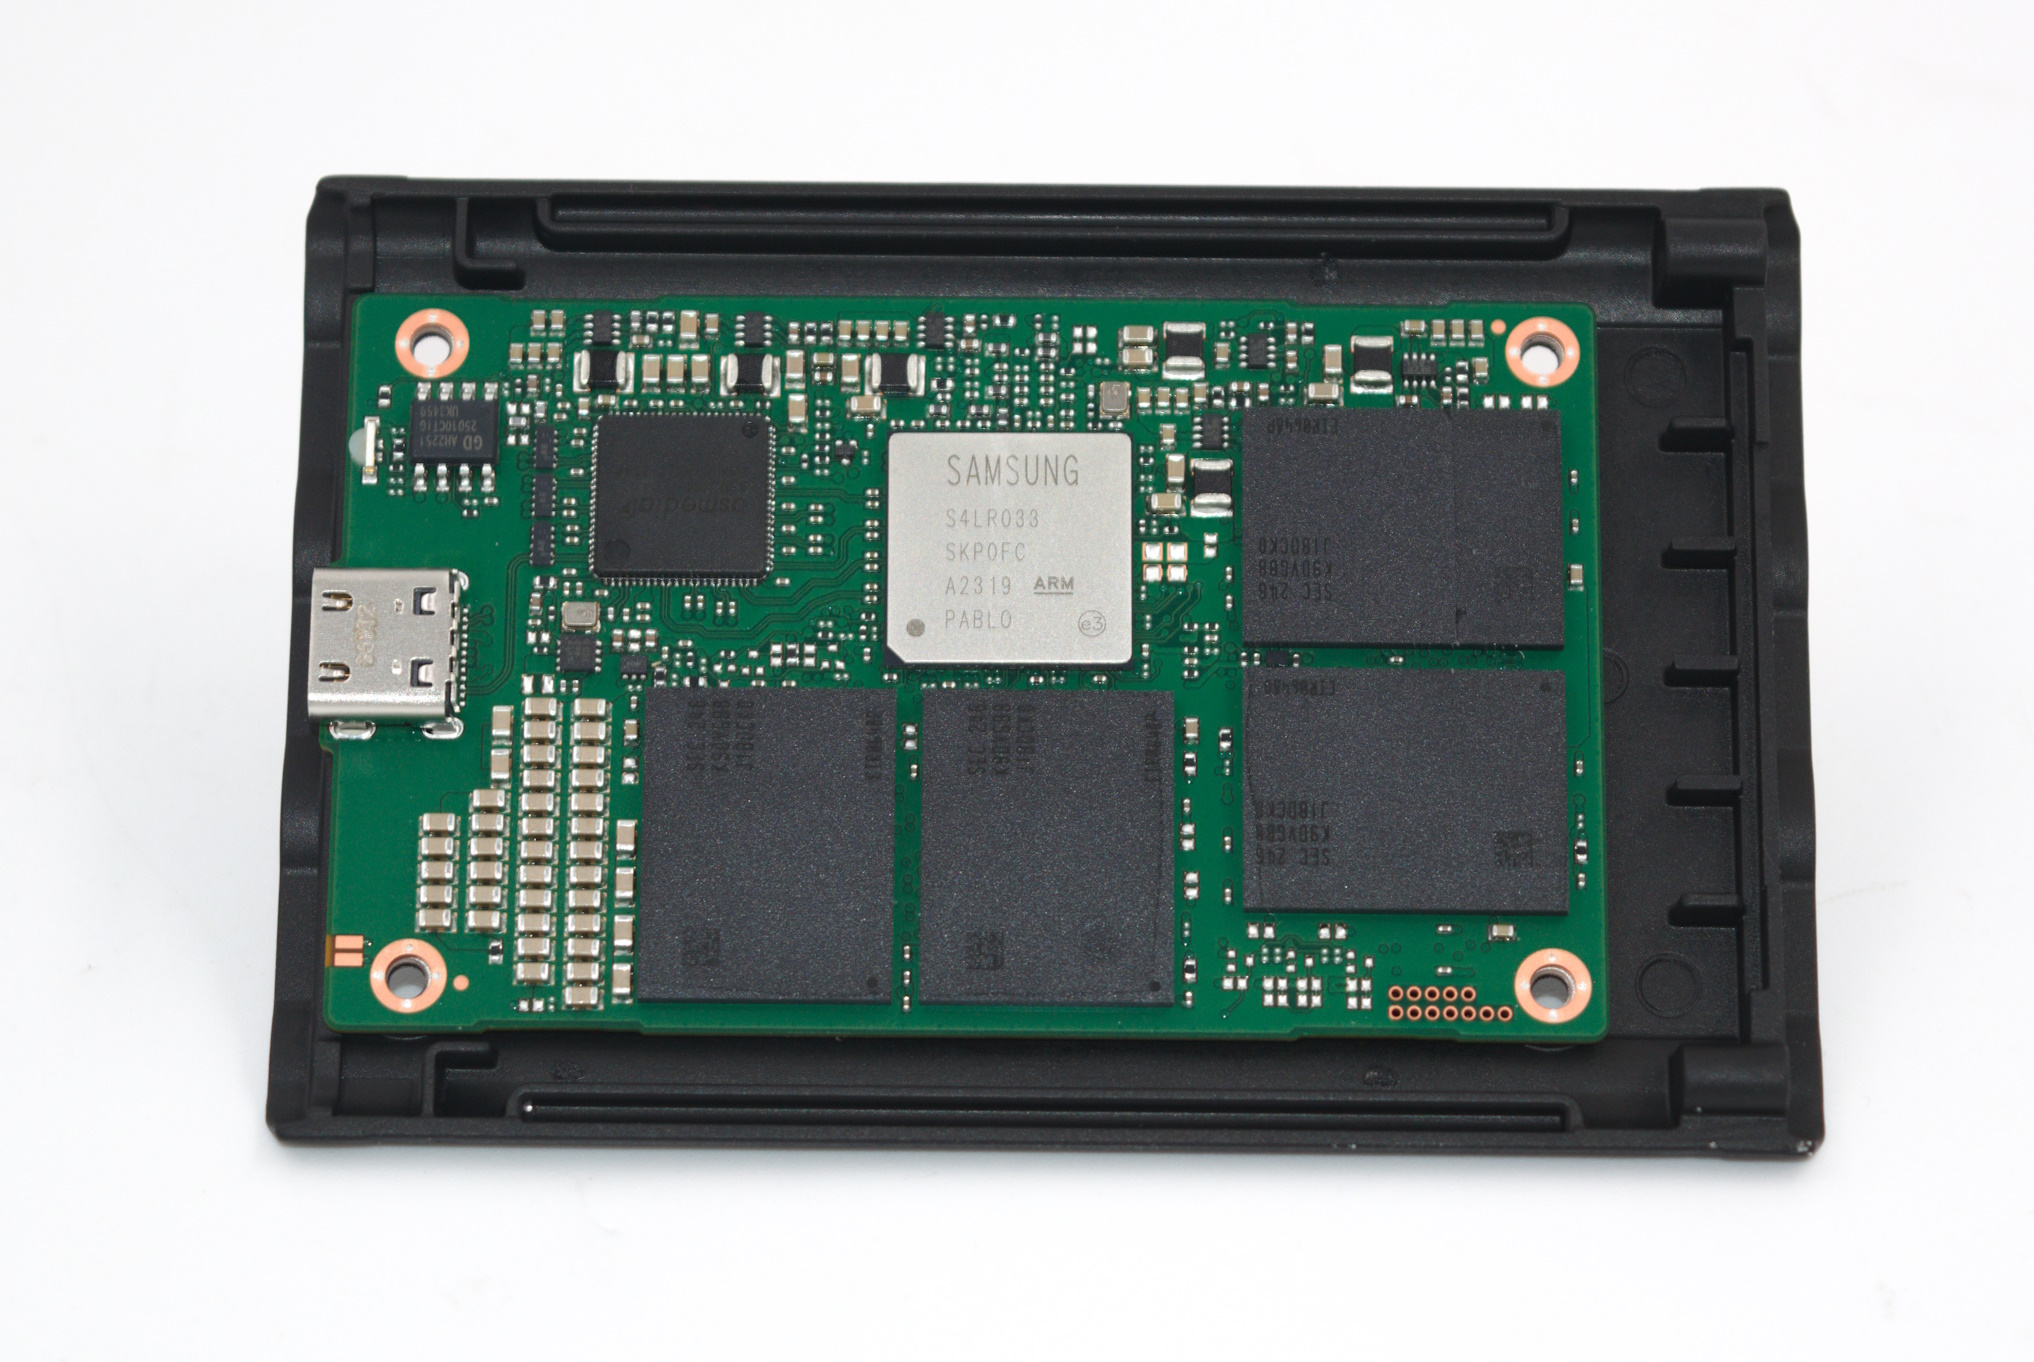
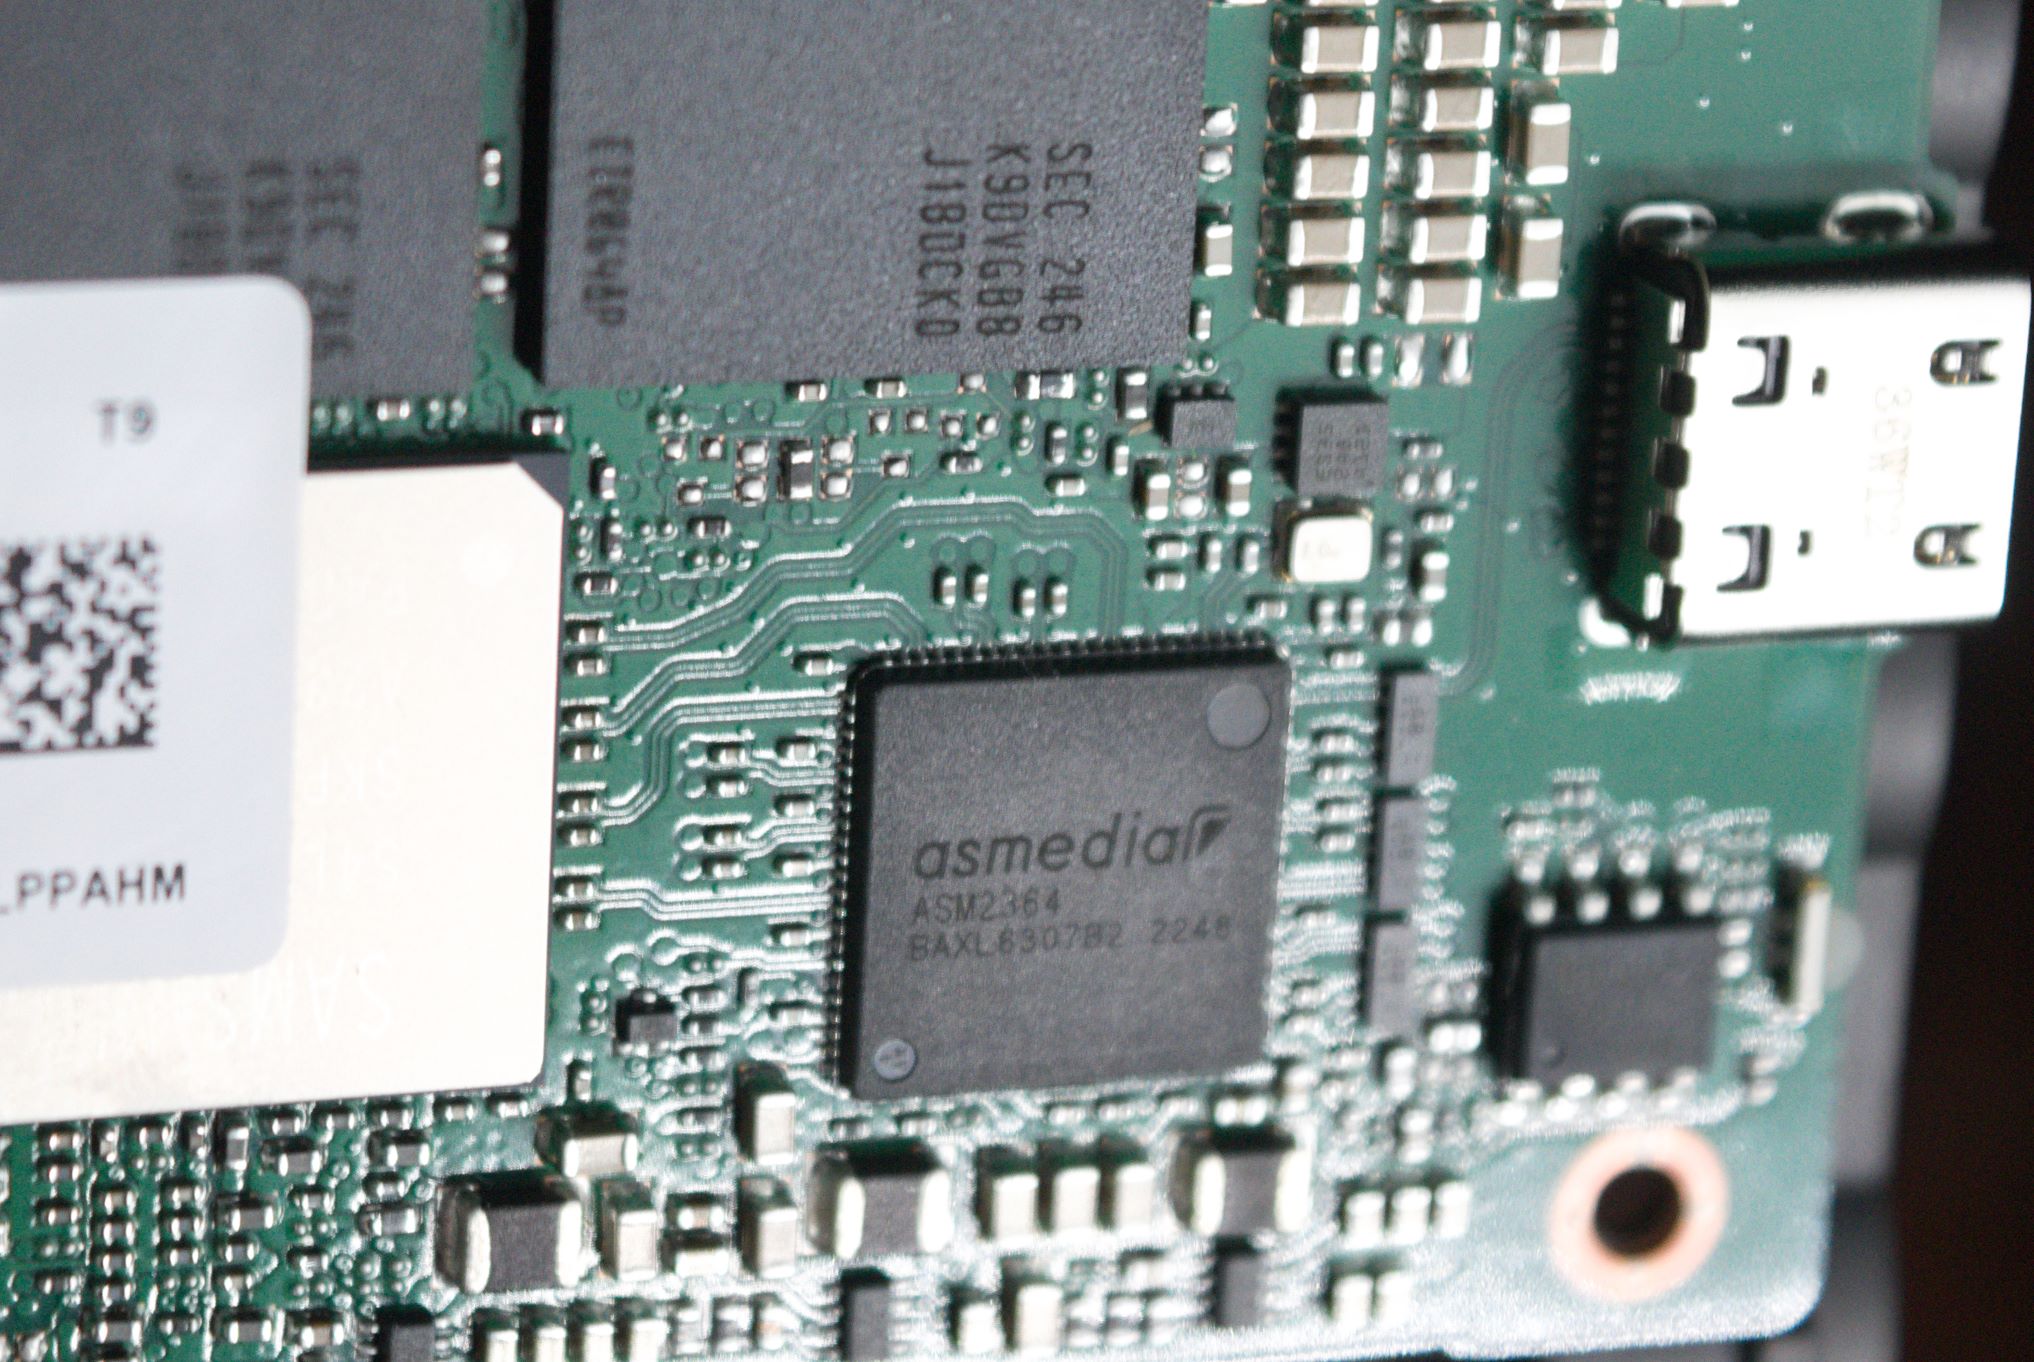
The board itself is very similar to the T7 Shield we reviewed earlier this year. The NVMe SSD controller is the same Pablo silicon, and the NAND package markings point to the use of the same 128L / 136T 6th Gen. V-NAND. The NVMe segment is DRAM-less. Compared to the 4 TB T7 Shield’s board, the only change is the replacement of the ASMedia ASM2362 by the ASMedia ASM2364 USB 3.2 Gen 2×2 – PCIe 3.0 x4 NVMe bridge chip.
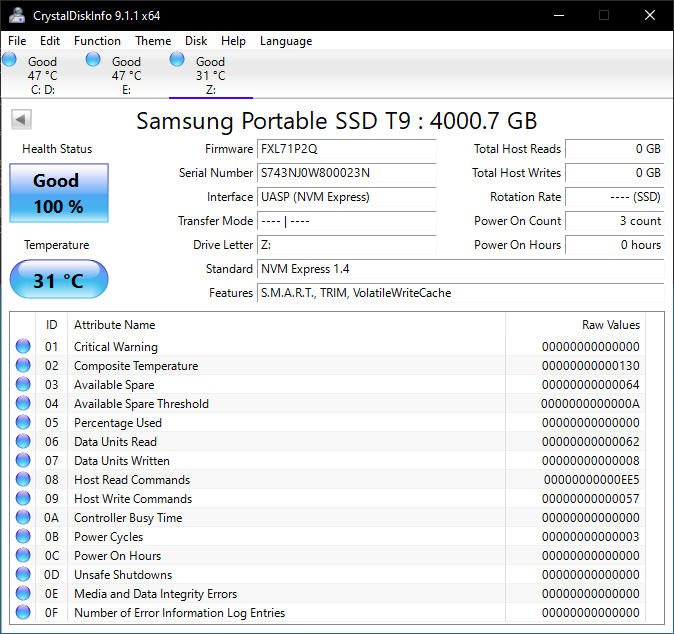
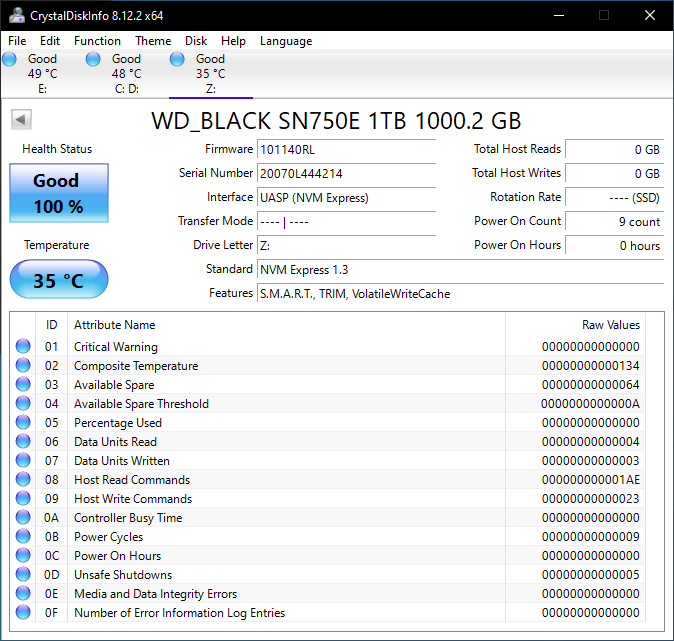
This review compares the Samsung T9 against a host of other USB 3.2 Gen 2×2 PSSDs reviewed earlier. A quick overview of the internal capabilities of theese PSSDs is given by CrystalDiskInfo. The Samsung PSSD T9 supports full S.M.A.R.T passthrough, along with TRIM to ensure consistent performance for the drive over its lifetime.
| S.M.A.R.T Passthrough – CrystalDiskInfo | |
 |
 |
The table below presents a comparative view of the specifications of the different PSSDs presented in this review.
| Comparative Direct-Attached Storage Devices Configuration | ||
| Aspect | ||
| Downstream Port | 1x PCIe 3.0 x4 | 1x PCIe 3.0 x4 (M.2 NVMe) |
| Upstream Port | USB 3.2 Gen 2×2 Type-C (Female) | USB 3.2 Gen 2×2 Type-C |
| Bridge Chip | ASMedia ASM2364 | ASMedia ASM2364 |
| Power | Bus Powered | Bus Powered |
| Use Case | 2GBps-class, sturdy palm-sized high-performance portable SSD with a Type-C interface | Premium 2GBps-class, compact, and sturdy portable SSD in a gumstick form-factor targeting the gaming market |
| Physical Dimensions | 88 mm x 60 mm x 14 mm | 118 mm x 62 mm x 14 mm |
| Weight | 122 grams | 115 grams (without cable) |
| Cable | 45 cm USB 3.2 Gen 2×2 Type-C (male) to Type-C (male) 45 cm USB 3.2 Gen 2 Type-C (male) to Type-A (male) |
30 cm USB 3.2 Gen 2×2 Type-C to Type-C 30 cm USB 3.2 Gen 2 Type-C to Type-A |
| S.M.A.R.T Passthrough | Yes | Yes |
| UASP Support | Yes | Yes |
| TRIM Passthrough | Yes | Yes |
| Hardware Encryption | Yes | Not Available |
| Evaluated Storage | Samsung 136L V-NAND (6th Gen.) | Western Digital SN750E PCIe 3.0 x4 M.2 2280 NVMe SSD SanDisk / Toshiba BiCS 4 96L 3D TLC |
| Price | $440 | USD 210 |
| Review Link | Samsung T9 Portable SSD 4TB Review | WD_BLACK P50 Game Drive SSD 1TB Review #1 (2020) WD_BLACK P50 Game Drive SSD 1TB Review #2 (2021) |
Prior to looking at the benchmark numbers, power consumption, and thermal solution effectiveness, a description of the testbed setup and evaluation methodology is provided.
Testbed Setup and Evaluation Methodology
Direct-attached storage devices (including portable SSDs) are evaluated using the Quartz Canyon NUC (essentially, the Xeon / ECC version of the Ghost Canyon NUC) configured with 2x 16GB DDR4-2667 ECC SODIMMs and a PCIe 3.0 x4 NVMe SSD – the IM2P33E8 1TB from ADATA.
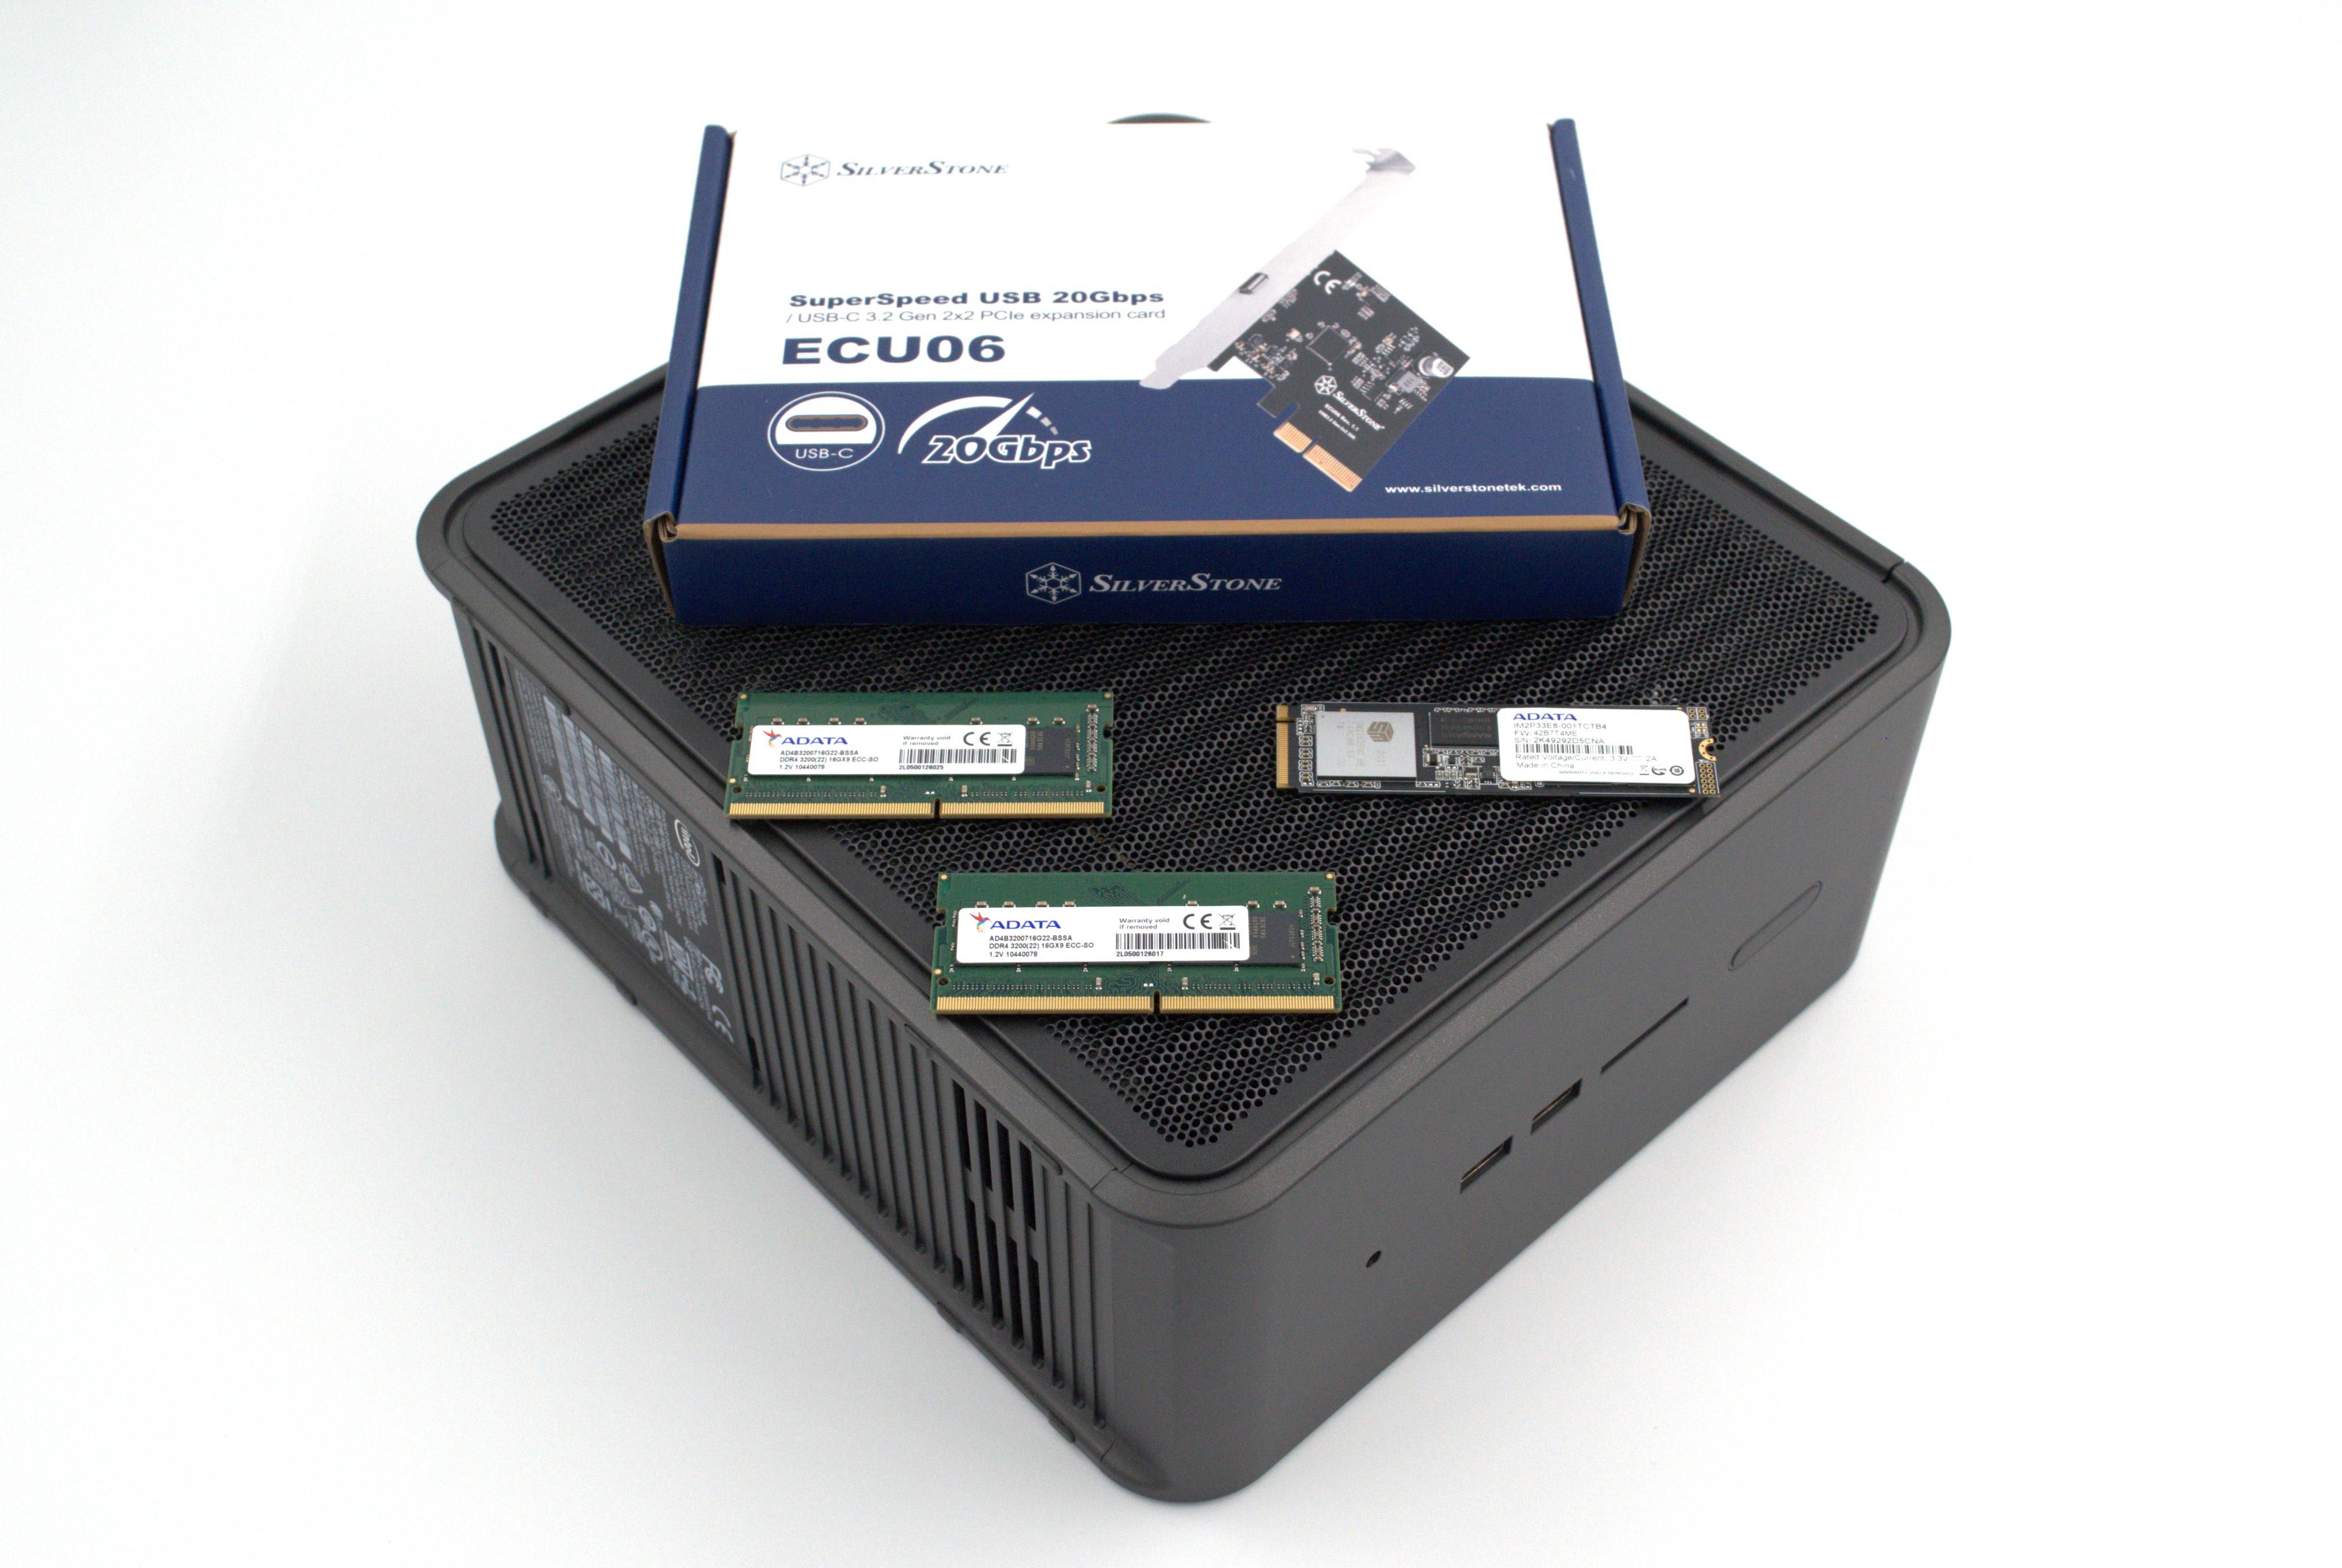
The most attractive aspect of the Quartz Canyon NUC is the presence of two PCIe slots (electrically, x16 and x4) for add-in cards. In the absence of a discrete GPU – for which there is no need in a DAS testbed – both slots are available. In fact, we also added a spare SanDisk Extreme PRO M.2 NVMe SSD to the CPU direct-attached M.2 22110 slot in the baseboard in order to avoid DMI bottlenecks when evaluating Thunderbolt 3 devices. This still allows for two add-in cards operating at x8 (x16 electrical) and x4 (x4 electrical). Since the Quartz Canyon NUC doesn’t have a native USB 3.2 Gen 2×2 port, Silverstone’s SST-ECU06 add-in card was installed in the x4 slot. All non-Thunderbolt devices are tested using the Type-C port enabled by the SST-ECU06.
The specifications of the testbed are summarized in the table below:
| The 2021 AnandTech DAS Testbed Configuration | |
| System | Intel Quartz Canyon NUC9vXQNX |
| CPU | Intel Xeon E-2286M |
| Memory | ADATA Industrial AD4B3200716G22 32 GB (2x 16GB) DDR4-3200 ECC @ 22-22-22-52 |
| OS Drive | ADATA Industrial IM2P33E8 NVMe 1TB |
| Secondary Drive | SanDisk Extreme PRO M.2 NVMe 3D SSD 1TB |
| Add-on Card | SilverStone Tek SST-ECU06 USB 3.2 Gen 2×2 Type-C Host |
| OS | Windows 10 Enterprise x64 (21H1) |
| Thanks to ADATA, Intel, and SilverStone Tek for the build components | |
The testbed hardware is only one segment of the evaluation. Over the last few years, the typical direct-attached storage workloads for memory cards have also evolved. High bit-rate 4K videos at 60fps have become quite common, and 8K videos are starting to make an appearance. Game install sizes have also grown steadily even in portable game consoles, thanks to high resolution textures and artwork. Keeping these in mind, our evaluation scheme for direct-attached storage devices involves multiple workloads which are described in detail in the corresponding sections.
- Synthetic workloads using CrystalDiskMark and ATTO
- Real-world access traces using PCMark 10’s storage benchmark
- Custom robocopy workloads reflective of typical DAS usage
- Sequential write stress test
In the next section, we have an overview of the performance of the Samsung Portable SSD T9 in these benchmarks. Prior to providing concluding remarks, we have some observations on the PSSD’s power consumption numbers and thermal solution also.
Benchmarks such as ATTO and CrystalDiskMark help provide a quick look at the performance of the direct-attached storage device. The results translate to the instantaneous performance numbers that consumers can expect for specific workloads, but do not account for changes in behavior when the unit is subject to long-term conditioning and/or thermal throttling. Yet another use of these synthetic benchmarks is the ability to gather information regarding support for specific storage device features that affect performance.
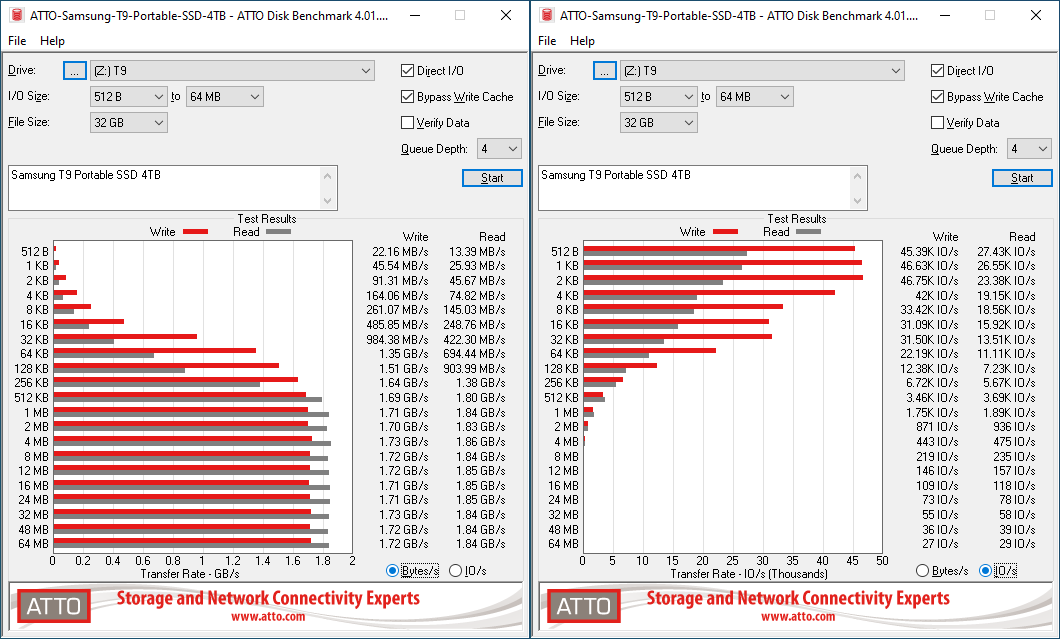
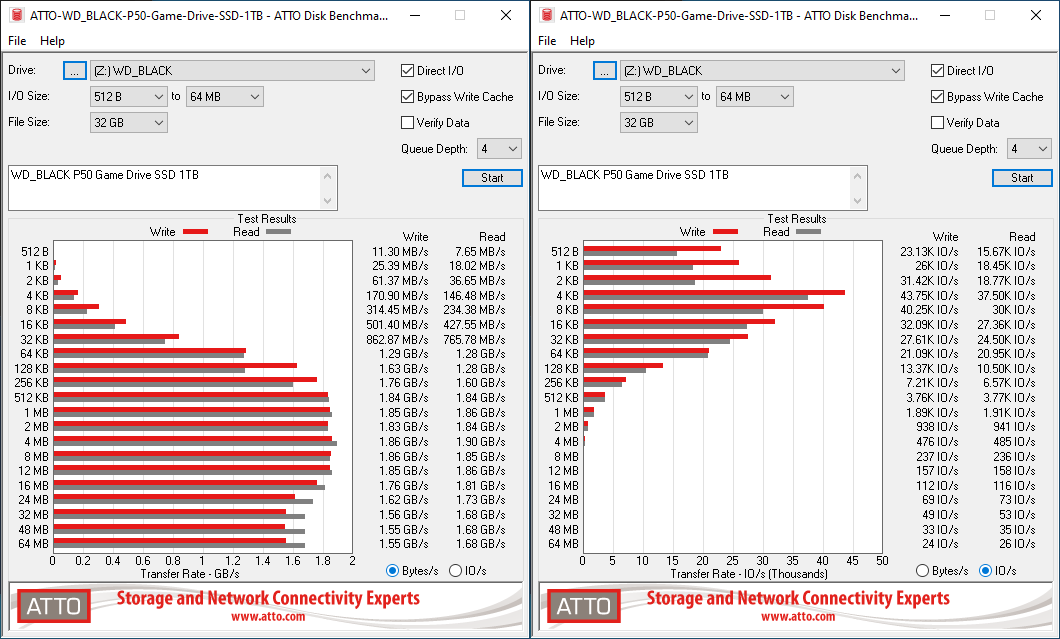
Samsung claims speeds of up to 2000 MBps for the T9 4TB version. Our ATTO testing configuration manages to reach numbers quite close to the advertised one for reads, while the writes are a bit lower. However, we only use a single queue depth of 4 – so, it is only representative of a small subset of real-world workloads. It does allow the visualization of change in transfer rates as the I/O size changes, with optimal performance being reached around 1 MB for a queue depth of 4.
| ATTO Benchmarks | |
| TOP: | BOTTOM: |
 |
|
 |
|
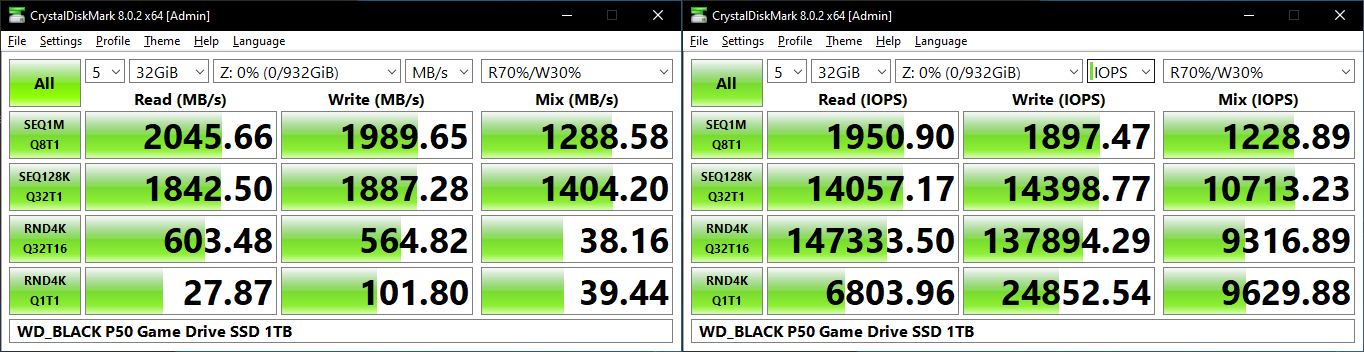
CrystalDiskMark uses four different access traces for reads and writes over a configurable region size. Two of the traces are sequential accesses, while two are 4K random accesses. Internally, CrystalDiskMark uses the Microsoft DiskSpd storage testing tool. The ‘Seq128K Q32T1’ sequential traces use 128K block size with a queue depth of 32 from a single thread, while the ‘4K Q32T16’ one does random 4K accesses with the same queue configuration, but from multiple threads. The ‘Seq1M’ traces use a 1MiB block size. The plain ‘Rnd4K’ one uses only a single queue and single thread . Comparing the ‘4K Q32T16’ and ‘4K Q1T1’ numbers can quickly tell us whether the storage device supports NCQ (native command queuing) / UASP (USB-attached SCSI protocol). If the numbers for the two access traces are in the same ballpark, NCQ / UASP is not supported. This assumes that the host port / drivers on the PC support UASP.
| CrystalDiskMark Benchmarks | |
| TOP: | BOTTOM: |
 |
|
The writes fall short of Samsung’s claims, but the PSSD is indeed able to reach 2000 MBps for large-sized reads. Both NCQ and UASP are supported. Since the base platform is a DRAM-less NVMe SSD, the random access numbers are not as good as what can be obtained with a DRAM-equipped PSSD such as the SanDisk Extreme PRO v2.
AnandTech DAS Suite – Benchmarking for Performance Consistency
Our testing methodology for storage bridges / direct-attached storage units takes into consideration the usual use-case for such devices. The most common usage scenario is transfer of large amounts of photos and videos to and from the unit. Other usage scenarios include the use of the unit as a download or install location for games and importing files directly from it into a multimedia editing program such as Adobe Photoshop. Some users may even opt to boot an OS off an external storage device.
The AnandTech DAS Suite tackles the first use-case. The evaluation involves processing five different workloads:
- AV: Multimedia content with audio and video files totaling 24.03 GB over 1263 files in 109 sub-folders
- Home: Photos and document files totaling 18.86 GB over 7627 files in 382 sub-folders
- BR: Blu-ray folder structure totaling 23.09 GB over 111 files in 10 sub-folders
- ISOs: OS installation files (ISOs) totaling 28.61 GB over 4 files in one folder
- Disk-to-Disk: Addition of 223.32 GB spread over 171 files in 29 sub-folders to the above four workloads (total of 317.91 GB over 9176 files in 535 sub-folders)
Except for the ‘Disk-to-Disk’ workload, each data set is first placed in a 29GB RAM drive, and a robocopy command is issue to transfer it to the external storage unit (formatted in exFAT for flash-based units, and NTFS for HDD-based units).
robocopy /NP /MIR /NFL /J /NDL /MT:32 $SRC_PATH $DEST_PATH
Upon completion of the transfer (write test), the contents from the unit are read back into the RAM drive (read test) after a 10 second idling interval. This process is repeated three times for each workload. Read and write speeds, as well as the time taken to complete each pass are recorded. Whenever possible, the temperature of the external storage device is recorded during the idling intervals. Bandwidth for each data set is computed as the average of all three passes.
The ‘Disk-to-Disk’ workload involves a similar process, but with one iteration only. The data is copied to the external unit from the CPU-attached NVMe drive, and then copied back to the internal drive. It does include more amount of continuous data transfer in a single direction, as data that doesn’t fit in the RAM drive is also part of the workload set.
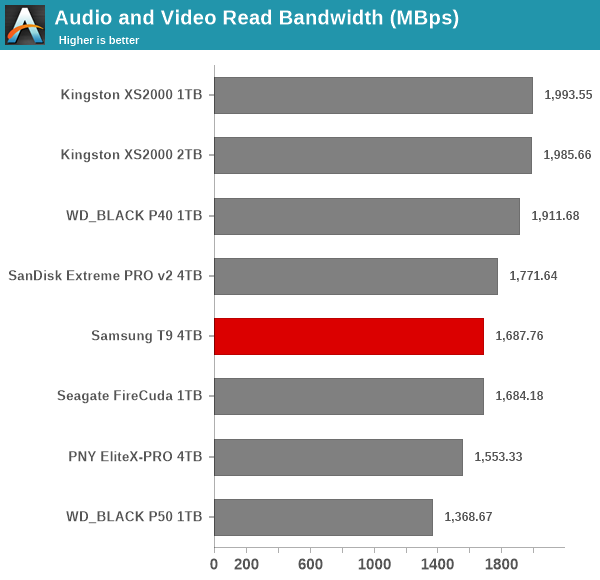
The Samsung T9 marks its entry in the middle or lower half of the pack in all of the cases above. There are two contributing factors here – PSSDs with DRAM perform inherently better when bombarded with accesses, and the direct-to-TLC write speeds for the 6th Gen. V-NAND used in the T9 are probably not as good as those for the other NAND used in other PSSDs in the above graphs.
Performance Consistency
Aspects influencing the performance consistency include SLC caching and thermal throttling / firmware caps on access rates to avoid overheating. This is important for power users, as the last thing that they want to see when copying over 100s of GB of data is the transfer rate going down to USB 2.0 speeds.
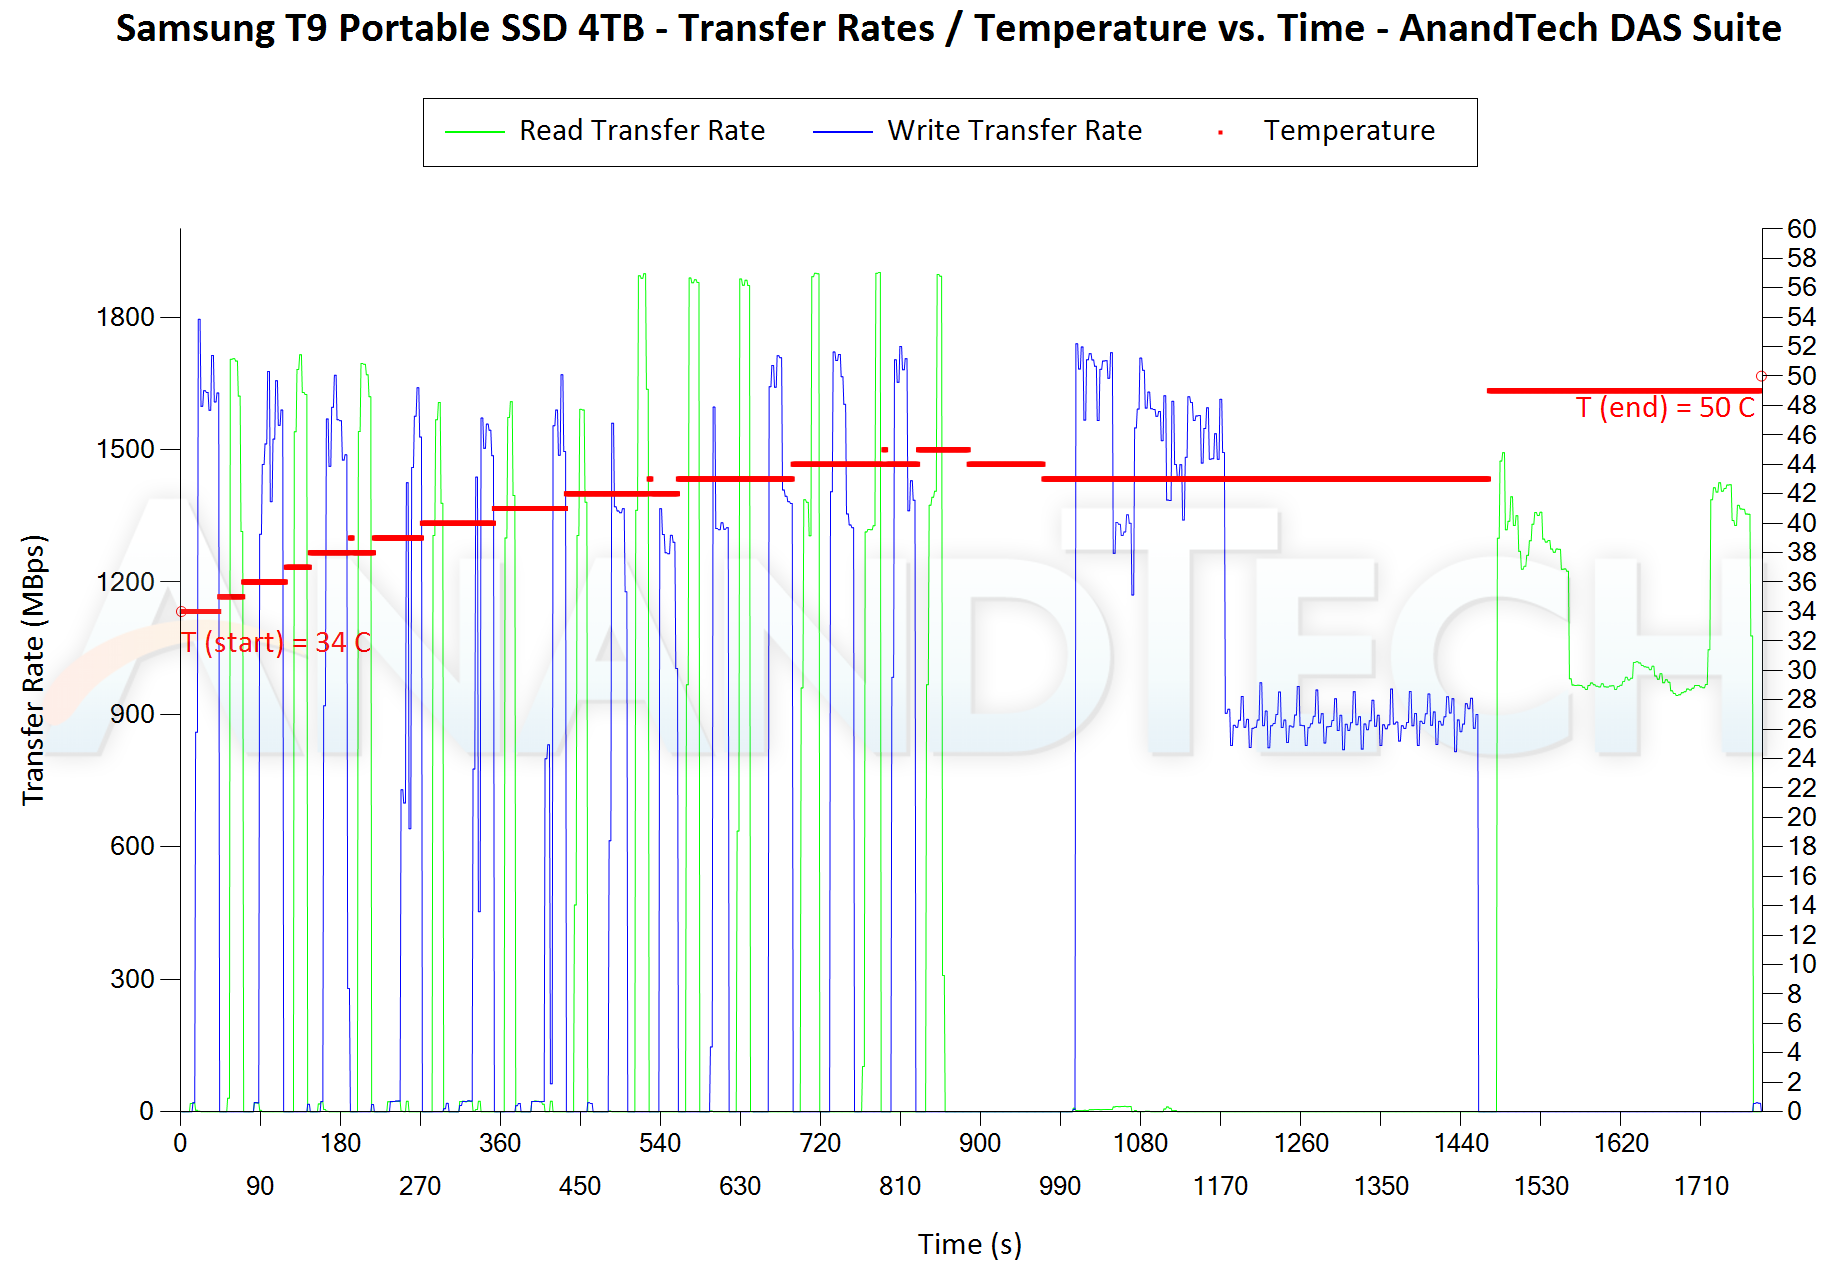
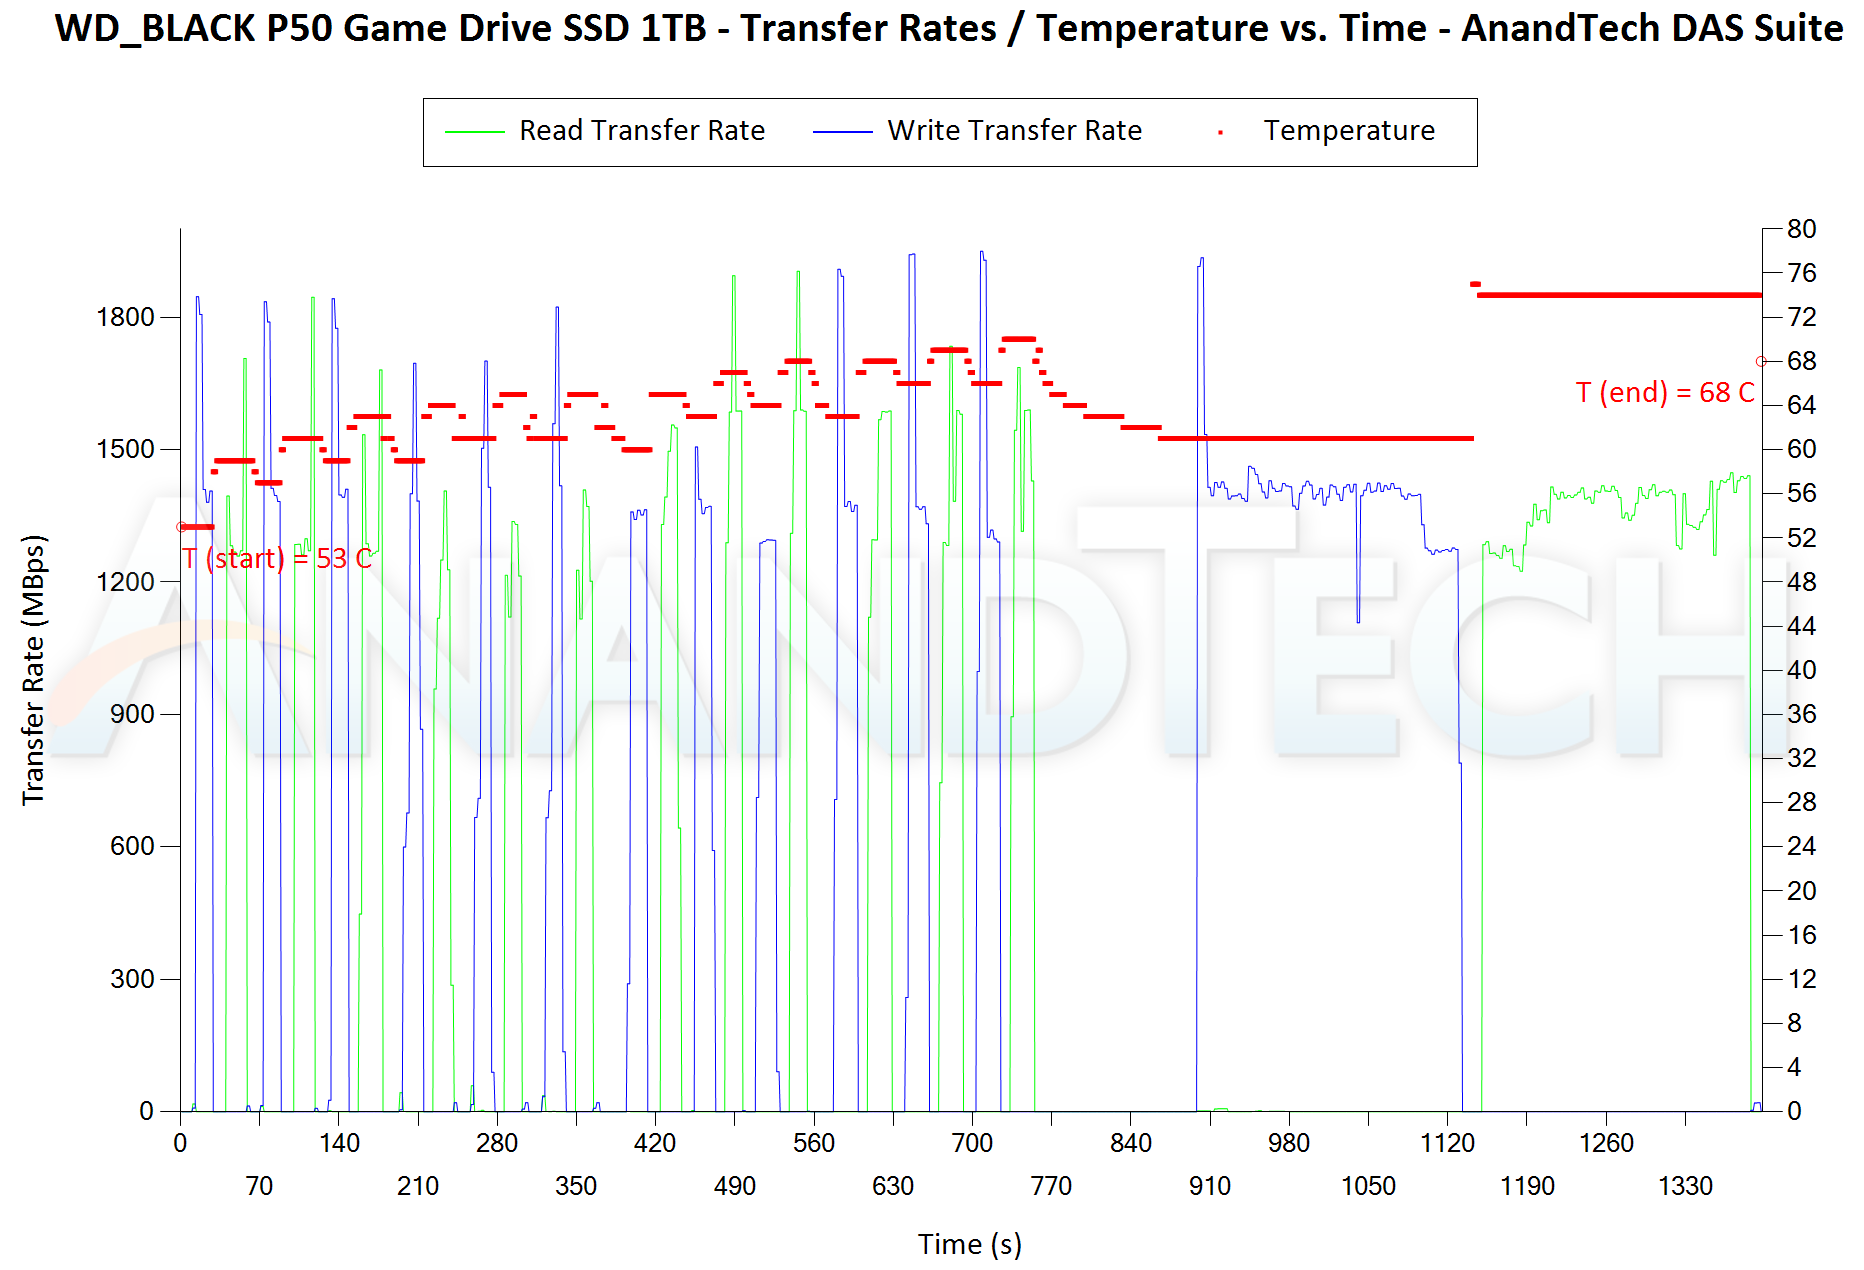
In addition to tracking the instantaneous read and write speeds of the DAS when processing the AnandTech DAS Suite, the temperature of the drive was also recorded. In earlier reviews, we used to track the temperature all through. However, we have observed that SMART read-outs for the temperature in NVMe SSDs using USB 3.2 Gen 2 bridge chips end up negatively affecting the actual transfer rates. To avoid this problem, we have restricted ourselves to recording the temperature only during the idling intervals. The graphs below present the recorded data.
| AnandTech DAS Suite – Performance Consistency | |
| TOP: | BOTTOM: |
 |
|
 |
|
The first three sets of writes and reads correspond to the AV suite. A small gap (for the transfer of the video suite from the internal SSD to the RAM drive) is followed by three sets for the Home suite. Another small RAM-drive transfer gap is followed by three sets for the Blu-ray folder. This is followed up with the large-sized ISO files set. Finally, we have the single disk-to-disk transfer set.
The T9 has very good performance consistency, with the SLC cliff barely seen in the RAM drive transfer sets. However, there is a sharp drop down to 900 MBps from 1.5 GBps in the disk-to-disk transfer set. That said, the temperature profile of the PSSD is very good, with the internals at 50C at the end of the transfer routine.
PCMark 10 Storage Bench – Real-World Access Traces
There are a number of storage benchmarks that can subject a device to artificial access traces by varying the mix of reads and writes, the access block sizes, and the queue depth / number of outstanding data requests. We saw results from two popular ones – ATTO, and CrystalDiskMark – in a previous section. More serious benchmarks, however, actually replicate access traces from real-world workloads to determine the suitability of a particular device for a particular workload. Real-world access traces may be used for simulating the behavior of computing activities that are limited by storage performance. Examples include booting an operating system or loading a particular game from the disk.
PCMark 10’s storage bench (introduced in v2.1.2153) includes four storage benchmarks that use relevant real-world traces from popular applications and common tasks to fully test the performance of the latest modern drives:
- The Full System Drive Benchmark uses a wide-ranging set of real-world traces from popular applications and common tasks to fully test the performance of the fastest modern drives. It involves a total of 204 GB of write traffic.
- The Quick System Drive Benchmark is a shorter test with a smaller set of less demanding real-world traces. It subjects the device to 23 GB of writes.
- The Data Drive Benchmark is designed to test drives that are used for storing files rather than applications. These typically include NAS drives, USB sticks, memory cards, and other external storage devices. The device is subjected to 15 GB of writes.
- The Drive Performance Consistency Test is a long-running and extremely demanding test with a heavy, continuous load for expert users. In-depth reporting shows how the performance of the drive varies under different conditions. This writes more than 23 TB of data to the drive.
Despite the data drive benchmark appearing most suitable for testing direct-attached storage, we opt to run the full system drive benchmark as part of our evaluation flow. Many of us use portable flash drives as boot drives and storage for Steam games. These types of use-cases are addressed only in the full system drive benchmark.
The Full System Drive Benchmark comprises of 23 different traces. For the purpose of presenting results, we classify them under five different categories:
- Boot: Replay of storage access trace recorded while booting Windows 10
- Creative: Replay of storage access traces recorded during the start up and usage of Adobe applications such as Acrobat, After Effects, Illustrator, Premiere Pro, Lightroom, and Photoshop.
- Office: Replay of storage access traces recorded during the usage of Microsoft Office applications such as Excel and Powerpoint.
- Gaming: Replay of storage access traces recorded during the start up of games such as Battlefield V, Call of Duty Black Ops 4, and Overwatch.
- File Transfers: Replay of storage access traces (Write-Only, Read-Write, and Read-Only) recorded during the transfer of data such as ISOs and photographs.
PCMark 10 also generates an overall score, bandwidth, and average latency number for quick comparison of different drives. The sub-sections in the rest of the page reference the access traces specified in the PCMark 10 Technical Guide.
Booting Windows 10
The read-write bandwidth recorded for each drive in the boo access trace is presented below.
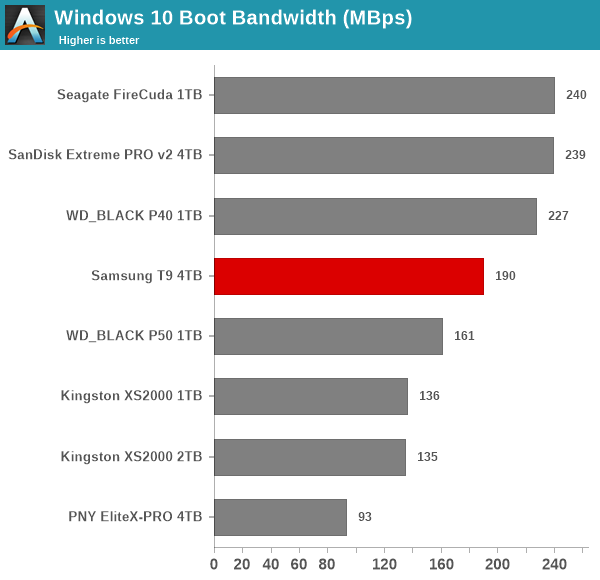
The mixture of access traces triggered by this workload is well serviced by dedicated NVMe SSD controllers – so we see the PSSDs based on native flash controllers in the lower half. The T9 makes a respectable entry by being better than the P50 from 2020. However, it is left way behind by the PSSDs using DRAM-equipped NVMe drives.
Creative Workloads
The read-write bandwidth recorded for each drive in the sacr, saft, sill, spre, slig, sps, aft, exc, ill, ind, psh, and psl access traces are presented below.
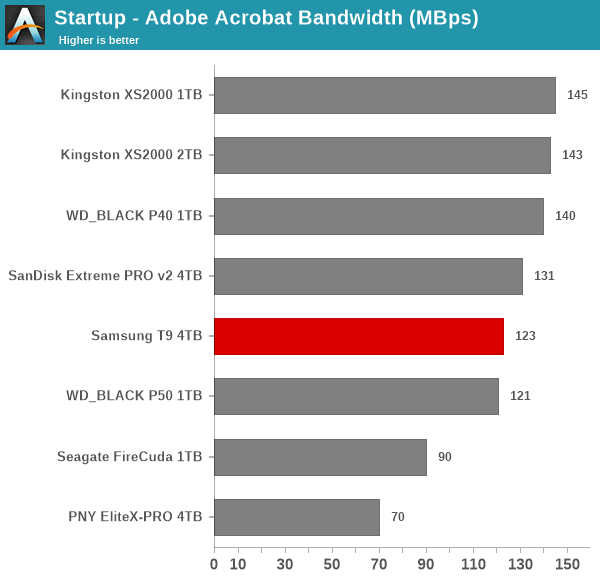
The T9 does not deliver exceptional performance for any of these workloads, but at the same time, it manages to place itself in the middle of the pack.
Office Workloads
The read-write bandwidth recorded for each drive in the exc and pow access traces are presented below.
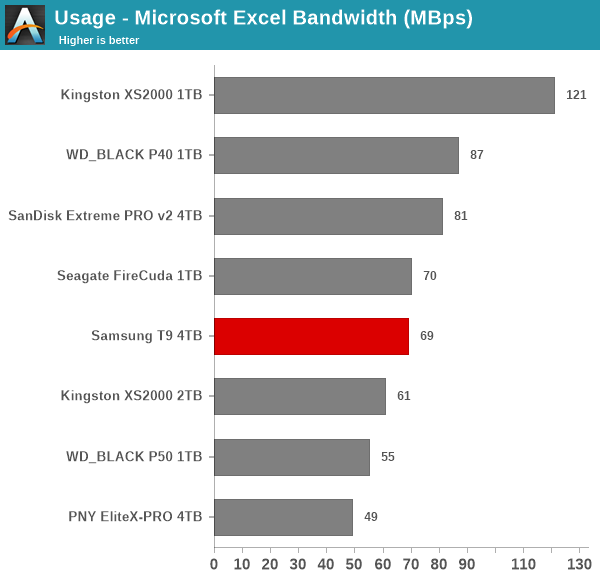
The presence of a Phison U17 drive in the comparison list helps save the T9 from making up the rear of the pack. The Powerpoint workload, in particular, is handled quite poorly by the T9.
Gaming Workloads
The read-write bandwidth recorded for each drive in the bf, cod, and ow access traces are presented below.
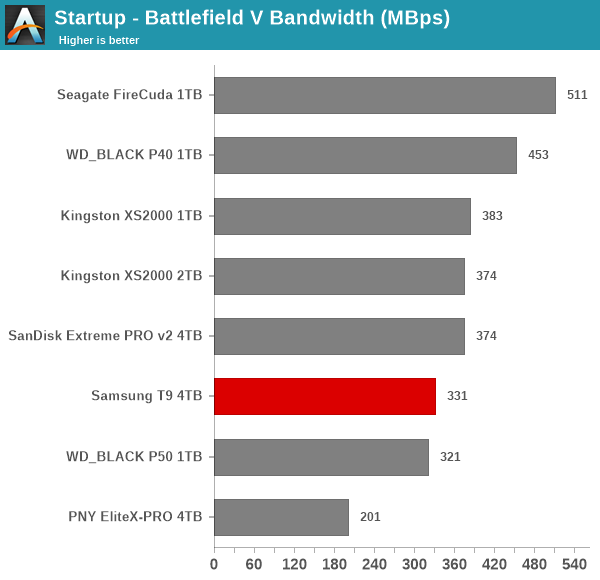
The scenario seen for the Office workloads plays out here also, with only the PNY EliteX-PRO faring worse for these read-intensive use-cases.
Files Transfer Workloads
The read-write bandwidth recorded for each drive in the cp1, cp2, cp3, cps1, cps2, and cps3 access traces are presented below.
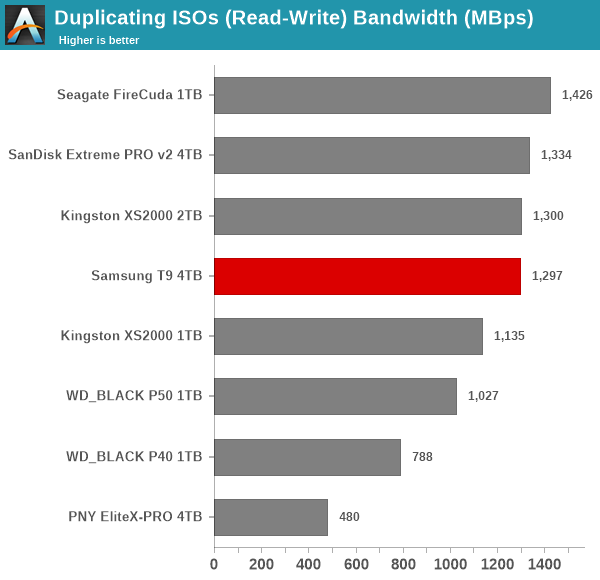
The T9 performs moderately well here, and the presence of reads in the midst of write pressure exposes the shortcomings in the native flash controller-based PSSDs. Still, the T9 is not able to surpass the performance of DRAM-equipped drives.
Overall Scores
PCMark 10 reports an overall score based on the observed bandwidth and access times for the full workload set. The score, bandwidth, and average access latency for each of the drives are presented below.
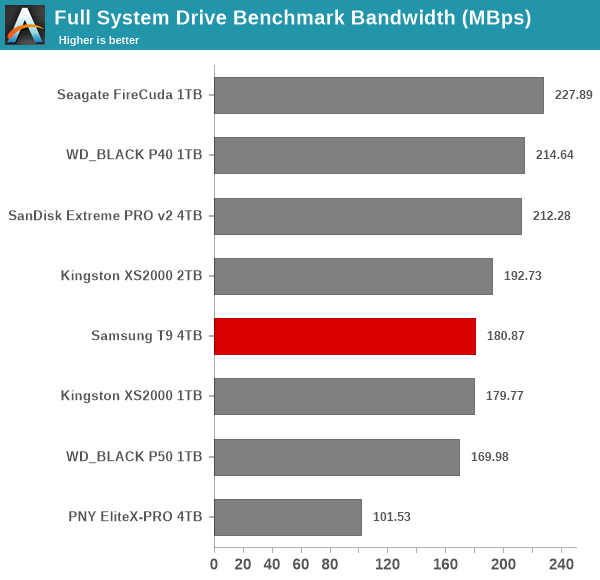
The T9 finds itself in the bottom half of the pack, but the absolute scores for all PSSDs without DRAM are fairly close to each other.
The performance of the PSSDs in various real-world access traces as well as synthetic workloads was brought out in the preceding section. We also looked at the performance consistency for these cases. Power users may also be interested in performance consistency under worst-case conditions, as well as drive power consumption. The latter is also important when used with battery powered devices such as notebooks and smartphones. Pricing is also an important aspect. We analyze each of these in detail below.
Worst-Case Performance Consistency
Flash-based storage devices tend to slow down in unpredictable ways when subject to a large number of small-sized random writes. Many benchmarks use that scheme to pre-condition devices prior to the actual testing in order to get a worst-case representative number. Fortunately, such workloads are uncommon for direct-attached storage devices, where workloads are largely sequential in nature. Use of SLC caching as well as firmware caps to prevent overheating may cause drop in write speeds when a flash-based DAS device is subject to sustained sequential writes.
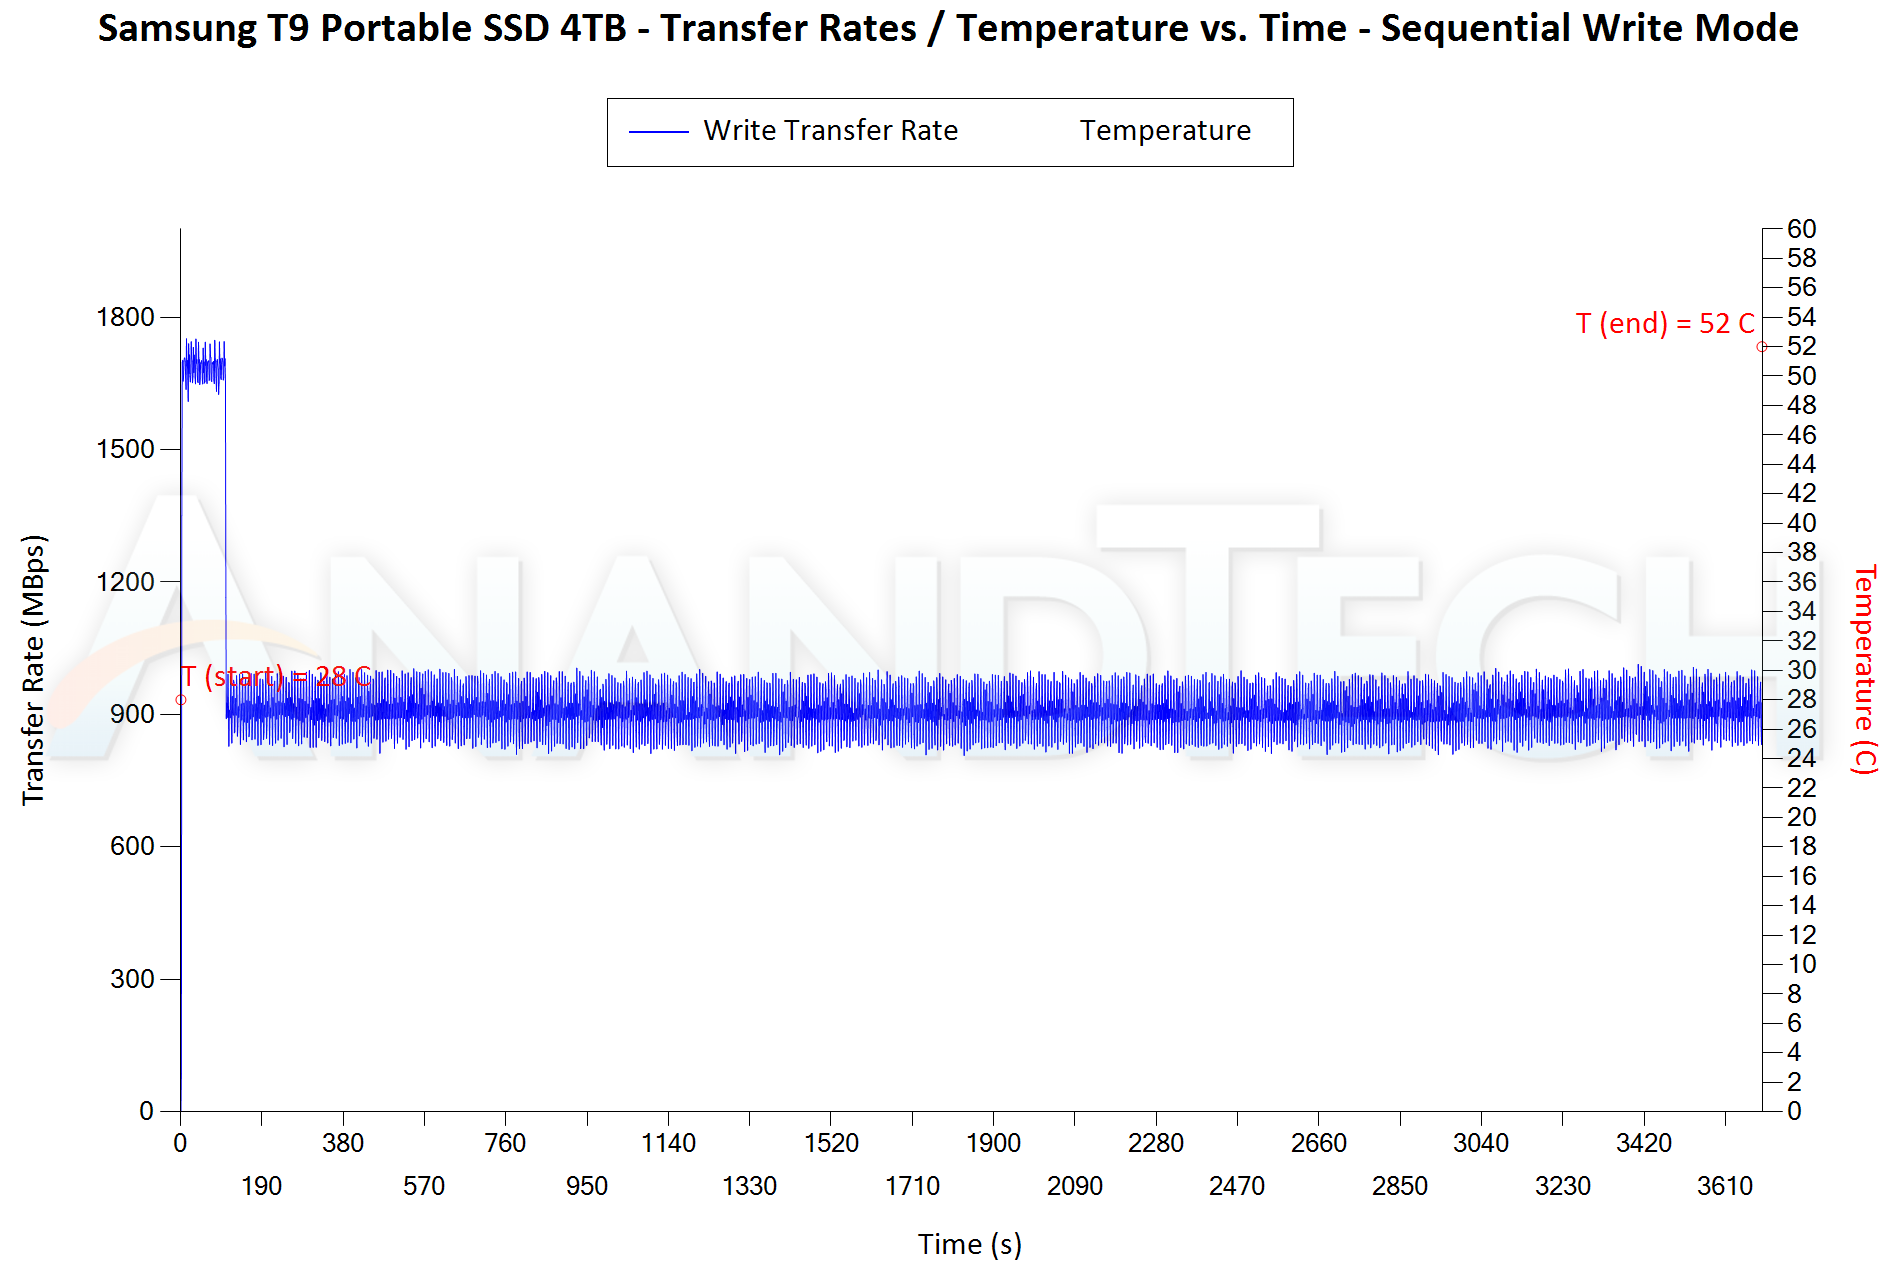
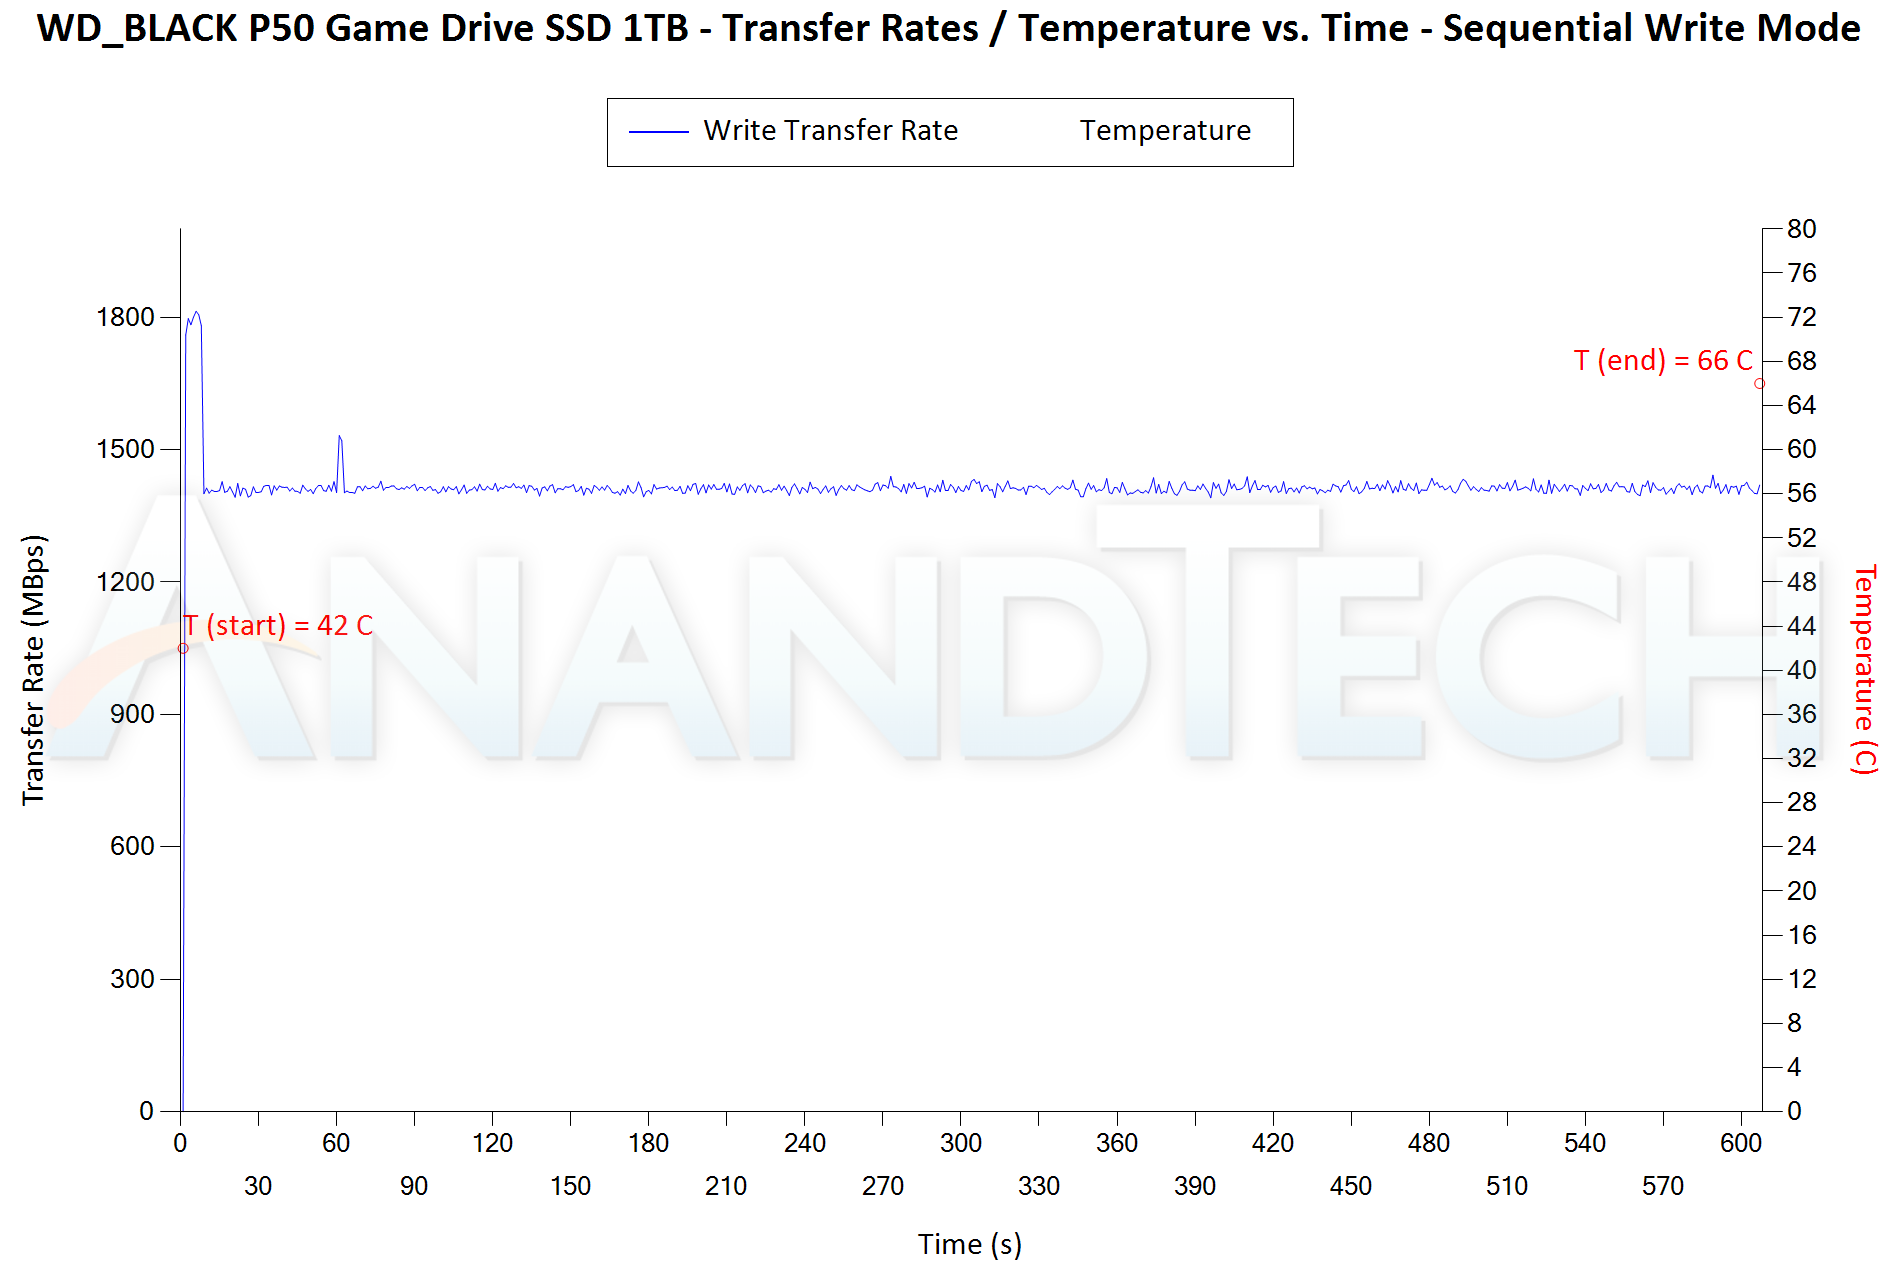
Our Sequential Writes Performance Consistency Test configures the device as a raw physical disk (after deleting configured volumes). A fio workload is set up to write sequential data to the raw drive with a block size of 128K and iodepth of 32 to cover 90% of the drive capacity. The internal temperature is recorded at either end of the workload, while the instantaneous write data rate and cumulative total write data amount are recorded at 1-second intervals.
| Sequential Writes to 90% Capacity – Performance Consistency | |
| TOP: | BOTTOM: |
 |
|
 |
|
The T9 is able to ingest data at the highest possible speeds for up to 105s continuously. After that, the pseudo-SLC cache of around 175 GB gets filled up, and speeds drop down to around 900 MBps. If the user workload is going to be less than 175 GB, this is not a concern at all. The thermal profile in this test is also excellent. With the temperature ending up at 52C, it is matched only by the SanDisk Extreme PRO PSSD v2’s 58C, with the rest heating up to more than 65C despite having much steeper SLC cliffs. Overall, the direct-to-TLC writes could have been faster on the bandwidth front. On the thermal solution side, there is absolutely no cause for complaint.
Power Consumption
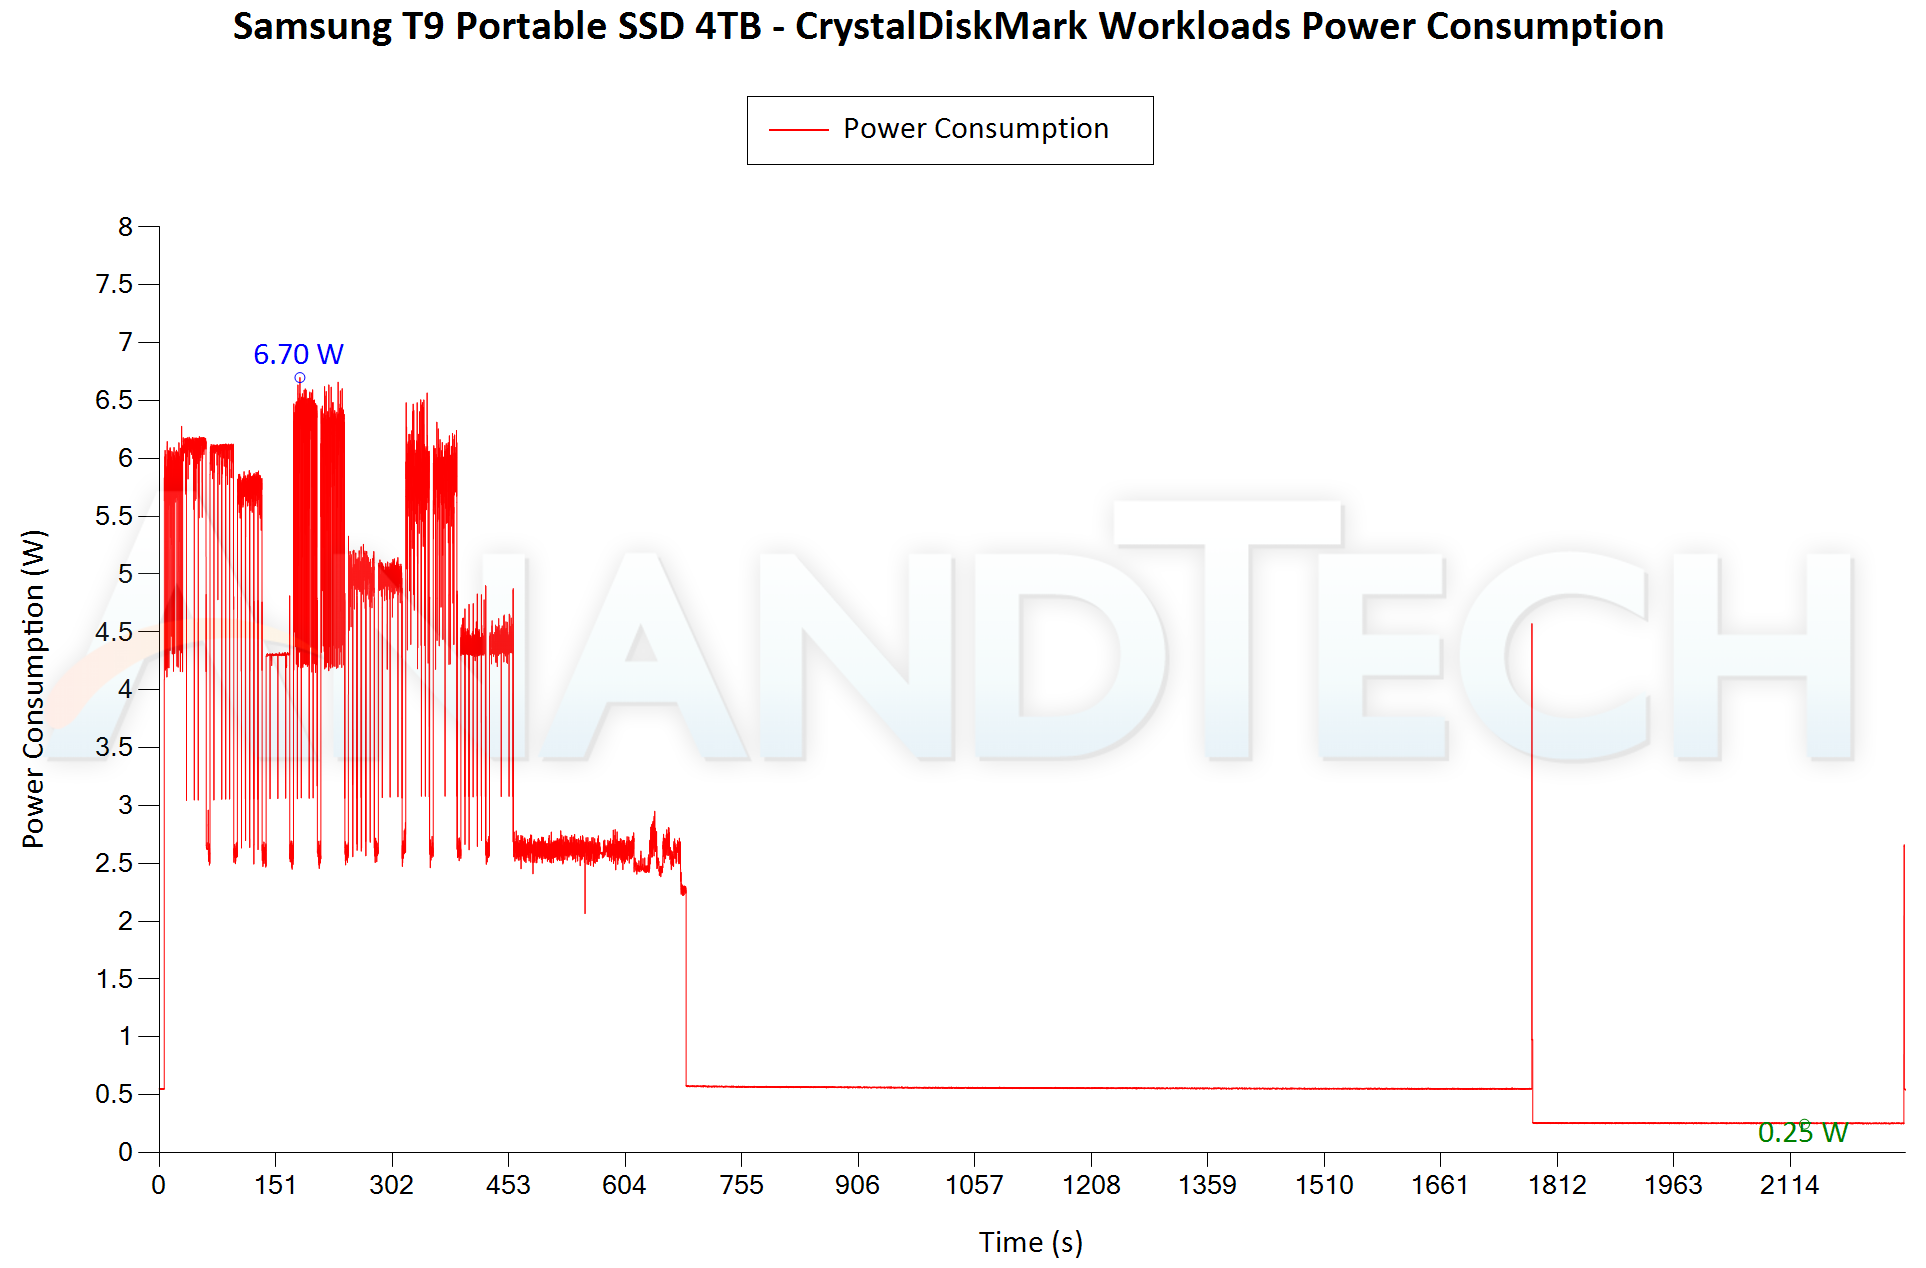
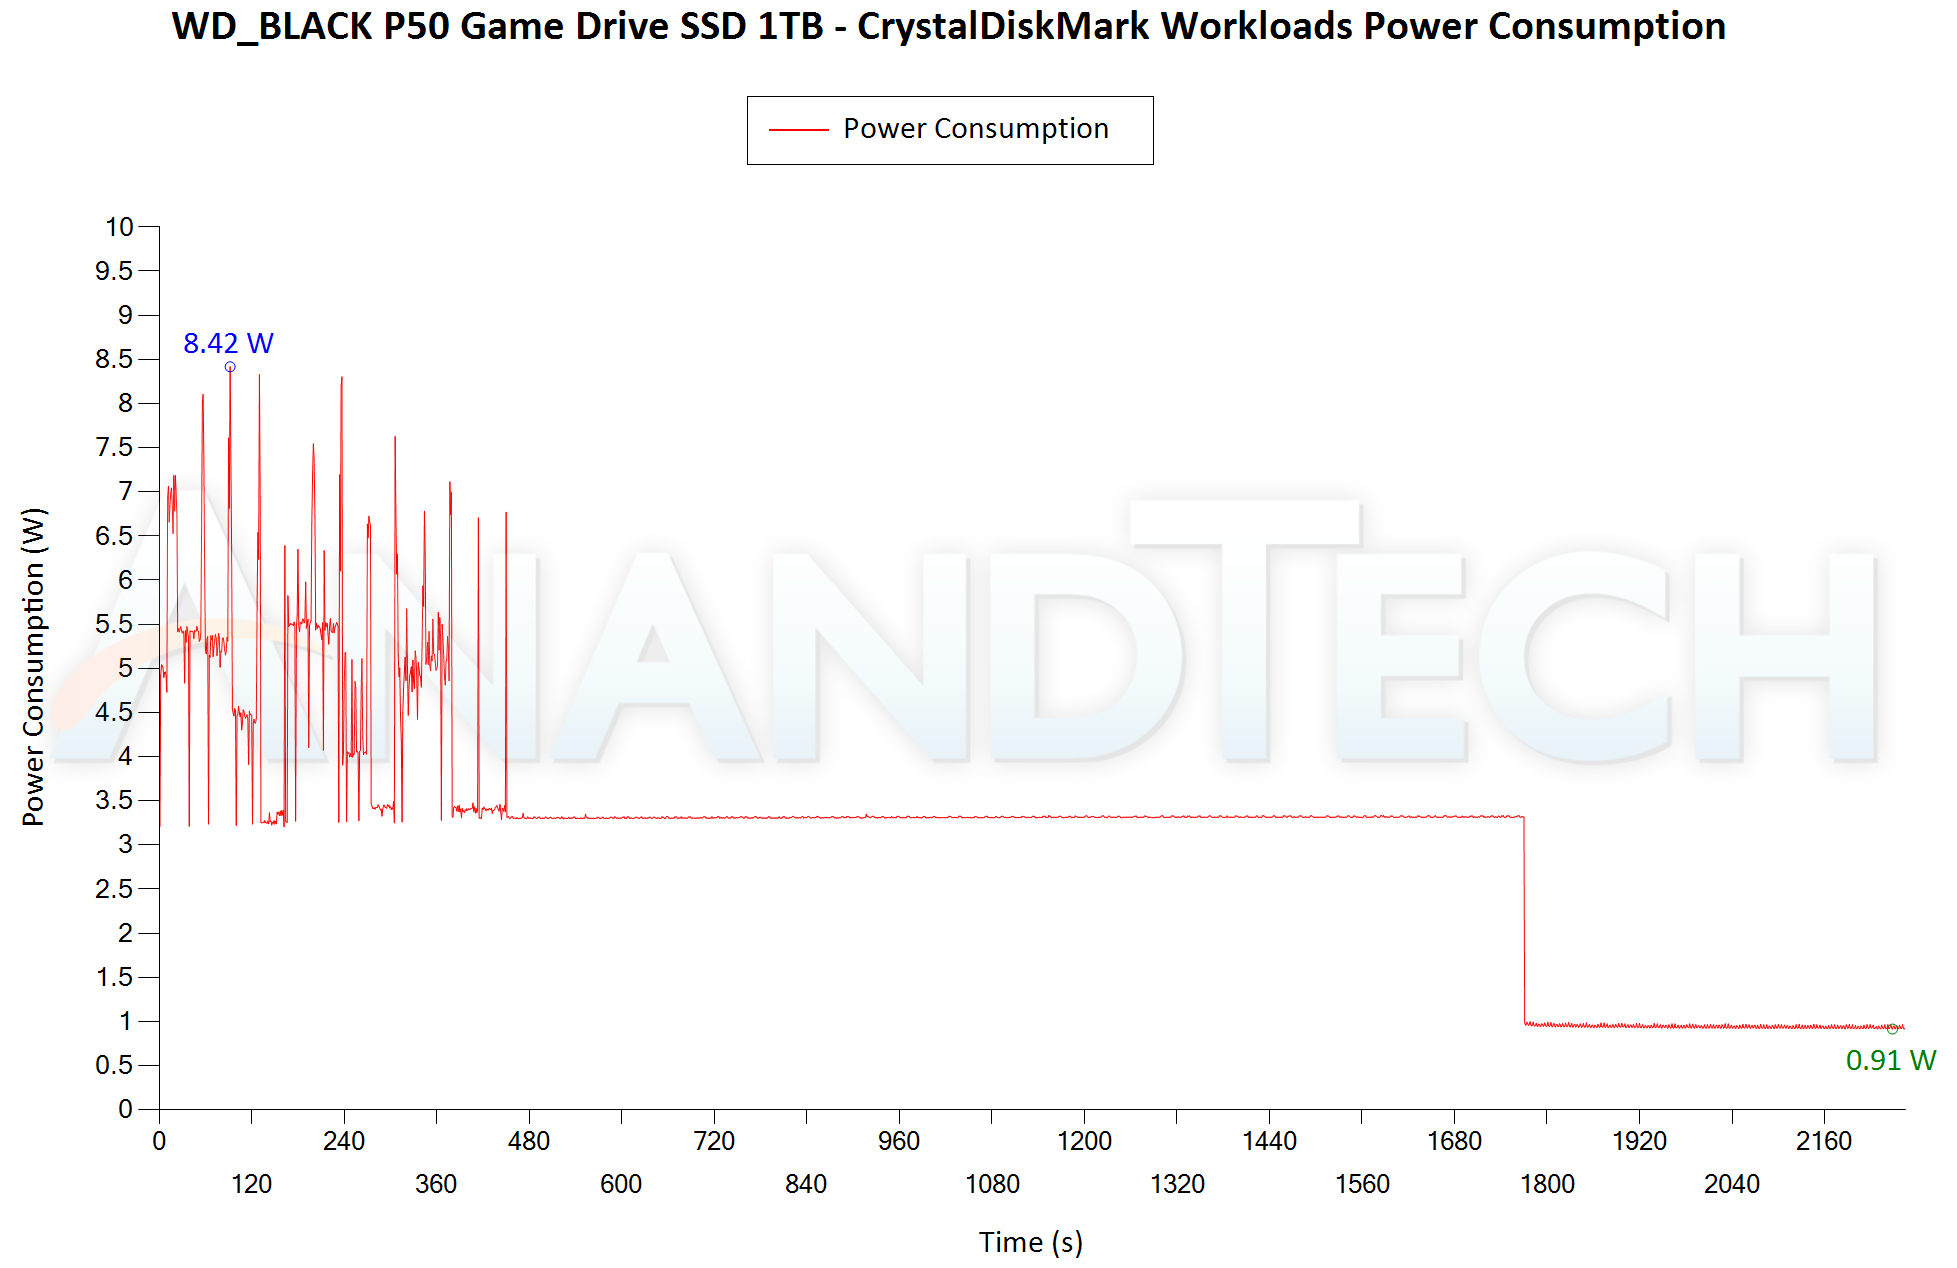
Bus-powered devices can configure themselves to operate within the power delivery constraints of the host port. While Thunderbolt ports are guaranteed to supply up to 15W for client devices, USB 2.0 ports are guaranteed to deliver only 2.5W (500mA @ 5V). In this context, it is interesting to have a fine-grained look at the power consumption profile of the various external drives. Using the ChargerLAB KM003C, the bus power consumption of the drives was tracked while processing the CrystalDiskMark workloads (separated by 5s intervals). The graphs below plot the instantaneous bus power consumption against time, while singling out the maximum and minimum power consumption numbers.
| CrystalDiskMark Workloads – Power Consumption | |
| TOP: | BOTTOM: |
 |
|
 |
|
The peak power consumption (6.7W) is quite competitive against all other PSSDs that are not based on native flash controllers. The lowest idle power number of 0.25W is also the least among such PSSDs. However, the PSSDs based on controllers like the Phison U18 and Silicon Motion SM2320 have a true deep-sleep mode where the bus power consumption is essentially non-existent. Unfortunately, the Samsung T9 doesn’t seem to have such a mode.
Final Words
The Samsung Portable SSD T9 is available for purchase today, with suggested pricing of $140 for the 1 TB version, $240 for the 2 TB, and $440 for the 4 TB SKU. At these prices, the value proposition does not look good for the T9. The SanDisk Extreme PRO v2 that wins out on most of the benchmarks, and has similar thermal profile is priced at $300. We are aware that recent batches of the SanDisk PSSD have resulted in extreme consumer dissatisfaction, but we believe Western Digital has already addressed the problem if they are confident enough to continue selling it. The Crucial X10 Pro 4 TB is priced at $290, but we have not included it in the comparison list in this review, as that PSSD is still under evaluation. The other PSSDs are all based on native controllers and can’t match the T9’s performance profile. Despite their much lower price points, they do not contribute to the comparative value proposition discussion.
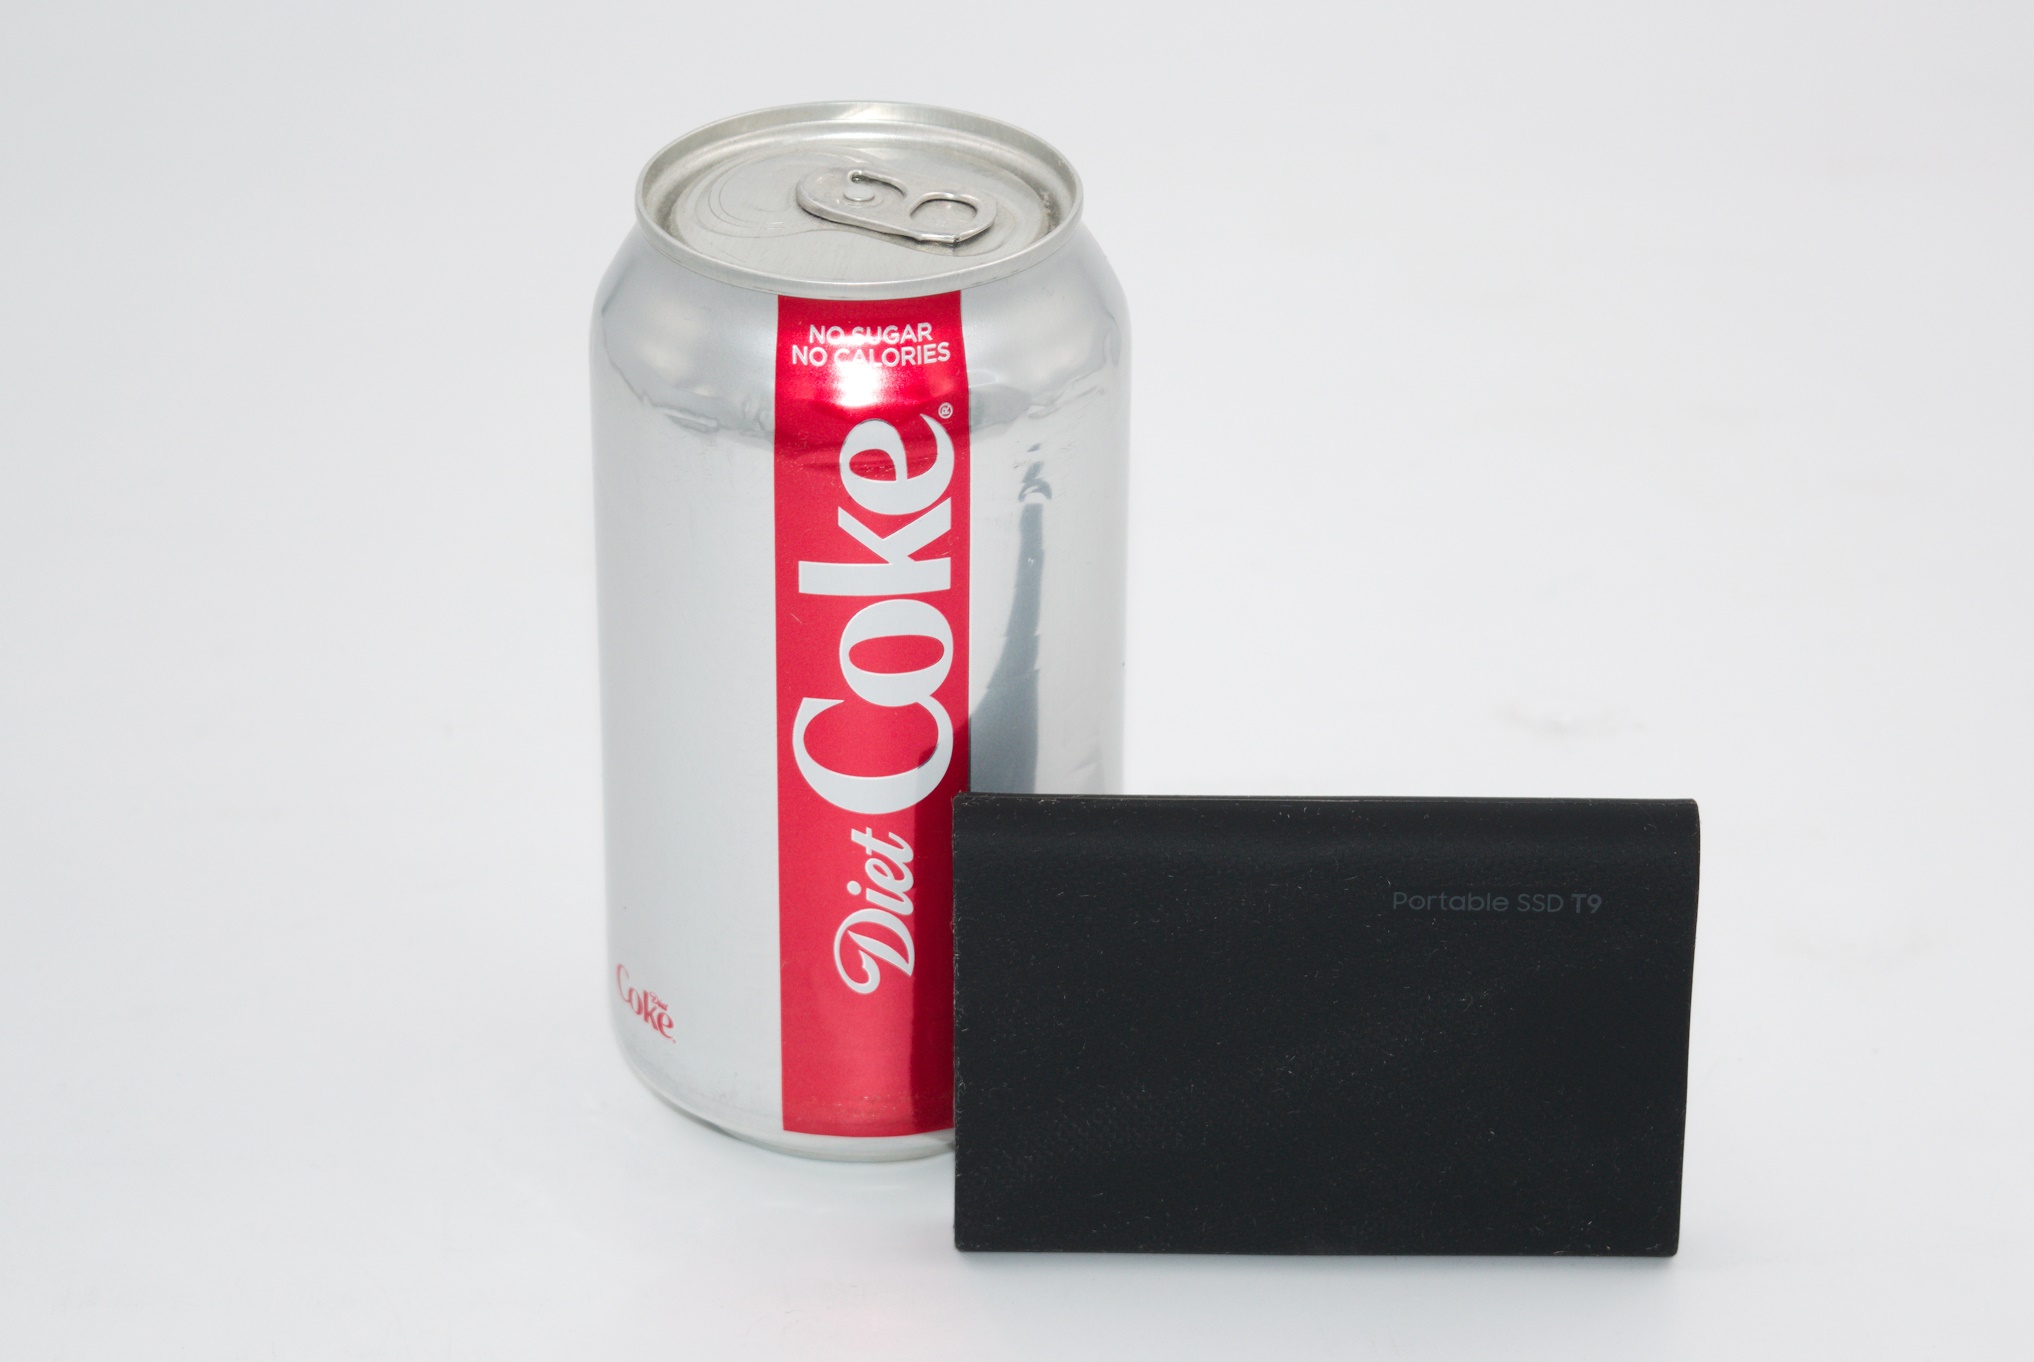
The Samsung Portable SSD T9 is a valuable addition to the company’s T series lineup. It retains the sleek and attractive form-factor of its predecessors, and also adds some ruggedness with its re-designed rubber sleeve. Subjectively speaking, the new sleeve with its carbon pattern design is more functional and provides a solid feel in the hand compared to the T7 Shield.
The T9’s pseudo-SLC cache size of around 175 GB is more than enough for most consumers, and likely for a large number of prosumers too. It needs to be noted that a USB 3.2 Gen 2×2 host is needed to take full benefit of the PSSD’s performance. However, thanks to USB’s backward compatibility, the T9 can be used with a wide variety of systems – including those with just USB 2.0 ports.
Samsung is also releasing a new version of their Magician software this month. The new version unifies the product maintenance aspect for a range of internal SSDs, memory cards, and PSSDs as well. This will also include data migration support, counterfeit checking capabilities, and the ability to set a password for the drive (and take advantage of the hardware encryption capabilities).
Compared to the Samsung X5, the T9 is able to perform reasonably well across our entire test suite. The launch pricing is a bit out of touch with market reality (given the price of the 20 Gbps PSSDs from Samsung’s competitors). Pricing the T9 4 TB version around $300 would have resulted in a much better value proposition. As it stands, the performance of the T9 is passable given its DRAM-less nature. Had Samsung opted for a DRAM-equipped NVMe SSD component with the latest NAND instead of retaining the one from the T7 Shield, the T9 could have even be in the competition for the performance crown.