Introduction
In the early days of computing, the computational capability of a microprocessor was often described using IPC (instructions per cycle), which measures how many instructions a processor can complete in a single clock cycle. Early client processors were single-issue, meaning they could issue at most one instruction per cycle. As a result, IPC was capped at 1, and in practice was frequently lower due to pipeline stalls, branch penalties, and memory latency.
This limitation changed with the introduction of superscalar processors, such as the Intel Pentium, which were capable of issuing multiple instructions per cycle under favorable conditions.
An intuitive way to understand this is to imagine an assembly line that, at best, can produce one widget per second. As long as every stage of the line operates perfectly—without errors or interruptions—the throughput remains one widget per second. Any disruption at any stage, however, reduces the effective throughput below this theoretical maximum.
The Pentium represented a major breakthrough because, under certain conditions—specifically when two instructions could be executed simultaneously while remaining in program order—it could achieve more than one instruction per cycle. Extending the analogy, this is similar to adding a second assembly line: even if one of the lines experiences frequent errors, the system can still produce more than one widget per second overall.
The P6 architecture (Pentium Pro) extended this concept further by increasing the number of execution “assembly lines” (making the core wider) and introducing out-of-order execution. This allowed steps in the assembly process to be performed in a different order than originally specified, as long as the final result remained correct. By dynamically reordering work, all assembly lines could be kept more fully occupied, increasing overall throughput.
As processor cores became wider over time and out-of-order execution grew more sophisticated, the concept of IPC alone became increasingly inadequate as a measure of performance. A more useful way to describe compute efficiency is throughput per cycle—that is, how much useful work the CPU, along with its memory subsystem and supporting components, can perform per clock cycle when running real applications.
Purpose
The purpose of this investigation is to compare the single-threaded (ST) throughput per cycle of modern client processors running 64-bit Windows, using standardized benchmark workloads as a proxy for real-world application performance.
Benchmarks
The following four benchmarks were selected to determine a throughput-per-cycle metric for the tested processors. Each benchmark was chosen because it emphasizes different aspects of single-threaded CPU behavior, providing a more representative measure of overall compute efficiency than any single test alone. Of course, no benchmark is perfect but I have found these benchmarks to be precise (return ~same scores run-after-run) and ubiquitous, which is nice because we have a “gut” feeling about how they translate to our use cases. The most important aspect of this investigation is getting consistent results.
The benchmarks used in this investigation are:
Geekbench 6.5 (Single-Thread)
Geekbench 6 was selected because it represents a broad mix of real-world workloads, including integer, floating-point, and memory-related tasks. Its short, diverse subtests make it a useful proxy for general application responsiveness and front-end efficiency.
Cinebench 2026 (Single-Core and Single-Thread tests) and/or Cinebench R23
Cinebench 2026 measures sustained single-threaded performance using a ray-tracing workload. It places significant emphasis on floating-point and vector execution and provides insight into a processor’s ability to sustain throughput under continuous computational load. If your processor will only run R23 then just run that one. If it will run both then please submit both scores.
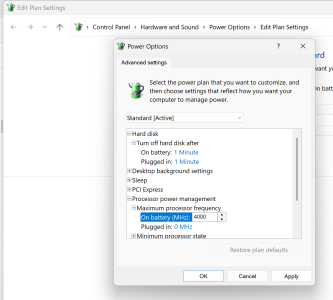
7-Zip 25.01 (x64, Single Thread, run as close to 4.7GHz as possible, explanation for this request below)
The 7-Zip benchmark was included due to its heavy reliance on integer operations, branching behavior, and cache efficiency. When run in 64-bit mode, it minimizes legacy architectural constraints and highlights core execution efficiency in integer-dominated workloads.
7-Zip using a 32MB dictionary size as in this test will “blow through” the L3 cache for most systems and rely heavily on main memory access. As the CPU and main memory frequency discrepency grow larger and larger the CPU will be starved for data and MIPS/GHz will decrease. To keep the CPUs on a relatively level playing field let’s try to keep the CPU frequency for this one around 4.7GHz is possible to keep this test more compute and less main memory stressor.
CPU-Z
CPU-Z’s benchmark is a FP32 math test using SSE instructions. It does not leverage SSE’s vector math capability with the exception of some 128-bit memory accesses. Most SSE instructions are scalar FP32 adds, multiplies, conversions, or compares. The long average instruction length could mean frontend throughput gets restricted by 16 byte per cycle L1 instruction cache bandwidth on older Intel CPUs. However, that limitation can be mitigated by op caches, and is only an issue if the execution engine can reach high enough IPC for frontend throughput to matter. CPU-Z benchmark has a typical mix of memory accesses. Branches are less common in CPU-Z than in games, compression, and Cinebench 2024. (From Chips and Cheese).
Procedure
For each processor, all benchmarks were run in a 64-bit Windows environment using their respective single-threaded test modes. The operating frequency observed during each benchmark run was recorded, and benchmark scores were normalized by frequency to produce a throughput-per-cycle value. The individual normalized results were then combined to form a composite measure of single-threaded compute efficiency.
Both the Single-Thread (ST) and Single-Core (SC) tests in Cinebench were executed to evaluate the effect of simultaneous multithreading (SMT) or hyper-threading (HT), when supported by the processor under test.
Since we are only running single thread benchmarks, the CPU should run very close to the top turbo or boost rated frequency for your CPU, but of them may run one or two hundred MHZ below that rating. Please have HWinfo open so you can watch the core frequency as the benchmark runs. You are looking for the highest current frequency and it might bounce around from core-to-core. For example, my HX370 has a boost frequency of 5.1GHz but in these benches average 4.9 or 5GHz. On the other hand, my 9950X holds a consistent 5.7GHz on all benchmarks.
Geekbench 6.5, Cinebench 2026, Cinebench R23, and HWinfo can be downloaded from their respective sites.
I have zipped up the correct versions of 7-Zip (25.01 x64) and CPUz (2.18.0 64 bit version) and you can download them at the link below. Both are portable and will not install anything on your computer.
Results
The benchmark results were compiled into a table for comparison. To enable cross-architecture evaluation, all benchmark scores were normalized relative to the Intel Skylake core, which was used as the baseline reference. Each benchmark score was first converted to a throughput-per-cycle value and then expressed as a ratio relative to the Skylake baseline.
The normalized results were combined into a single composite score using a weighted geometric mean. The weighting applied to each benchmark was as follows:
- Geekbench 6.5 – 40%
- Cinebench 2026 or/and R23 – 30%
- 7-Zip – 20%
- CPU-Z – 10%
These weightings were selected to balance general-purpose application behavior, sustained floating-point performance, and integer-focused execution characteristics while preventing any single benchmark from disproportionately influencing the final composite score.