
Intel NUC11TNBi5 and Akasa Newton TN Fanless Case Review: Silencing the Tiger
2022-07-22Intel’s Tiger Lake-based NUCs have been shipping for well over a year now. Four product lines were planned initially – Panther Canyon for the mainstream market, Tiger Canyon for the professional / business market, Phantom Canyon for gaming enthusiasts, and the Elk Bay Compute Element for embedded applications. Supply chain challenges have been impacting availability of different models in different regions, but that has not prevented Intel’s partners from delivering complementary products.
Akasa is a well-known manufacturer of thermal solutions for computing systems targeting industrial applications as well as home consumers. They have been maintaining a lineup of passively-cooled cases for Intel’s NUCs since 2013. We had reviewed their Turing case for the Bean Canyon NUC a couple of years back, and come away pleasantly surprised. Not often do we see a fanless case managing to keep the processor cooler than an actively-cooled solution for the same workload, but that is exactly what the Akasa Turing achieved. For Intel’s Tiger Canyon NUCs, Akasa carries three main products – Newton TN, Plato TN, and Turing TN. The company sampled us the Newton TN for review with Intel’s sample of the NUC11TNKi5.
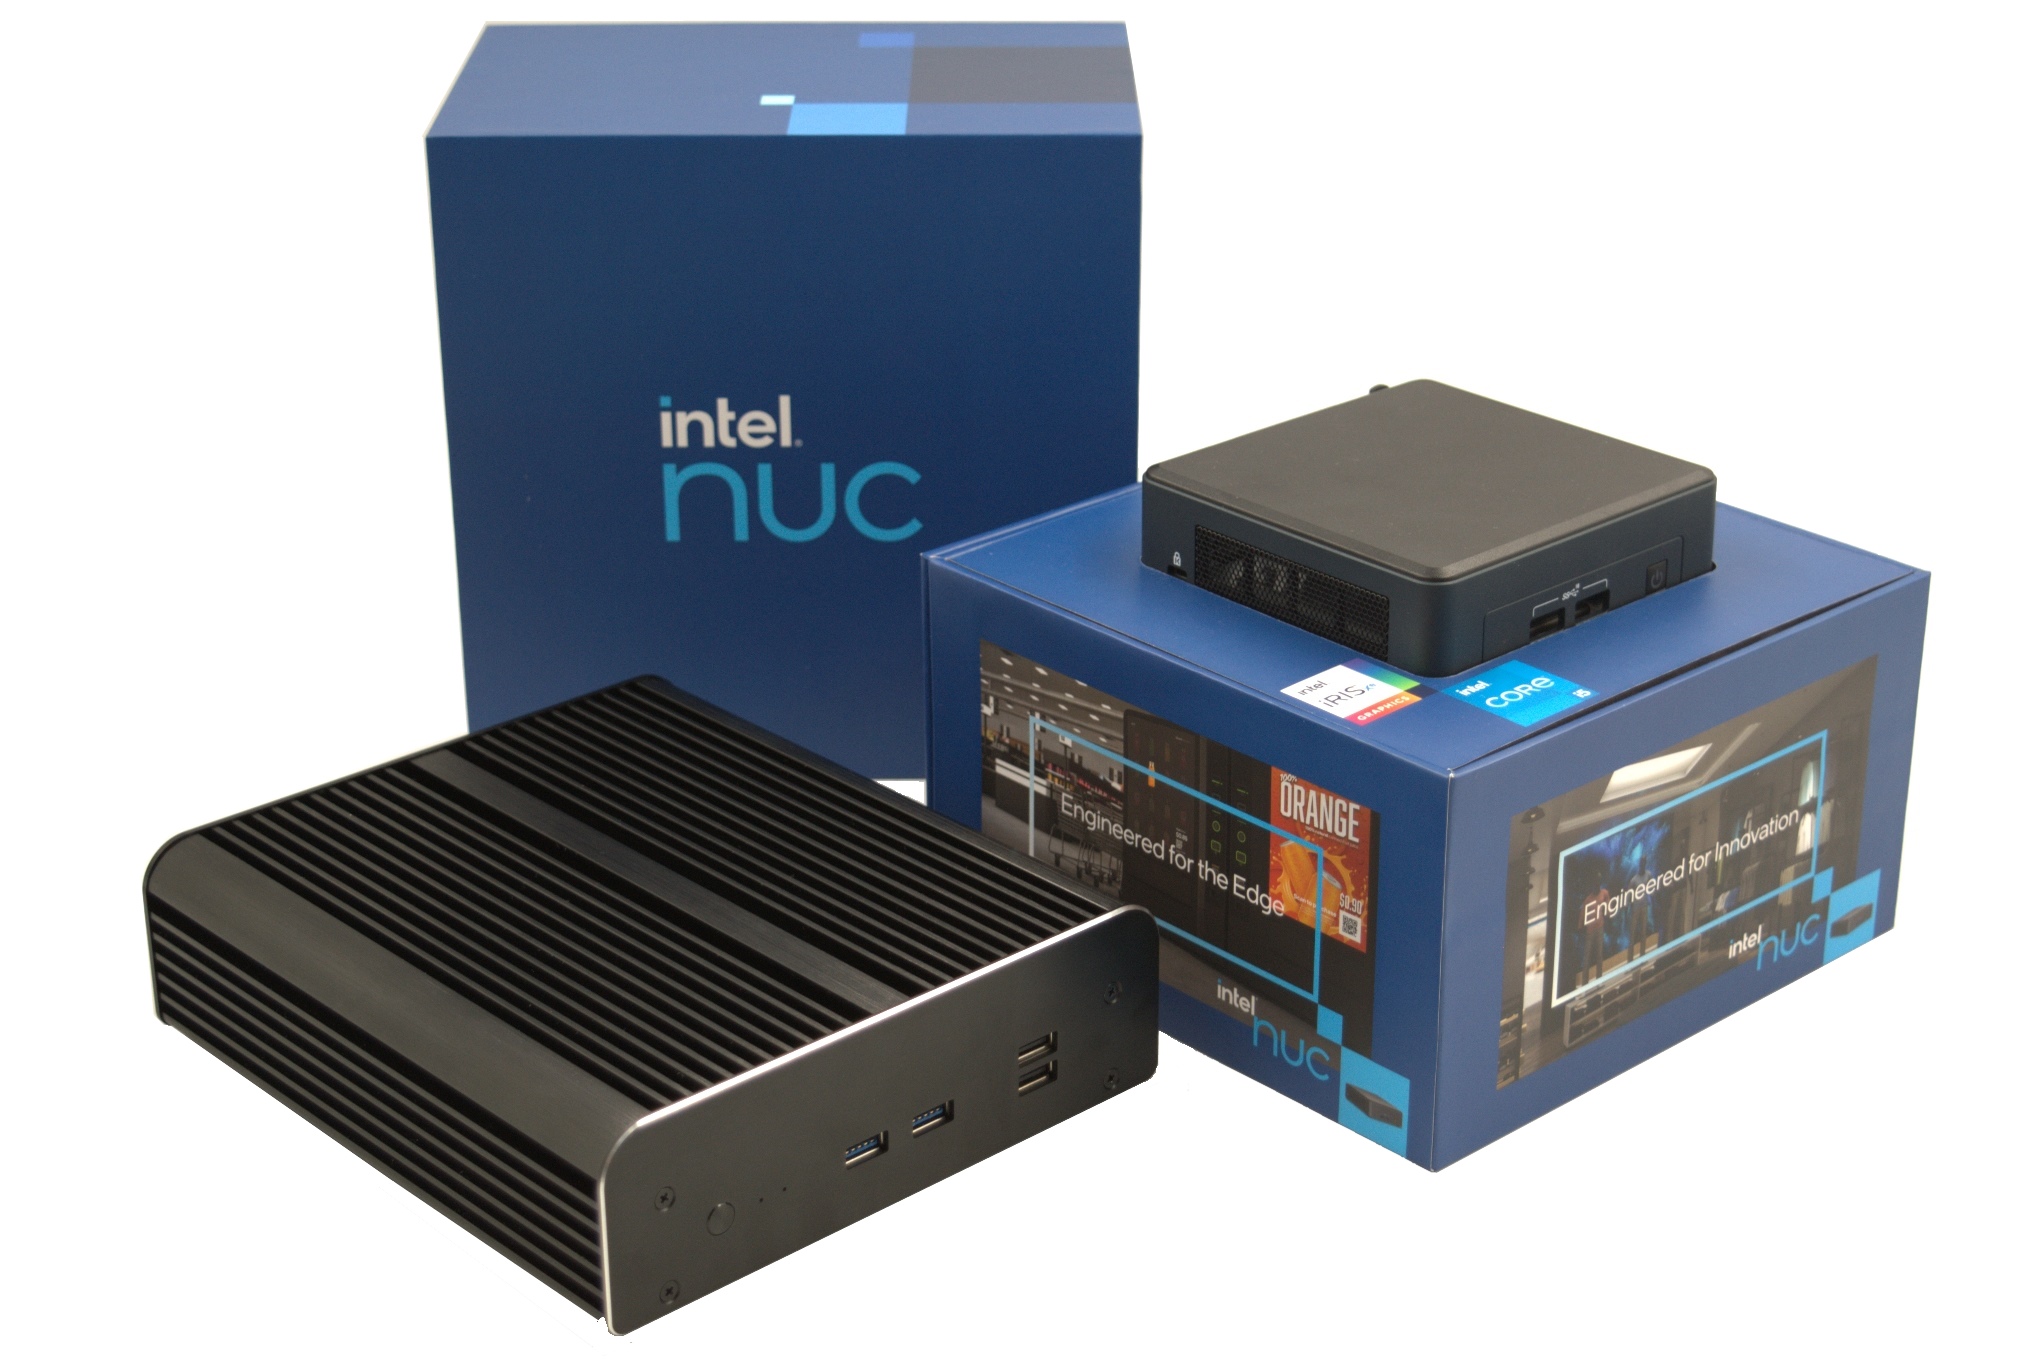
On the Tiger Lake UCFF front, we had reviewed only a couple of systems – the ASRock Industrial NUC BOX-1165G7 last year, and more recently, the Supermicro SYS-E100-12T-H. We took the Akasa Newton TN review opportunity to also perform a detailed evaluation of Intel’s own offering – the NUC11TNKi5 Tiger Canyon NUC. The review below introduces the Tiger Canyon NUC hardware and details the build process for its fanless version using the Akasa Newton TN before going into the usual platform analysis. Following this, the benchmark numbers for the passively cooled configuration are compared against the original NUC11TNKi5 (along with a host of other systems). Finally, results from the thermal evaluation of the fanless system are presented. Together, these provide an idea of what Tiger Lake can deliver in a reasonably compact fanless system and also whether the Newton TN manages to replicate the success of the Turing.
Intel’s Tiger Lake processors brought the Willow Cove microarchitecture fabricated in a reasonably mature 10nm process to the market last year. The focus was mainly on the mobile market, but the company did launch a suite of mini-PCs based on them last year. The company segments the Tiger Lake-based mini-PCs them into different categories – Performance, Pro, Enthusiast, and Extreme. The NUC11 Pro Kit NUC11TNKi5 (Tiger Canyon) we are looking at today is a UCFF solution that places a 100mm x 100mm motherboard inside a 117mm x 112mm x 37mm chassis. The board comes with a soldered processor – the Core i5-1135G7. Belonging to the Tiger Lake-U family, it can operate over a range of configurable TDPs – from 12W to 28W. The NUC’s default BIOS settings set the PL1 (sustained) and PL2 (burst mode) levels to 28W and 64W respectively, with the PL1 Time Window set to 28 seconds.
End-users have the flexibility to choose their own storage device and RAM. For best performance, a PCIe 4.0 x4 NVMe SSD can be used, and DDR4-3200 SODIMMs are supported. Our NUC11TNKi5 sample came with the following components pre-installed:
- Samsung SSD 980 PRO PCIe 4.0 x4 NVMe SSD
- 2x Kingston ValueRAM KVR32S22D8/16 DDR4-3200 SODIMM for 32GB of DRAM
The system is actively cooled, with a blower fan on the underside, away from the side of the motherboard with the SODIMM and M.2 slots.
The specifications of our Intel NUC11TNKi5 review configuration are summarized in the table below.
| Intel NUC11TNKi5 / NUC11TNBi5 + Akasa Newton TN Specifications (as tested) |
|
| Processor | Intel Core i5-1135G7 Tiger Lake 4C/8T, 2.4 – 4.2 GHz Intel 10nm SuperFin, 8MB L2, 28W (PL1 = 28W, PL2 = 64W) |
| Memory | Kingston ValueRAM KVR32S22D8/16 DDR4-3200 SODIMM 22-22-22-52 @ 3200 MHz 2×16 GB |
| Graphics | Intel Iris Xe Graphics (80EU @ 1.30 GHz) |
| Disk Drive(s) | Samsung 980 PRO MZ-V8P500B/AM (2500 GB; M.2 2280 PCIe 4.0 x4 NVMe;) (1xxL V-NAND Gen 6 3D TLC; Samsung Elpis S4LV003 Controller) |
| Networking | 1x 2.5 GbE RJ-45 (Intel I225-LM) Intel Wi-Fi 6 AX201 (2×2 802.11ax – 2.4 Gbps) |
| Audio | Digital Audio with Bitstreaming Support over HDMI Ports |
| Video | 2x HDMI 2.0b 2x Display Port 1.4a with HBR3 over Thunderbolt |
| Miscellaneous I/O Ports | 2x USB 3.2 Gen 2 Type-A (Front) 1x USB 3.2 Gen 2 Type-A (Rear) 1x USB 2.0 Type-A (Rear) 1x Thunderbolt 4 + 1x Thunderbolt 3 (Type-C) (Rear) |
| Operating System | Windows 11 Enterprise (22000.739) |
| Pricing | (Street Pricing on July 21st, 2022) $420 (Board) + $150 (Case) + $130 (RAM) + $95 (SSD) = $795 (as configured, no OS) |
| Full Specifications | Intel NUC11TNBi5 Specifications Akasa Newton TN Specifications |
The NUC package includes the usual VESA mount and screws along with an integration guide. A region-specific power cord accompanies the 120W (19V @ 6.32A) adapter.
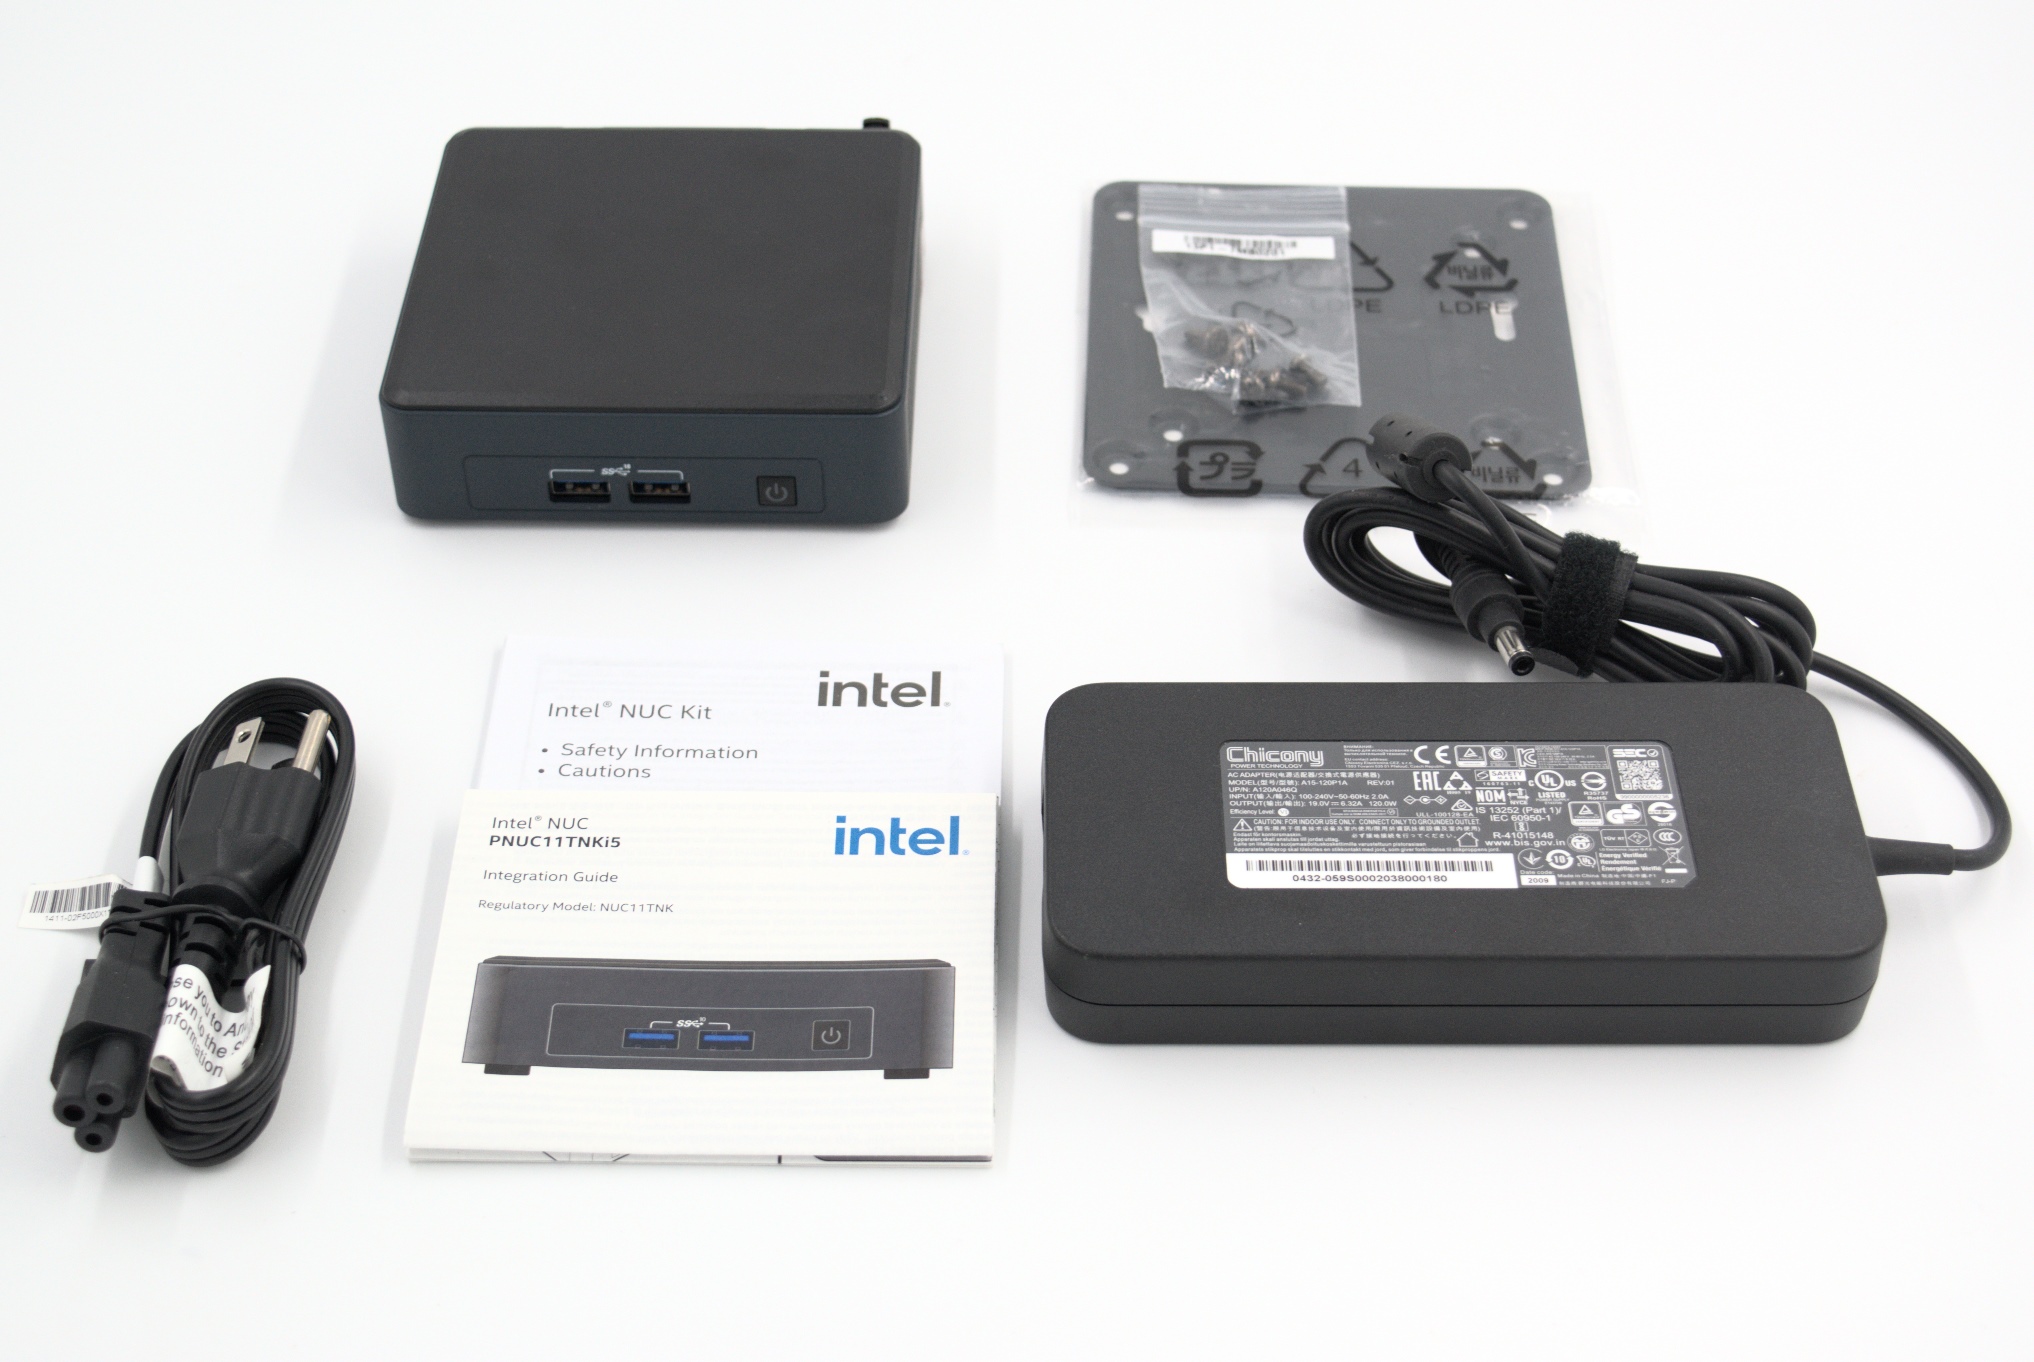
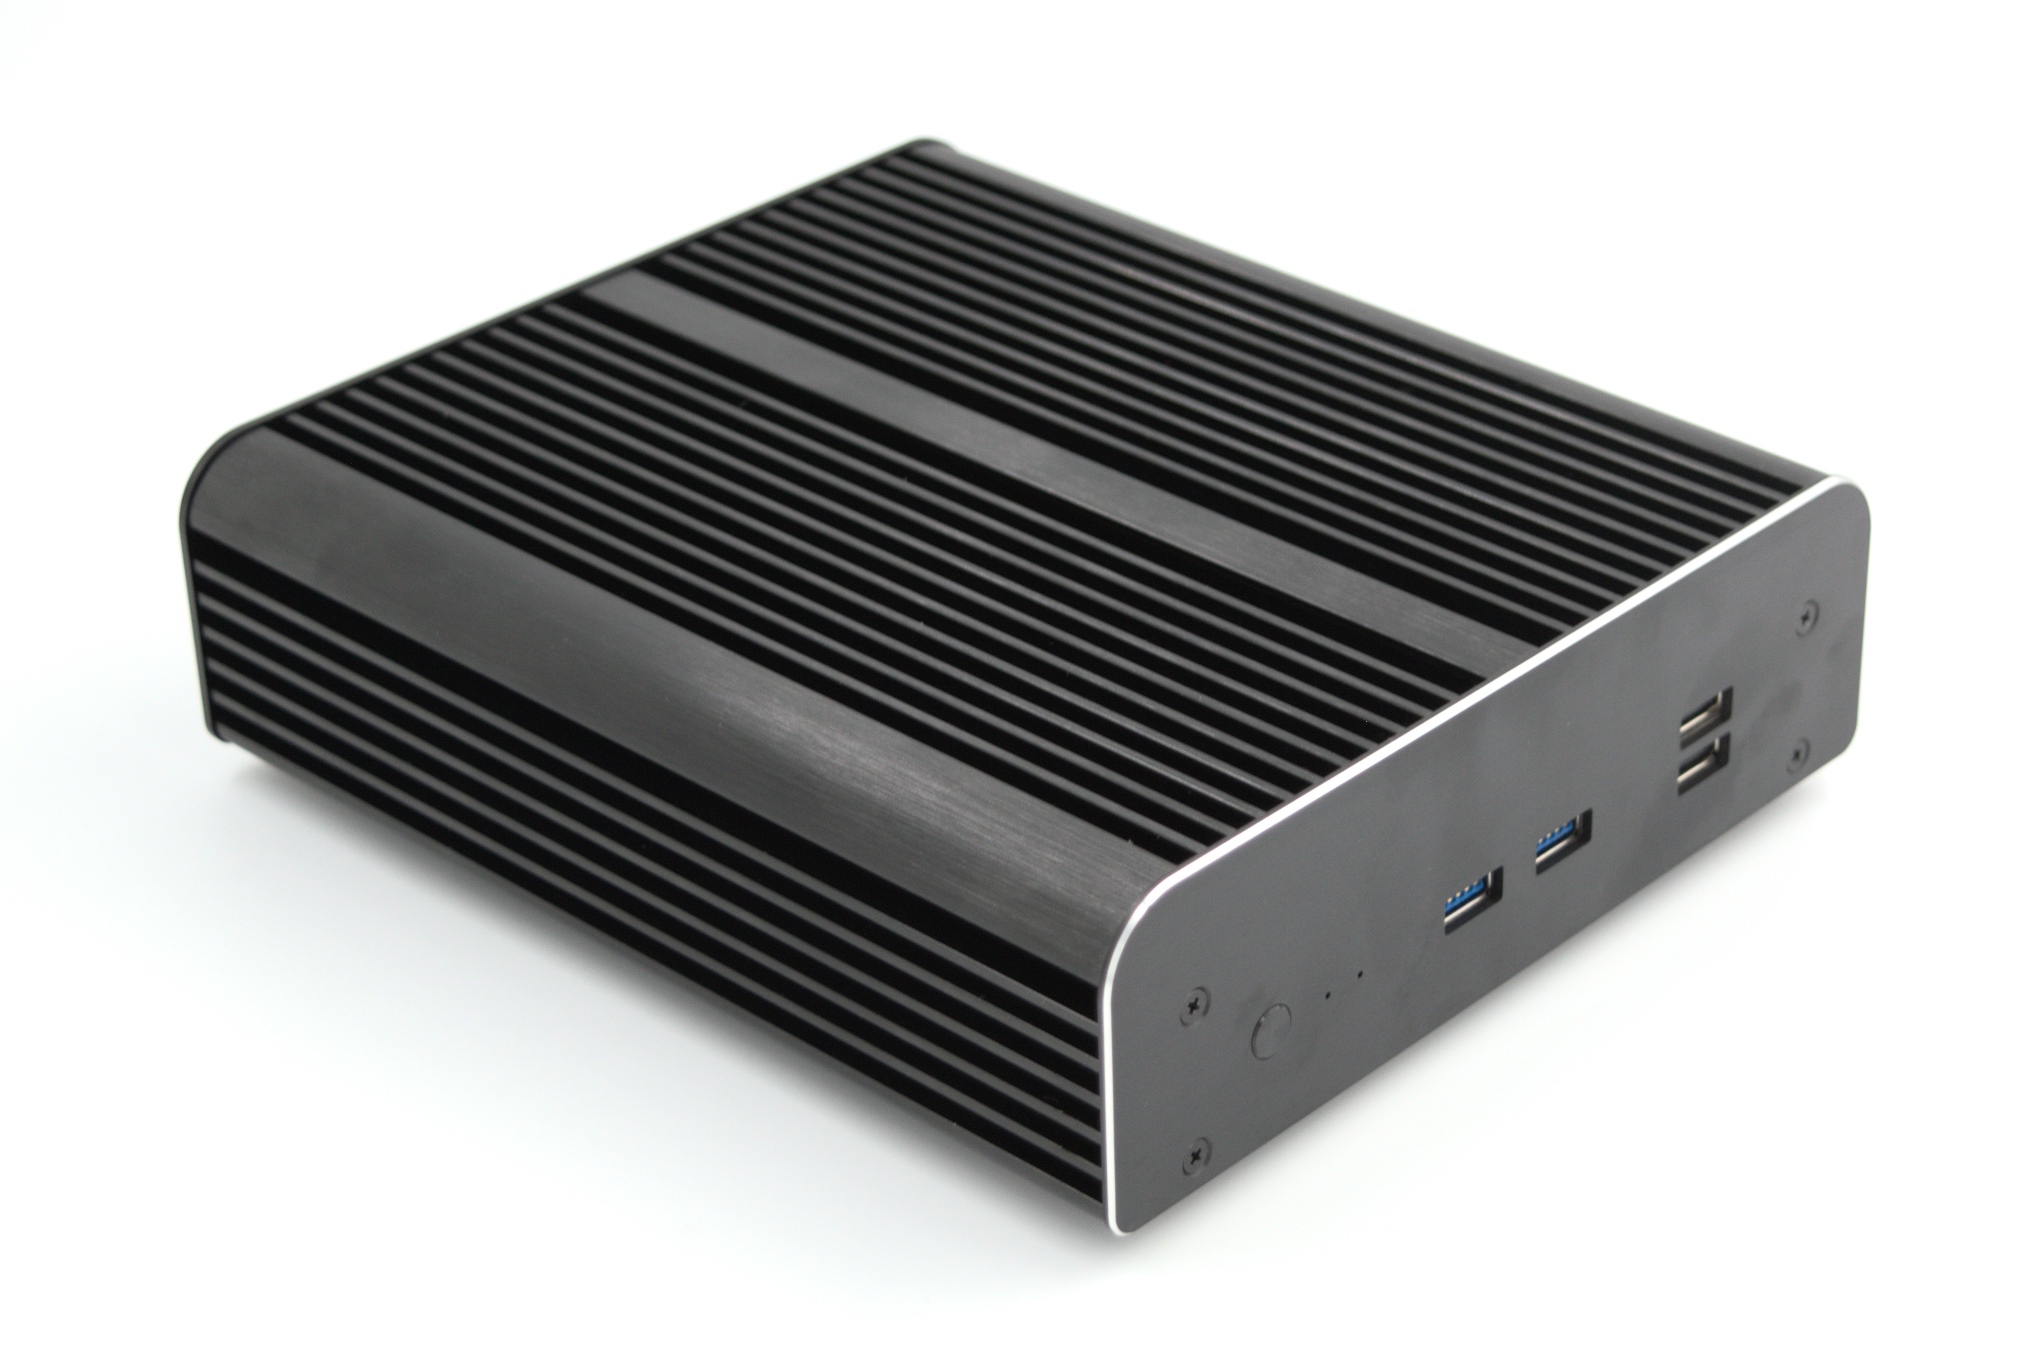
The gallery below provides an overview of the kit’s chassis and the I/O distribution. The key differences when compared to the Performance line of Tiger Lake NUCs (Panther Canyon) are the absence of a SDXC card reader, a HDMI 2.0b port instead of a mini-DP port, an extra USB 3.2 Gen 2 Type-A port in the front panel, and the restriction of Thunderbolt Type-C ports only to the rear panel.


Compared to the Performance line, the NUC11 Pro line adds official support for Linux and Window IoT, supports operation over a wider DC input voltage range, has an extra internal SSD slot (M.2 2242 SATA / PCIe 3.0 x1), vPro capabilities in select SKUs, and a longer product life cycle.
The standard NUC11TNKi5 kit above can be used in most scenarios, but there may be use-cases that require the complete absence of any moving parts. In industrial deployments, the reason may be the need to avoid performance loss due to cooling efficiency degradation resulting from dust build-up. For professional creators, it may be due to the need to avoid extraneous noise affecting the work output. The average home consumer may also prefer a silent system to better focus on the work at hand. For HTPCs, multimedia content can be enjoyed without distractions – an aspect that may be of paramount importance to audiophiles.
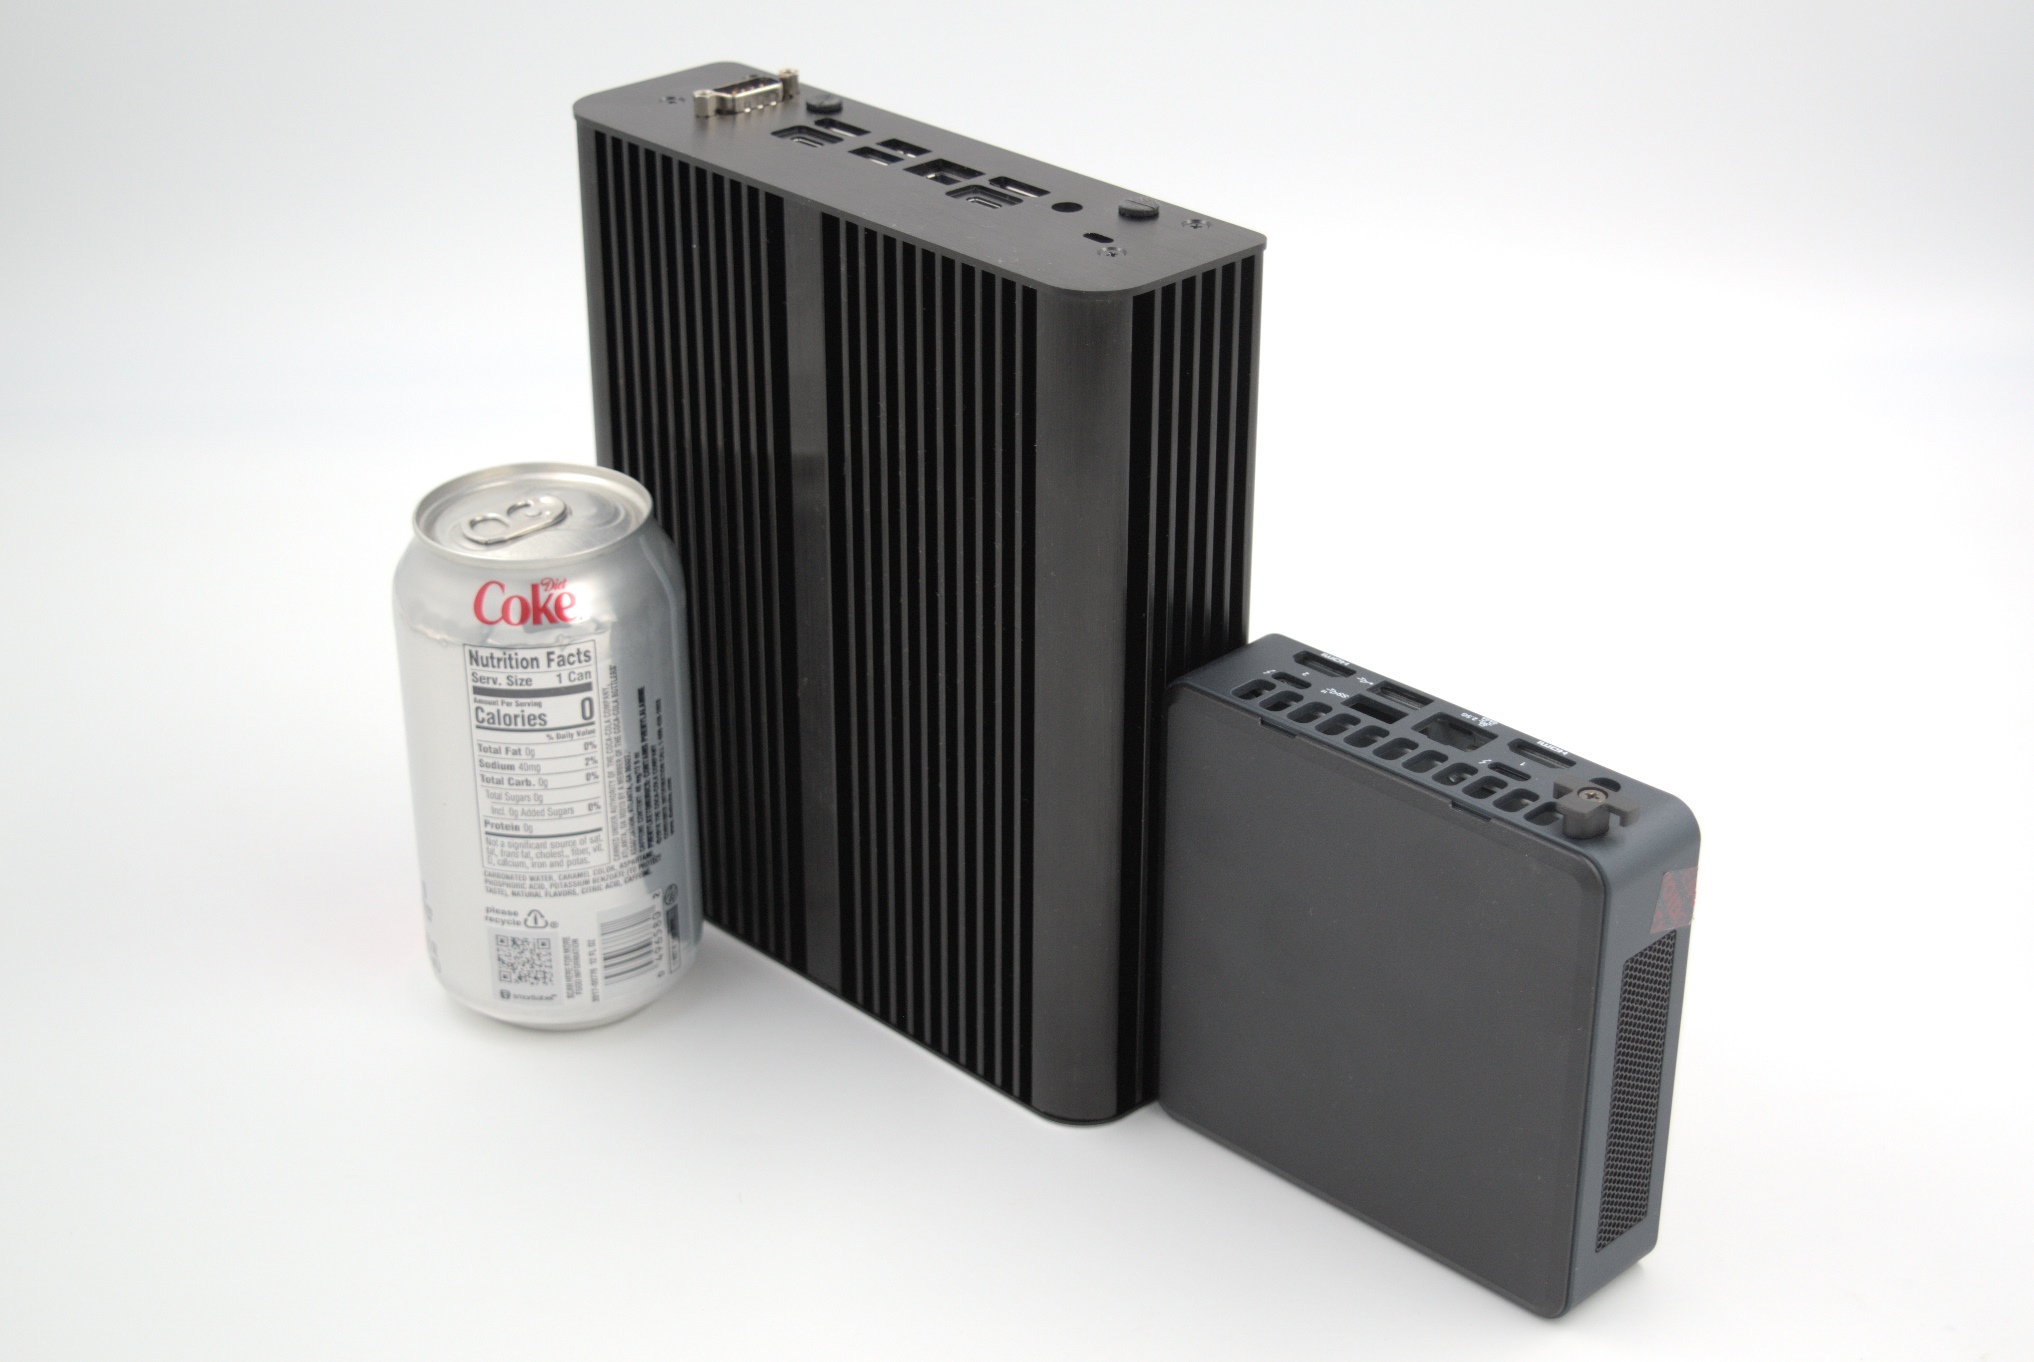
Traditionally, passively cooled computing systems have either been woefully underpowered for general purpose use, or carried a significant premium in terms of both cost and physical footprint. However, advancements in compute performance per watt and novel passive cooling chassis designs (that do not cost an arm and a leg to mass-produce) have combined to give consumers the ability to create powerful, yet affordable, fanless systems. This is where vendors like Akasa come in. For the NUC11TNBi5 (the board inside the NUC11TNKi5 kit), Akasa has three different cases, with dimensions that can satisfy virtually any deployment scenario:
- Newton TN [ 176.6mm x 200mm x 53.6mm ]
- Plato TN [ 247mm x 240mm x 38.5mm ]
- Turing TN [ 95mm x 113.5mm x 247.9mm ]
We put the standard kit through our benchmarking process first. Following that, we disassembled the unit, and transferred the board to the Akasa Newton TN. The same benchmarks were processed again on the Newton build.
Prior to analyzing the NUC11 platform and looking at the comparative specifications of the considered systems, we take a deep dive into the build process using the Akasa Newton TN.
The Akasa Newton TN comes in a nondescript brown box, with the only indicator of the contents being the small barcode sticker with the A-NUC63-M1B moniker on the side. The contents include the main chassis (which doubles up as the heat sink) and an user manual with installation instructions. The standoffs for the i7 Tiger Canyon NUCs come pre-mounted inside the main chassis. The i3 and i5 boards require these to be replaced with slightly different ones that are explicitly marked as being meant for this purpose. The pictures below bring out the miscellaneous components bundled in the package.
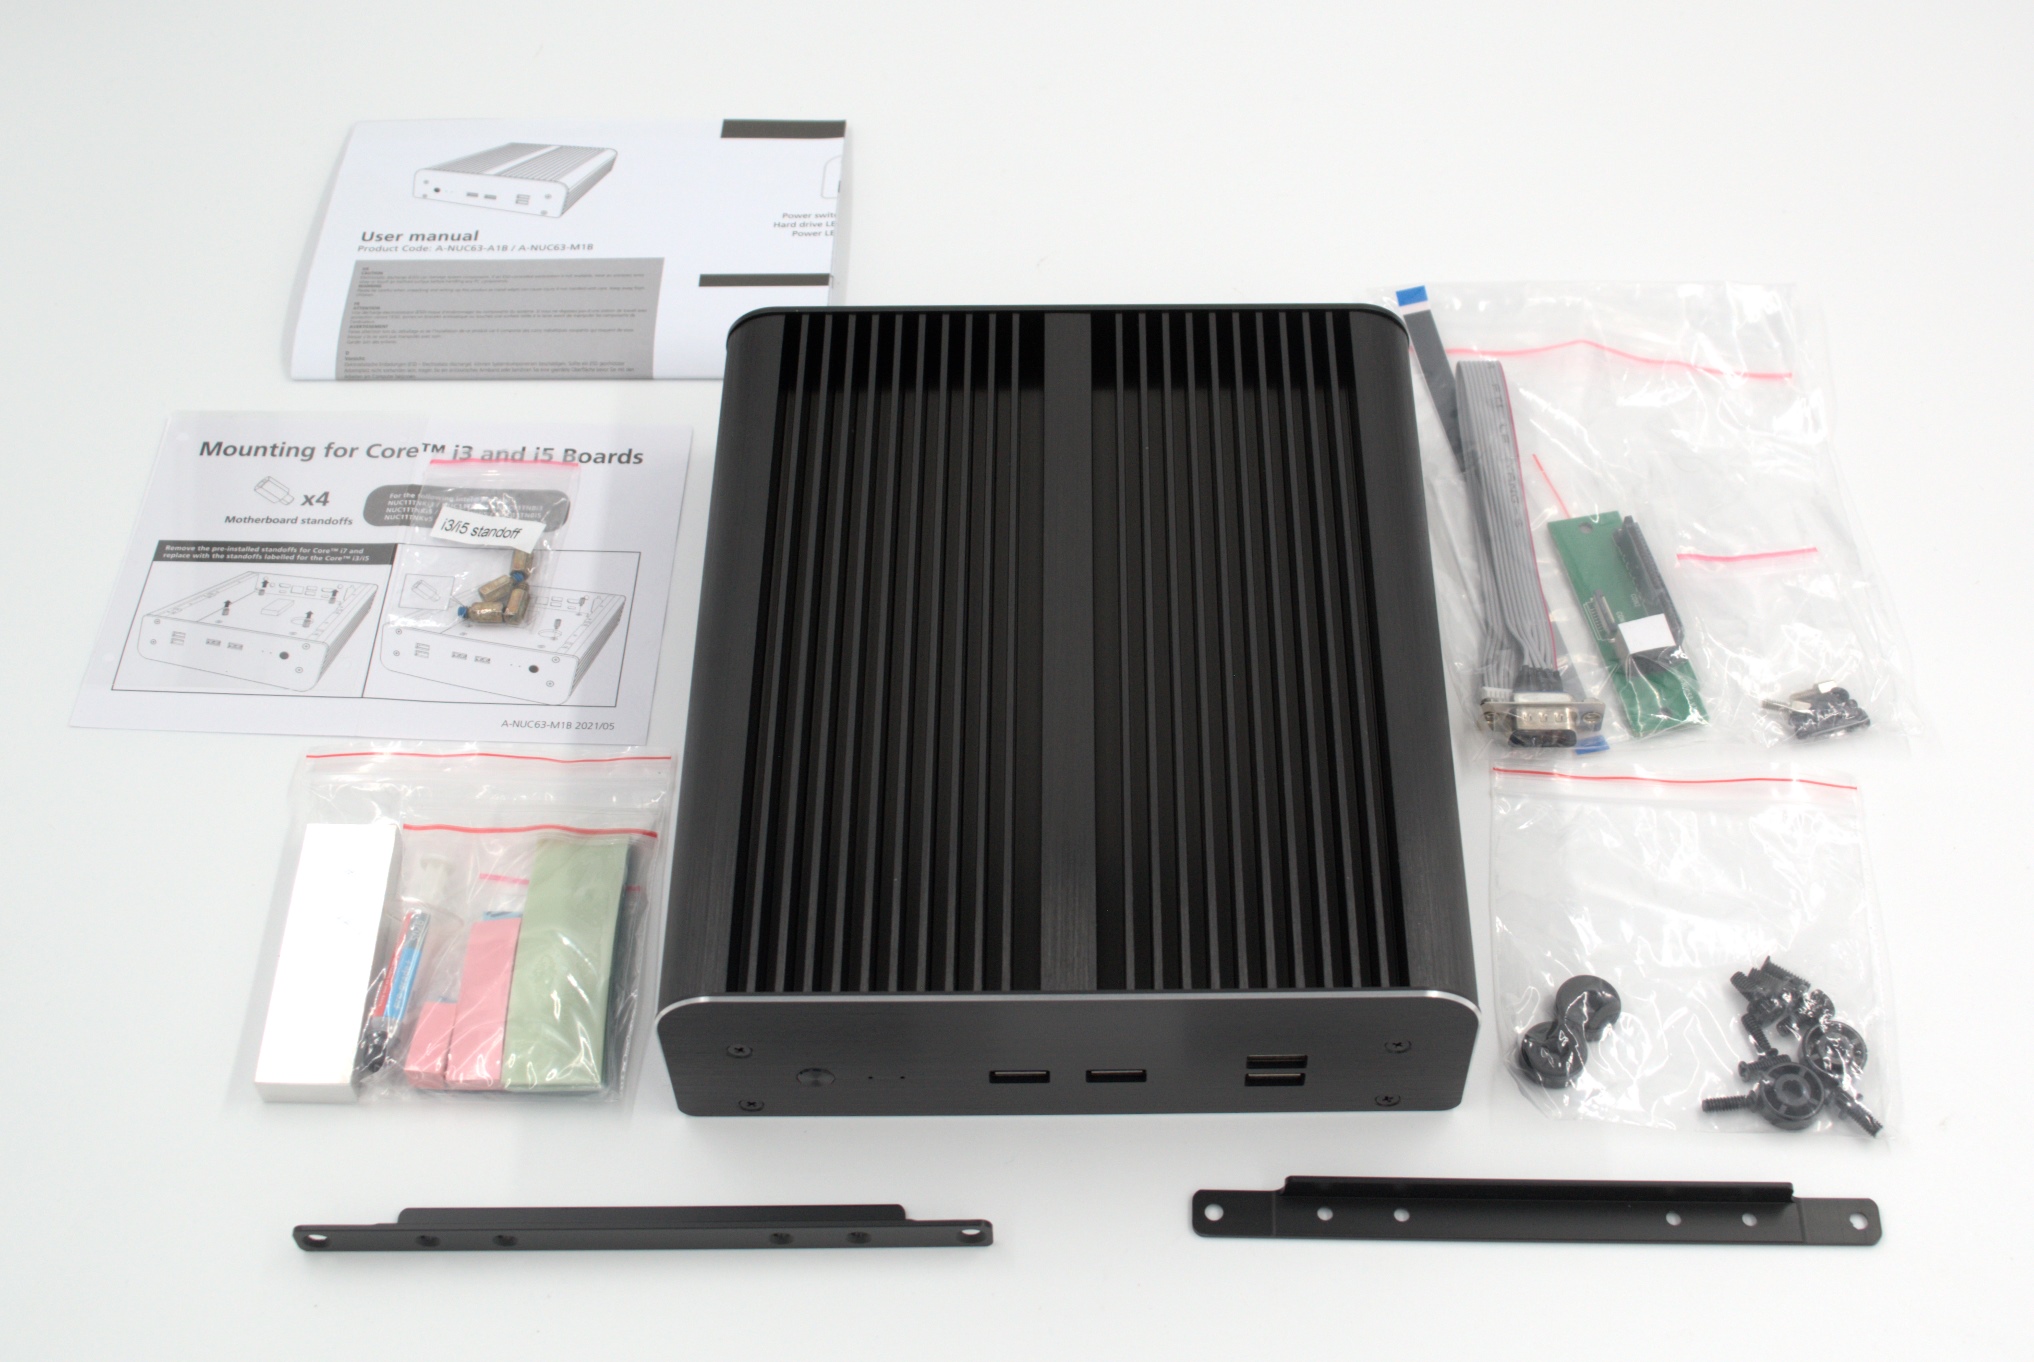

Starting from the top left corner in the above picture, we have:
- Akasa AK-TC5026 pro-grade+ thermal paste with a thermal conductivity of 2.9 W/mK.
- Thermal gap fillers to ensure contact between the VRM circuitry and the chassis / heatsink.
- Screws and washers to connect the motherboard and the standoffs
- EMI gaskets for mounting on the HDMI port receptacles
- Thermal gap filler pads and metal block (thermal module) to form the cooling solution for the M.2 2280 SSD
- Serial cable and mounting screws
- 2.5″ drive mounting screws, mounting bracket, and transparent protective film for the drive
- SATA adapter board and cable to adapt data + power connector on board to the 2.5″ drive’s interface
- Screws to mount the 2.5″ drive bracket to the chassis
- VESA mounting screws
- Case feet and associated screws
The gallery below includes photographs of the chassis from various angles. We see the front, bottom, and rear panels getting connected to the main chassis using screws that come pre-mounted. The core structure of the heat sink is evident at first look, with ridges / fins running all along the length of the unit. The middle segment is much thicker than the rest, and the long edges have a pleasing curvature (unlike the Turing). This design makes it much easier to handle the case without risking accidental cuts in one’s hands and fingers. The ridges run along the sides of the case also. The underside of the case is completely flat and has the panel that can be unscrewed to install the motherboard.


The cut-outs in the front and rear of the main chassis tally with the I/O ports of the standard kit. However, Akasa has included a cut-out for a serial port in the rear panel and two USB 2.0 ports in the front panel.

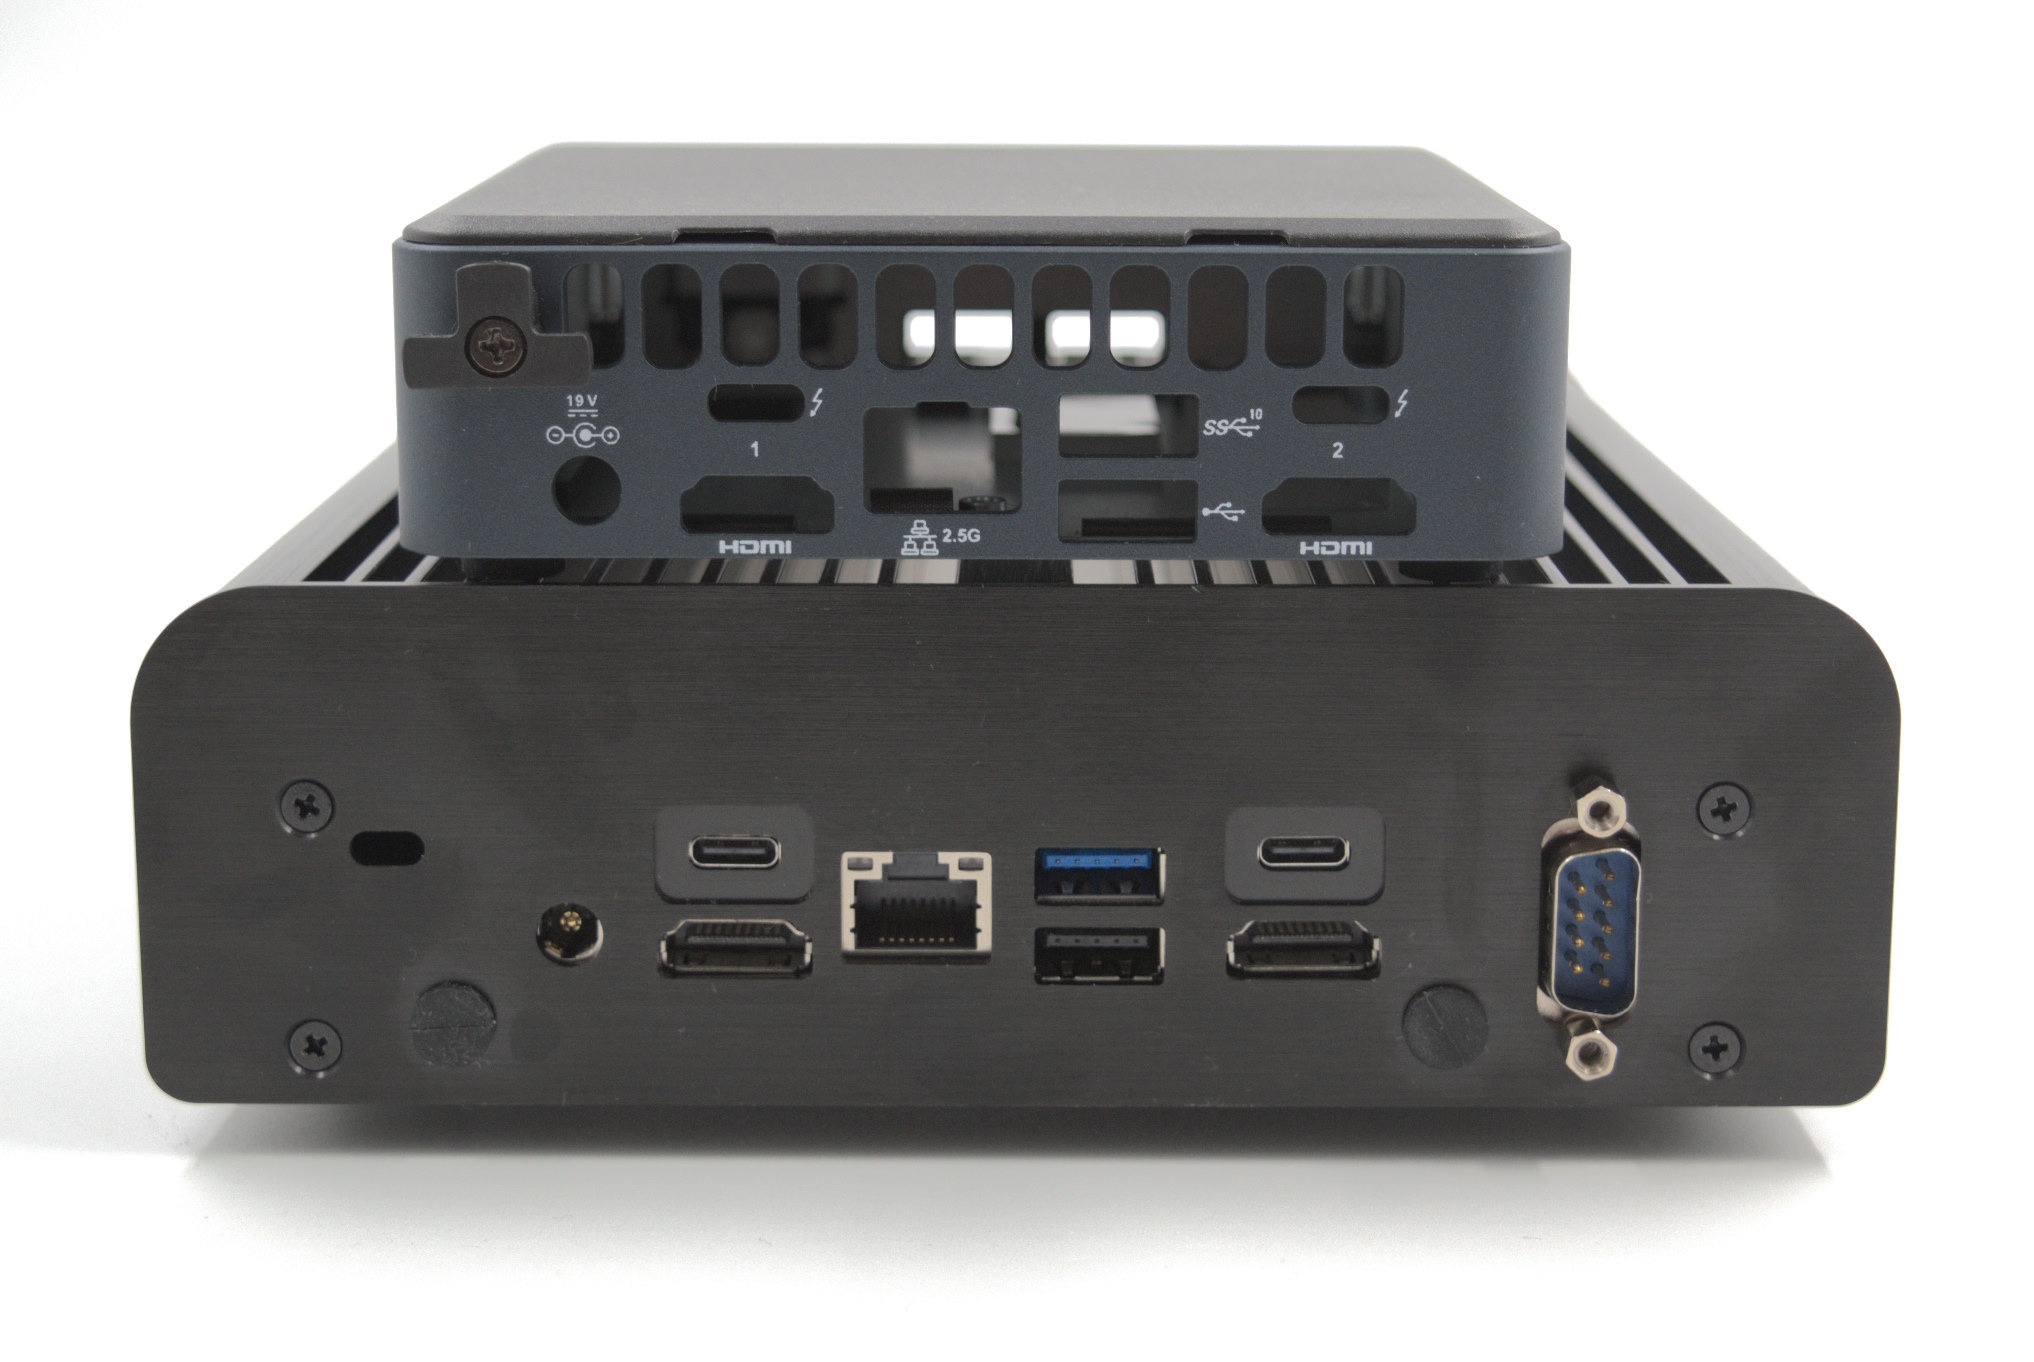
These functionalities are already present in the NUC11TNBi5 boards, but the standard kit keeps them unused. This is yet another advantage of the Newton over the corresponding Turing (whose I/O is restricted to what is provided by the standard kit). It should also be noted that the Thunderbolt Type-C ports in the Newton TN are slightly recessed, but that presented no issues even with ‘bulky’ Type-C devices like the Kingston DataTraveler Max (notorious for its width blocking nearby ports when connected to the system). The rear panel also has two antennae mounting holes for optional usage. By default, they are covered with push-in bumpers.
Unless one is starting off with the board version of the NUC, the standard NUC kit first needs to be subject to a teardown before starting the assembly with the Akasa Newton TN. The gallery below pictorially presents the teardown steps for the NUC11TNKi5.


The first step involves the removal of the kit’s bottom panel. This reveals the thermal pads attached to the metal underside in order to cool down the M.2 drives, but that is not of concern in this particular task. The installed RAM and SSD are dismounted, with the holding screws retained in the standoffs for future use. Two screws that hold the board in place towards the rear I/O are taken out and kept aside safely. The main part is then turned around and the top panel removed by carefully pushing in the plastic tabs around the perimeter and pulling it up. The plastic frame and the inner metal enclosure are joined by four screws that are exposed after the top panel’s removal. Once those screws are out of the picture, the motherboard can be gently prised out. The blower fan and the thermal gap filler across the exit’s copper fins can be seen after pulling out the board and turning it around. In order to completely yank out the board, it is necessary to remove the pigtail antennae from the WLAN card. The antennae are attached to the inner metal frame, and can be safely stored for use elsewhere.
The next set of steps in the gallery below pictorially depicts the preparation of the motherboard for installation in the Newton TN chassis.


The blower fan is attached to the flat heat pipes and metal heat spreader by two screws and to the board itself using the fan power connector. The heat spreader itself is mounted using screws with holders at the corner of the Tiger Lake-U (TGL-U) package. Removal of the thermal solution assembly reveals the two dice (CPU and PCH) in the package bathed in thermal paste. The old thermal compound can be completely wiped away with the aid of rubbing alcohol.
The gallery below presents the preparation of the Newton TN chassis for the installation of the board prepared above. Unlike the Turing, only the bottom panel needs to be unscrewed. Inside the case, we see Akasa using three separate boards for servicing the front panel’s features. A black wire set originates from the small board with the two USB 2.0 ports. This wire set terminates in two USB 2.0 header connectors. The two USB 3.2 Gen 2 Type-A ports are enabled by two USB 3.2 Gen 2 Type-A Male-to-Female adapter cables. The female end is permanently affixed to the second board. At the other end of the front panel boards set is the front panel header connector controlling the power switch as well as the power and drive activity LEDs. There is also a round recessed slot for the CMOS battery to slot it.


As mentioned in passing earlier in this section, the pre-mounted standoffs inside the case are meant for the i7 board. A lineman’s pliers was used to remove the pre-installed ones, and the supplied Core i3/i5 standoffs were slotted in place. Between the standoffs, a solid raised metal block is in place to connect the TGL-U SiP to the rest of the massive heat sink doubling up as the chassis.
A pictorial representation of the remaining steps in the installation of the board in the Newton TN chassis is provided in the gallery below. Prior to placing the board inside the case, the thermal gap fillers are mounted on the VRM circuitry (inductors and MOSFETs) in a manner similar to how the original heat spreader assembly covered them. The supplied thermal compound is applied liberally over the two dice in the TGL-U package. The area meant for the board installation inside the chassis is cleared of wires, and the board is then placed upside down on the raised metal block – with the thermal compound-bathed package right on top of it, and the rear I/O elements aligned to the rear panel’s cut-outs. Four specific screws with the red washers help secure the board to the standoffs installed earlier in the process. Unlike the Turing / Bean Canyon combo, there is no DMIC to worry about in this setup. However, the cables from the front panel boards need to be connected to the motherboard. Keeping the NUC11TN technical reference manual handy is helpful here to determine the locations of the front panel header and the USB 2.0 headers on the board (or, one can just take a look at the last picture in the gallery below). A bit of nifty cable management is necessary here, because the 2.5″ drive assembly goes right on top of these cables and wires.


The Turing / Bean Canyon combo reviewed by us did not have any specific thermal solution for the NVMe SSD – but, having chosen a low-power WD SN500 in that build, we got away scot-free. The Newton TN, unfortunately, can’t get away easily because the Tiger Canyon board includes support for a PCIe 4.0 x4 NVMe SSD (and most of them are notorious heat generators). Akasa has tried to address that aspect with a specific M.2 thermal solution – a metal block and two thermal gap filling pads. The plastic films covering either side of the thermal gap fillers were removed at the appropriate time during the installation process in the gallery below.


After placing the Samsung SSD 980 PRO in the slot, we placed the first thermal gap filling pad on top of the label, and the other pad across the metal block. The metal block was then positioned on top of the SSD + gap filler combination. The final plastic film on top was removed just prior to screwing in the bottom panel. The serial port adjacent to the SSD slot is connected to the serial cable, which is then mounted using screws slotting in from the outside to hold the serial port in place.
Our build does not utilize any 2.5″ drive, but we still did a dry run of installing one just to get an idea of the steps involved in the process. The steps are brought out in the gallery below. The connector board is readied by attaching the flexible SATA connector cable carrying both power and data to it. In parallel, the 2.5″ drive is attached to the mounting bracket with the protective film in place to prevent direct contact between the drive and the bracket at the connecting points. The SATA connector board is attached to the SSD, while the flexible connector cable’s other end slots into the SATA port behind the M.2 2242 slot. The bracket is them attached to the main chassis, running right on top of the USB Type-A cables, as shown in the gallery below.


The final set of steps in the assembly process relate to the re-attachment of the bottom panel. Users expecting to VESA mount the system can use the same screws that held the panel in place originally. For flat placement, Akasa supplies case feet with appropriate screws that slot into the same holes. We opted for the latter configuration, as shown in the gallery above.
Overall, the build process was quite smooth – in fact, much easier compared to the Akasa Turing because of the space available inside the case. Folks used to building PCs from scratch will find it quite easy, while less experience folks can easily get by with the installation manual and detailed write-ups similar to the one above. The supplied manual assumes that users are starting off with the NUC11TNBxx boards, and does not include disassembly instructions for the original kit. We have addressed that in the above description.
Our review sample of the Intel NUC11TNKi5 came with all necessary components pre-installed, and we carried them over to the Newton TN build – we only had to load up the OS to start our evaluation process. Prior to that, we took some time to look into the BIOS interface. The video below presents the entire gamut of available options for the Tiger Canyon NUC.
Your browser does not support HTML video.
Intel’s mini-PCs have the most comprehensive and configurable UEFI / BIOS among all the ones that we have evaluated over the last several years. The Tiger Canyon NUC is no exception. The home screen shows the BIOS version, processor details, and installed memory capacity and speed right away – this is of great help in checking whether the installed SODIMMs are operating at the desired speeds. Under the ‘Advanced’ section, we have options to enable various SATA and M.2 NVMe ports, and disable the disk activity LED if needed. Different USB ports and headers can be selectively enabled or disabled. iSCSI volumes can be mounted in the boot stage, and the network settings can be configured for network boot when needed. The HDMI / DisplayPort audio can be disabled, if necessary. Thunderbolt support is also controllable via the BIOS, as are a bunch of other features.
One of the most useful features in the lineup of Intel NUCs targeting the professional / business use-cases is the display emulation option under ‘Advanced > Video’. This is useful for scenarios involving headless operation and digital signage installations, as it allows set up of a virtual display when no display is connected (virtual display emulation), or makes the OS think that a previously connected display is still connected to the display output (persistent display emulation).
The ‘Cooling’ section provides an overview of current temperatures and fan speeds, and allows fine grained control of the fan operation – including the sensors to which it responds, and the temperatures at which different actions need to trigger. In the ‘Performance’ section, users can control hyperthreading support, selectively enable or disable cores, and control various performance options like Turbo Boos and SpeedStep. The memory timings can also be finely controlled. Various password options including TCG Opal configuration can be activated from the ‘Security’ section. Virtualization support and VT-d are also enabled or disabled from this section.
The ‘Power’ section allows users to optimize the system for balanced performance, or low power operation, or for maximum performance. In the last case, Intel’s Dynamic Power Technology can also be configured for energy efficiency. Further customization is possible by allowing for different sustained and burst mode package power limits (PL1 and PL2), as well as the package power time window. Secondary power settings allow for configuration of LED behavior in different sleep states, as well as allowing support for waking up via different peripheral interfaces. PCIe ASPM support is also controllable from this section. The ‘Boot’ section allows configuration of secure boot, boot priorities, POST screen configuration, etc. A boot override option here is probably the only update we would like in the BIOS – a shortcut to rebooting and pressing F10 repeatedly in order to choose a temporary boot device.
Intel’s documentation provides a block diagram for the Tiger Canyon NUC board. It gives insights into the distribution of high-speed I/O lanes.
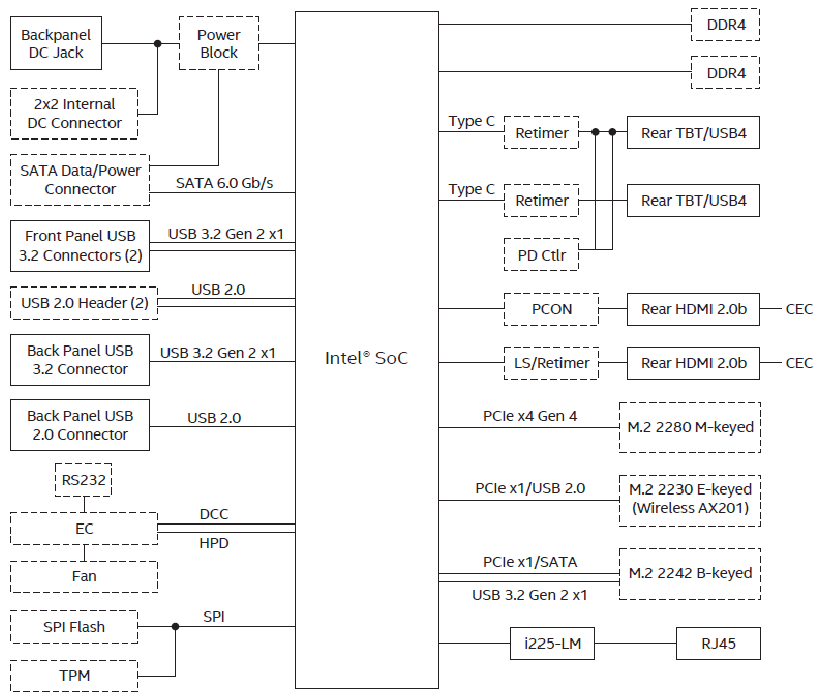
The PCIe 4.0 x4 lanes servicing the M.2 NVMe SSD and the two Thunderbolt 4 ports are directly off the processor die. A single PCIe 3.0 x1 lane from the Tiger Point-LP PCH is used to connect the Intel I225-LM controller. The AX201 WLAN controller hooks up via the CNVi interface in the PCH. The front USB 3.2 Gen 2 ports are from the processor, while the USB 2.0 and USB 3.2 Gen 2 ports in the rear are from the PCH.
In addition to the comparison between the actively-cooled and passively-cooled versions of the NUC11TNBi5, we also consider some of the other passively cooled PCs reviewed earlier, as well as a few other recent UCFF systems. In the table below, we have an overview of the various systems that we are comparing.
| Comparative PC Configurations | ||
| Aspect | Intel NUC11TNBi5 (Akasa Newton TN) | |
| CPU | Intel Core i5-1135G7 Tiger Lake 4C/8T, 2.4 – 4.2 GHz Intel 10nm SuperFin, 8MB L2, 28W (PL1 = 28W, PL2 = 64W) |
Intel Core i5-1135G7 Tiger Lake 4C/8T, 2.4 – 4.2 GHz Intel 10nm SuperFin, 8MB L2, 28W (PL1 = 28W, PL2 = 64W) |
| GPU | Intel Iris Xe Graphics (80EU @ 1.30 GHz) |
Intel Iris Xe Graphics (80EU @ 1.30 GHz) |
| RAM | Kingston 9905744-035.A00G DDR4-3200 SODIMM 22-22-22-52 @ 3200 MHz 2×16 GB |
Kingston 9905744-035.A00G DDR4-3200 SODIMM 22-22-22-52 @ 3200 MHz 2×16 GB |
| Storage | Samsung 980 PRO MZ-V8P500B/AM (2500 GB; M.2 2280 PCIe 4.0 x4 NVMe;) (1xxL V-NAND Gen 6 3D TLC; Samsung Elpis S4LV003 Controller) |
Samsung 980 PRO MZ-V8P500B/AM (2500 GB; M.2 2280 PCIe 4.0 x4 NVMe;) (1xxL V-NAND Gen 6 3D TLC; Samsung Elpis S4LV003 Controller) |
| Wi-Fi | 1x 2.5 GbE RJ-45 (Intel I225-LM) Intel Wi-Fi 6 AX201 (2×2 802.11ax – 2.4 Gbps) |
1x 2.5 GbE RJ-45 (Intel I225-LM) Intel Wi-Fi 6 AX201 (2×2 802.11ax – 2.4 Gbps) |
| Price (in USD, when built) | (Street Pricing on June 6th, 2022) US $440 + $150 + $130 + $95 = $815 (as configured, no OS) |
(Street Pricing on June 6th, 2022) US $440 + $150 + $130 + $95 = $815 (as configured, no OS) |
The NUC11TNKi5 and the NUC11TNBi5 (Akasa Newton TN) share the same configuration except for the pricing. The ASUS PN51-E1 slots in as a comparison point for what a mid-range Renoir can deliver (since we are comparing against a mid-range TGL-U part). It is a relevant comparison point for the NUC11TNKi5 from a price viewpoint, given they are both actively cooled. The ASUS PN50 and ASRock Industrial 4X4 BOX-4800U make up the high-end actively-cooled Renoir systems.
We also have results from a recent re-benchmarking session of the ASRock Industriall NUC BOX-1165G7. It uses the latest BIOS (P1.40), but modifies the default options to better reflect usage in a home / business scenario (ASRock Industrial stated that they had optimized the BIOS defaults for industrial deployment). ‘Advanced > CPU Configuration > CPU Operation Mode’ was changed from default ‘Normal Mode’ (PL1 = 28W / PL2 = 28W) to ‘Performance Mode’ (PL1 = 38W / PL2 = 55W), ‘Advanced > CPU Configuration > CPU C-States Support’ was changed from default ‘Disabled’ to ‘Enabled’, ‘CPU C States Support > Enhanced Halt State (C1E)’ set to ‘Enabled’, ‘CPU C States Support > Package C State Support’ set to ‘Auto’, and ‘CPU C States Support > CFG Lock’ left at ‘Disabled’.
The OnLogic HX500 is a representation for Intel’s previous generation in a fanless avatar. Even though it utilizes a desktop CPU with a 35W TDP, it makes sense to include it in the comparisons as Tiger Lake-U includes fine-grained power management with boosts up to 64W to make it competitive against real desktop CPUs.
The Akasa Turing / Bean Canyon configuration is also included in the benchmarks to identify improvements that consumers can see for similarly priced systems when upgrading after a couple of generations. Results from a Core i5 Comet Lake-U system (the Minisforum UM850) are also included. Finally, we have Supermicro’s SM-E100-12T-H – another TGL-U representation, albeit at a much lower package power limit.
Our 2022 test suite for Windows 11-based systems carries over some of the standard benchmarks we have been using over the last several years, including UL’s PCMark and BAPCo’s SYSmark. Starting this year, we are also including BAPCo’s CrossMark multi-platform benchmarking tool.
PCMark 10
UL’s PCMark 10 evaluates computing systems for various usage scenarios (generic / essential tasks such as web browsing and starting up applications, productivity tasks such as editing spreadsheets and documents, gaming, and digital content creation). We benchmarked select PCs with the PCMark 10 Extended profile and recorded the scores for various scenarios. These scores are heavily influenced by the CPU and GPU in the system, though the RAM and storage device also play a part. The power plan was set to Balanced for all the PCs while processing the PCMark 10 benchmark.
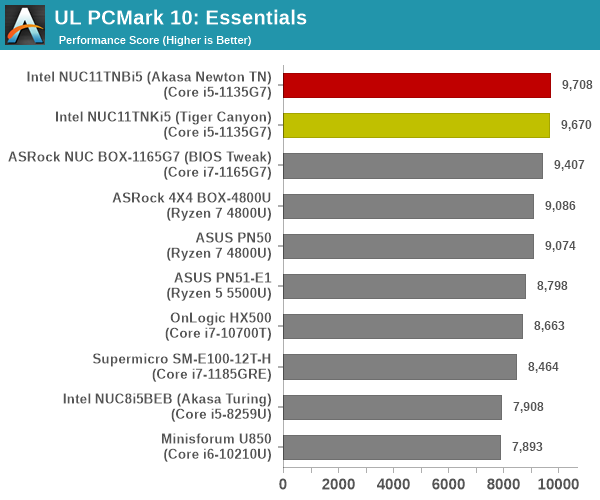
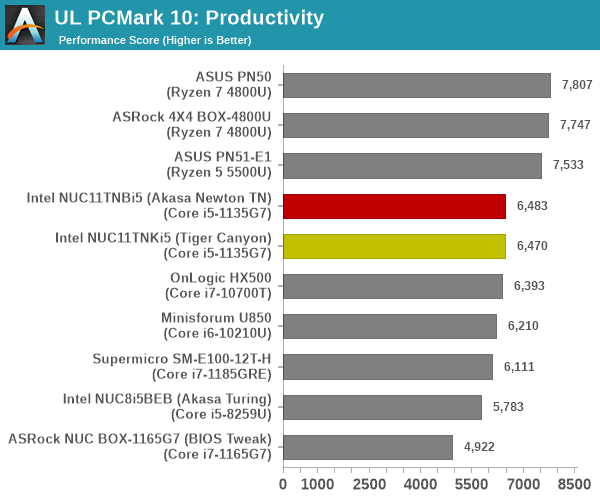
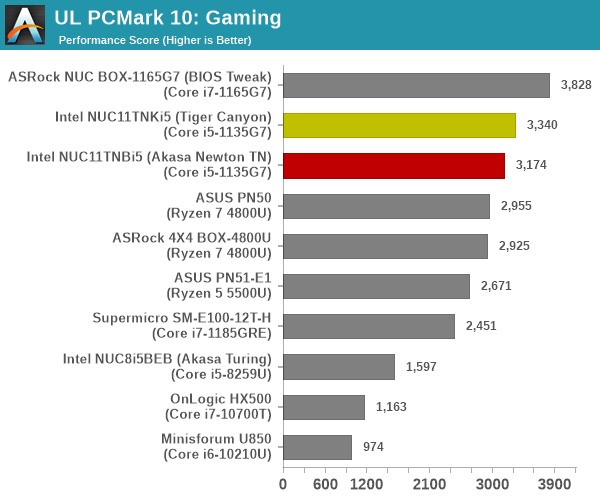
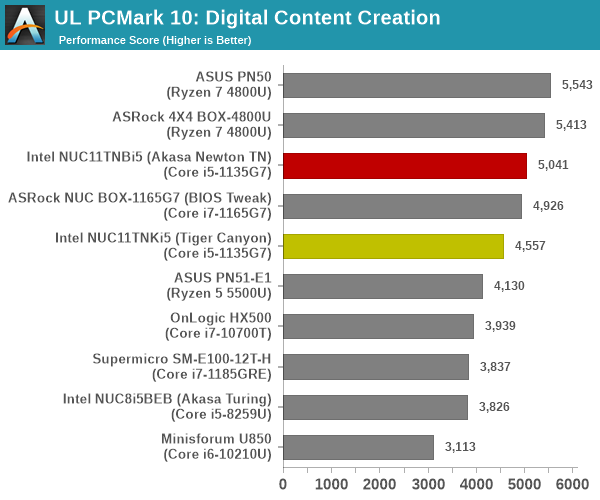
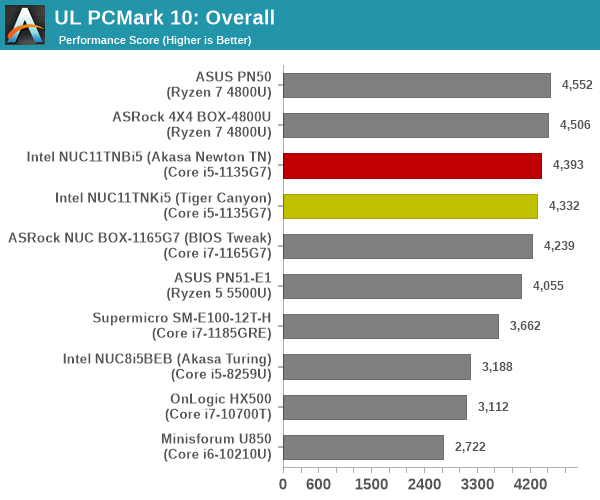
The ‘Essentials’ workload score is dictated by single-threaded burst performance, and the Tiger Lake-U systems take up the top three spots. However, the ‘Productivity’ and ‘Digital Content Creation’ workloads seem to appreciate larger number of cores. The octa-core Renoir systems come out on top, and even the hexa-core equipped ASUS PN51-E1 leapfrogs the Tiger Lake-U systems in the ‘Productivity’ workload. For the ‘Gaming’ workload, the TGL-U systems with the new Iris Xe iGPU is able to surpass Renoir. The iGPU in the TGL-U Core i7 in the ASRock Industrial NUC BOX-1165G7 enjoys a healthy lead over the competition. Overall, though, the octa-core Renoir-equipped UCFF PCs get a slight edge over the mid-range TGL-U configuration in the NUC11TNBi5. Another key takeaway here is that the scores for the actively-cooled and passively-cooled versions are pretty much similar, lending credence to the possibility of Akasa having pulled off another excellent offering in the Newton TN.
BAPCo SYSmark 25
BAPCo’s SYSmark 25 is an application-based benchmark that uses real-world applications to replay usage patterns of business users in the areas of productivity, creativity, and responsiveness. The ‘Productivity Scenario’ covers office-centric activities including word processing, spreadsheet usage, financial analysis, software development, application installation, file compression, and e-mail management. The ‘Creativity Scenario’ represents media-centric activities such as digital photo processing, AI and ML for face recognition in photos and videos for the purpose of content creation, etc. The ‘Responsiveness Scenario’ evaluates the ability of the system to react in a quick manner to user inputs in areas such as application and file launches, web browsing, and multi-tasking.
Scores are meant to be compared against a reference desktop (the SYSmark 25 calibration system, a Lenovo Thinkcenter M720q with a Core i5-8500T and 8GB of DDR4 memory to go with a 256GB M.2 NVMe SSD). The calibration system scores 1000 in each of the scenarios. A score of, say, 2000, would imply that the system under test is twice as fast as the reference system.
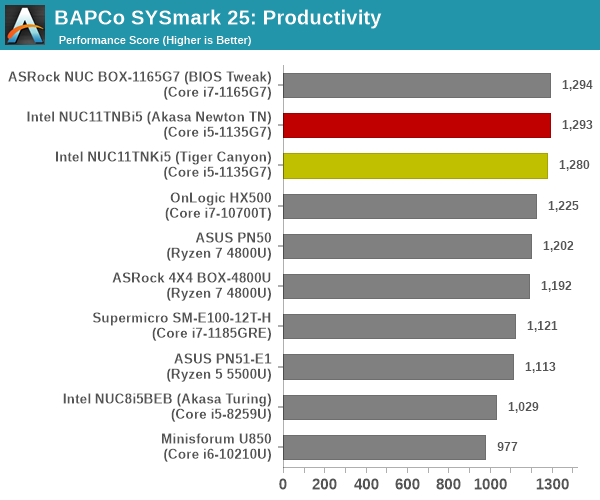
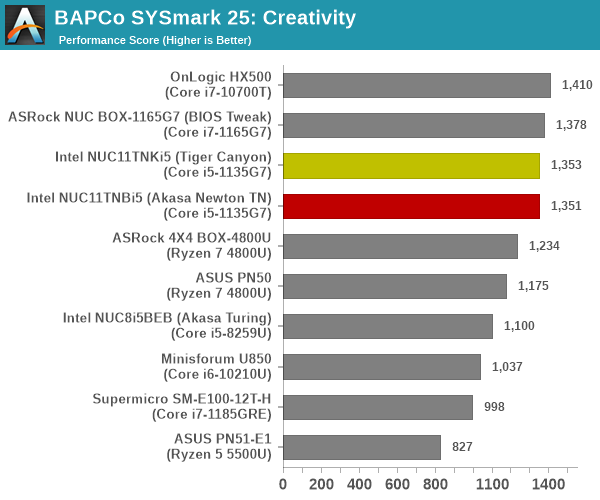
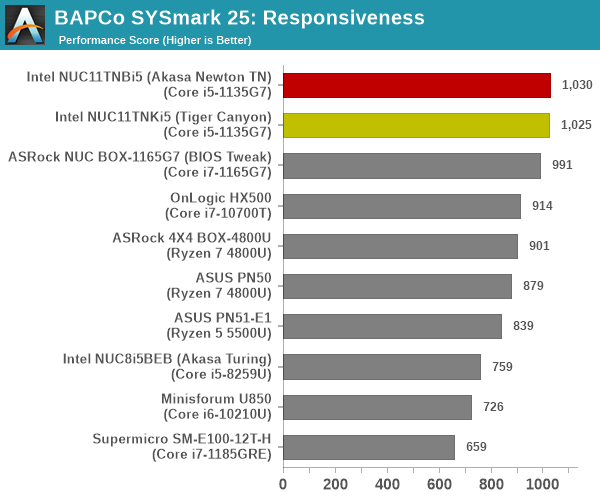
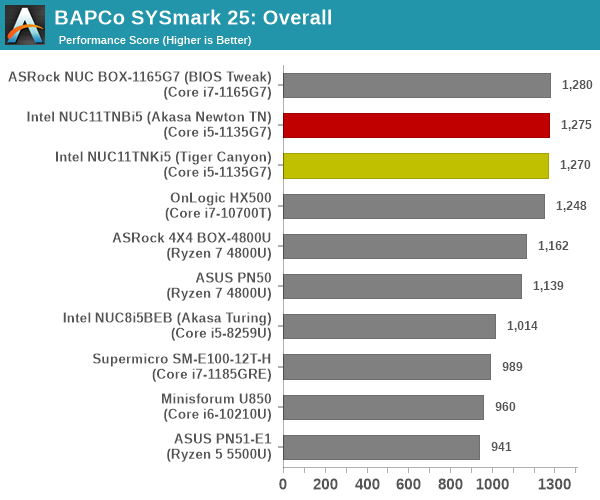
SYSmark 25 also adds energy measurement to the mix. A high score in the SYSmark benchmarks might be nice to have, but potential customers also need to determine the balance between power consumption and the performance of the system. For example, in the average office scenario, it might not be worth purchasing a noisy and power-hungry PC just because it ends up with a 2000 score in the SYSmark 25 benchmarks. In order to provide a balanced perspective, SYSmark 25 also allows vendors and decision makers to track the energy consumption during each workload. In the graphs below, we find the total energy consumed by the PC under test for a single iteration of each SYSmark 25 workload. For reference, the calibration system consumes 8.88 Wh for productivity, 10.81 Wh for creativity, and 19.69 Wh overall.
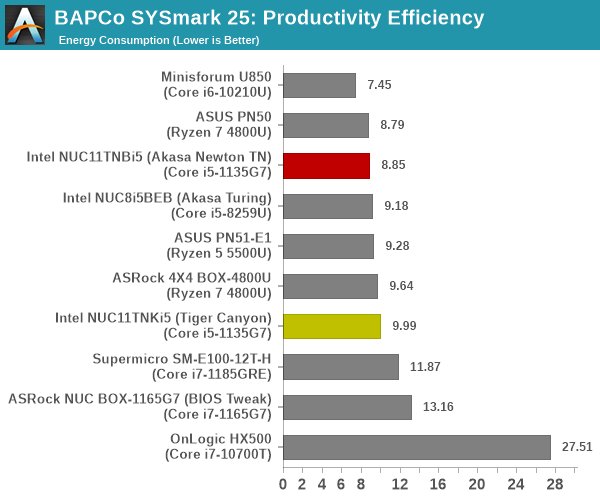
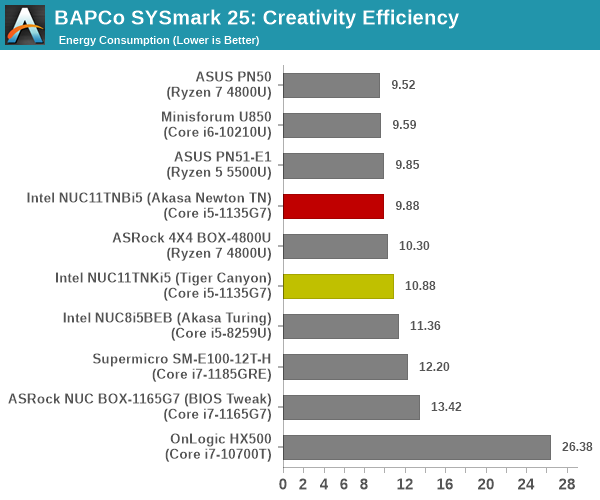
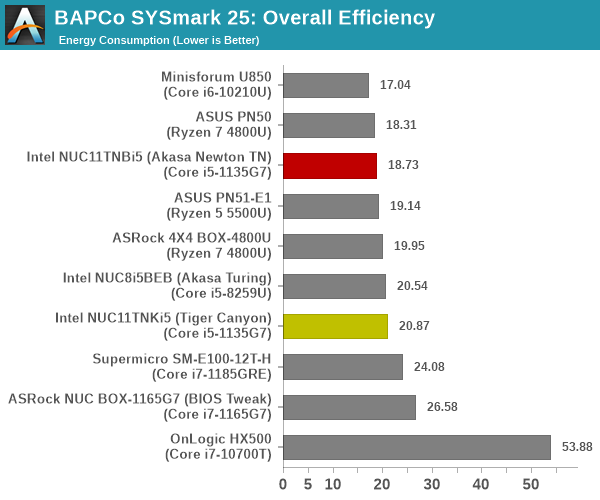
The scores for the NUC11TNKi5 and the Akasa Newton TN build are approximately the same (within the realm of run to run variations), and there is a sizable different in the energy consumption in favor of the passive build (probably due to the absence of the fan’s power consumption). On the raw scores side, the mid-range TGL-U systems make it to the top half dominated by Core i7 offerings with higher package power budgets.
BAPCo CrossMark 1.0.1.86
BAPCo’s CrossMark aims to simplify benchmark processing while still delivering scores that roughly tally with SYSmark. The main advantage is the cross-platform nature of the tool – allowing it to be run on smartphones and tablets as well.
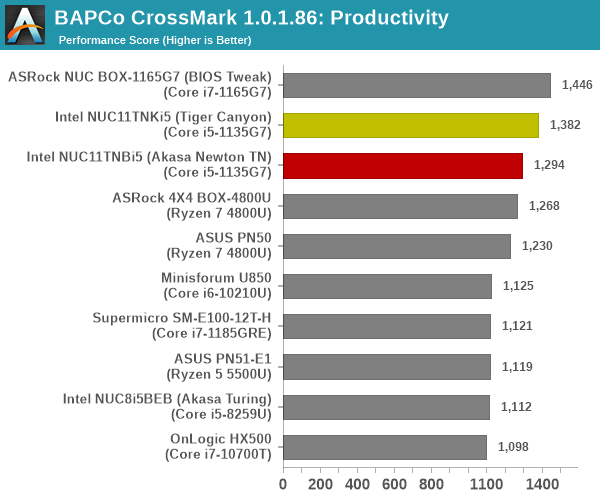
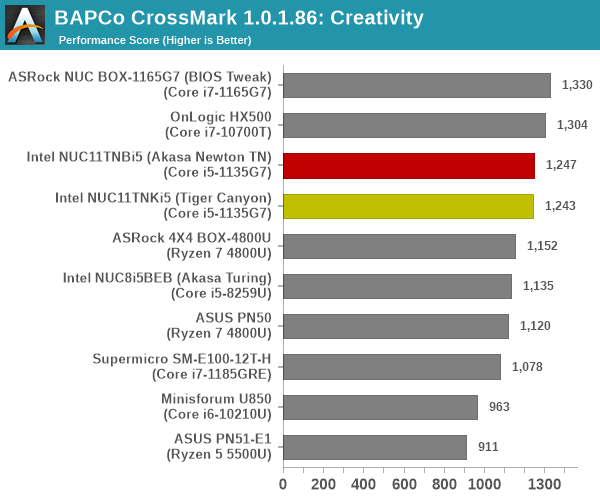
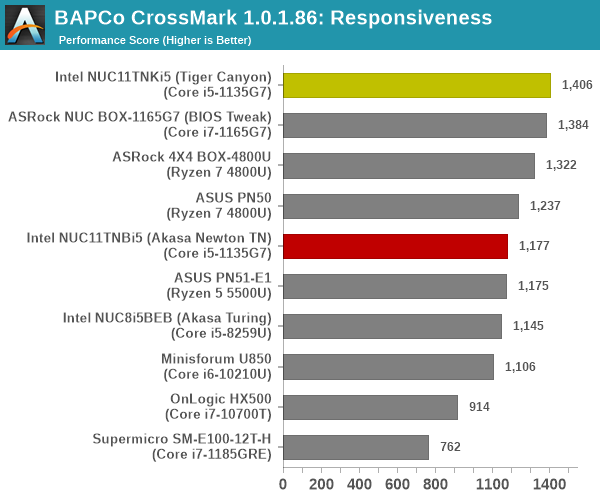
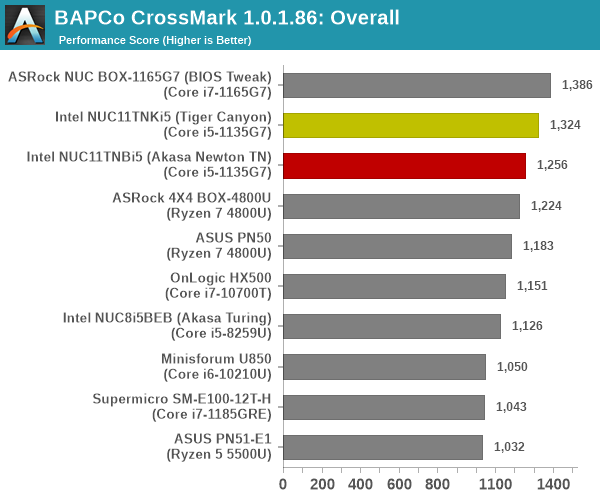
The relative performance seen in SYSmark 25 translate to CrossMark also, as expected. The responsiveness ratings point to the first sign of hiccups for the Akasa Newton TN build. While the SSD has a significant impact on this sub-component score, our monitoring software didn’t report any dangerous temperatures for the SSD. As such, we trust SYSmark 25 more than CrossMark because it operates with real workloads and without idle time compression, rather than a simulation of the activity.
Standardized benchmarks such as UL’s PCMark 10 and BAPCo’s SYSmark take a holistic view of the system and process a wide range of workloads to arrive at a single score. Some systems are required to excel at specific tasks – so it is often helpful to see how a computer performs in specific scenarios such as rendering, transcoding, JavaScript execution (web browsing), etc. This section presents focused benchmark numbers for specific application scenarios.
3D Rendering – CINEBENCH R23
We use CINEBENCH R23 for 3D rendering evaluation. R23 provides two benchmark modes – single threaded and multi-threaded. Evaluation of different PC configurations in both supported modes provided us the following results.
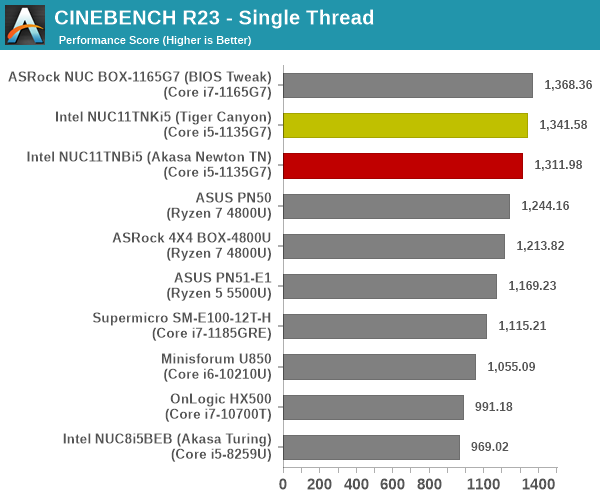
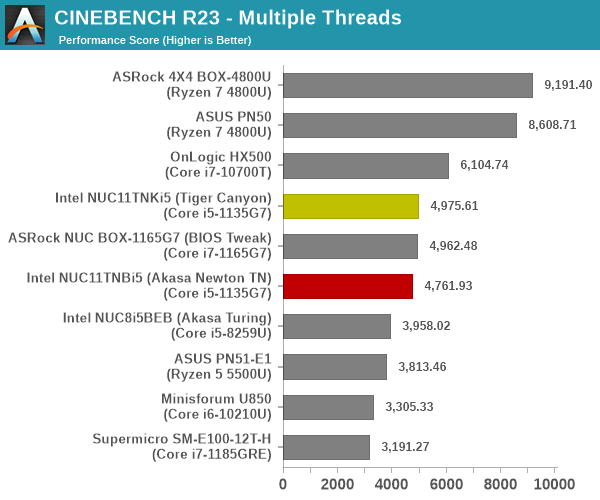
In the single-threaded case, Tiger Lake’s Core i7 with a 38W PL1 takes the lead, as expected. The Core i5 NUC configurations come right behind, hobbled a bit by their 28W PL1 setting. In the multi-threaded case, the sheer number of cores help the octa-core Renoir mini-PCs emerge on top, followed by the 35W Comet Lake-equipped OnLogic HX500 well behind. Again, the important takeaway here is that the relative difference between the active and passively-cooled builds is minuscule.
Transcoding: Handbrake 1.5.1
Handbrake is one of the most user-friendly open source transcoding front-ends in the market. It allows users to opt for either software-based higher quality processing or hardware-based fast processing in their transcoding jobs. Our new test suite uses the ‘Tears of Steel’ 4K AVC video as input and transcodes it with a quality setting of 19 to create a 720p AVC stream and a 1080p HEVC stream.
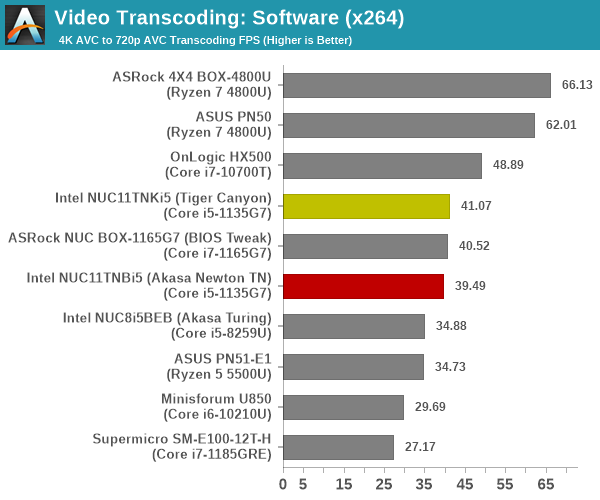
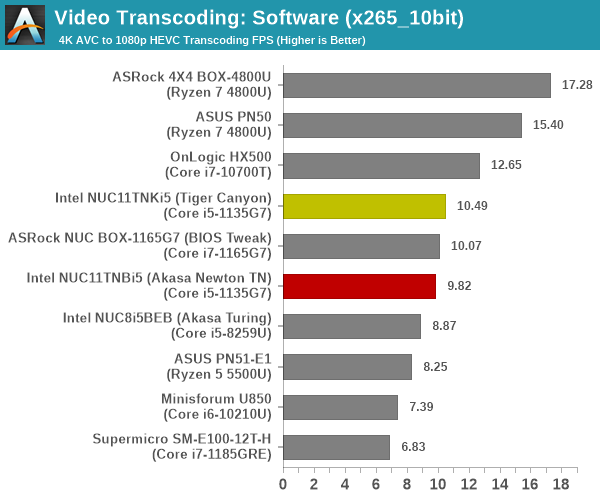
Software transcoding rates heavily depend on the number of cores, followed by the performance potential of each core. The high-end Renoir-based systems with eight cores have a significant lead that the quad-core TGL-U systems are unable to match up to.
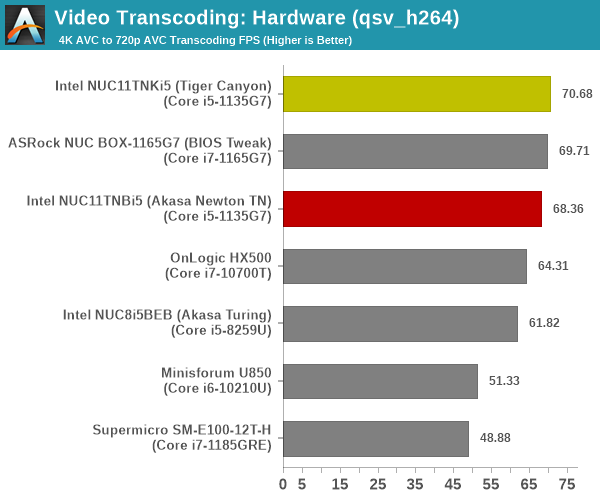
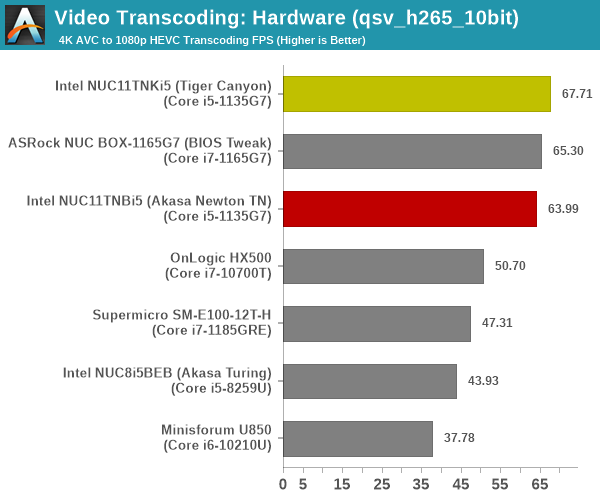
While the Renoir systems support VCE, we are not including results from those transcodes because the end results are not the same – and it wouldn’t be an apples-to-apples comparison. The rate here is a function of the speed of the GPU clock feeding into the QuickSync block. All TGL-U systems end up with approximately the same numbers.
Archiving: 7-Zip 21.7
The 7-Zip benchmark is carried over from our previous test suite with an update to the latest version of the open source compression / decompression software.
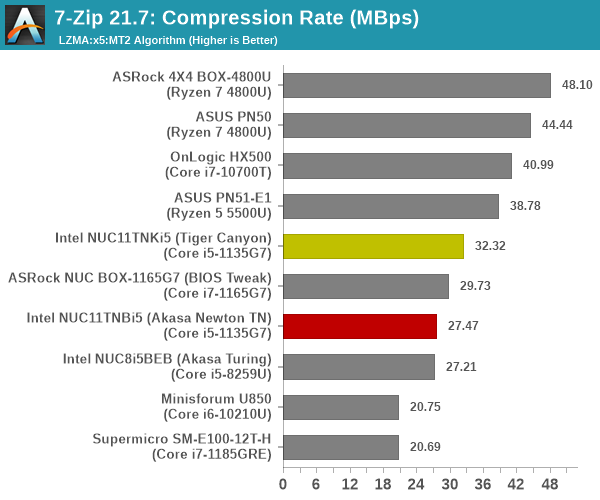
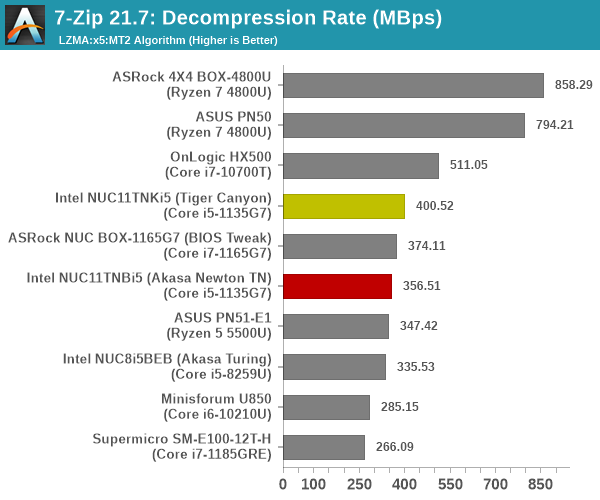
7-Zip is again a multi-threaded workload where Renoir’s octa-core SKUs grab the top spots, and Tiger Lake’s single-threaded performance advantage is not quite relevant.
Web Browsing: JetStream, Speedometer, and Principled Technologies WebXPRT4
Web browser-based workloads have emerged as a major component of the typical home and business PC usage scenarios. For headless systems, many applications based on JavaScript are becoming relevant too. In order to evaluate systems for their JavaScript execution efficiency, we are carrying over the browser-focused benchmarks from the WebKit developers used in our notebook reviews. Hosted at BrowserBench, JetStream 2.0 benchmarks JavaScript and WebAssembly performance, while Speedometer measures web application responsiveness.
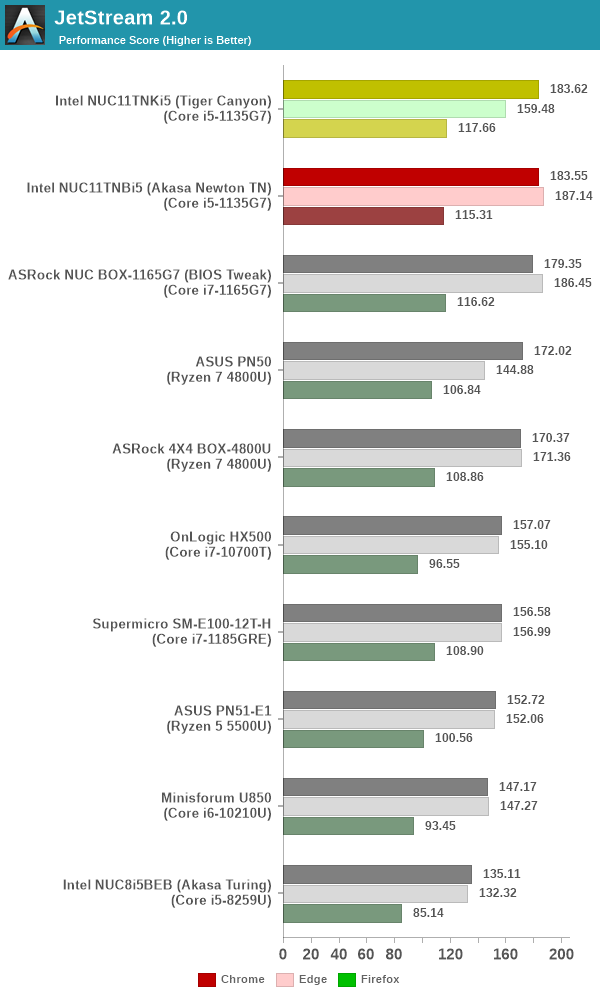
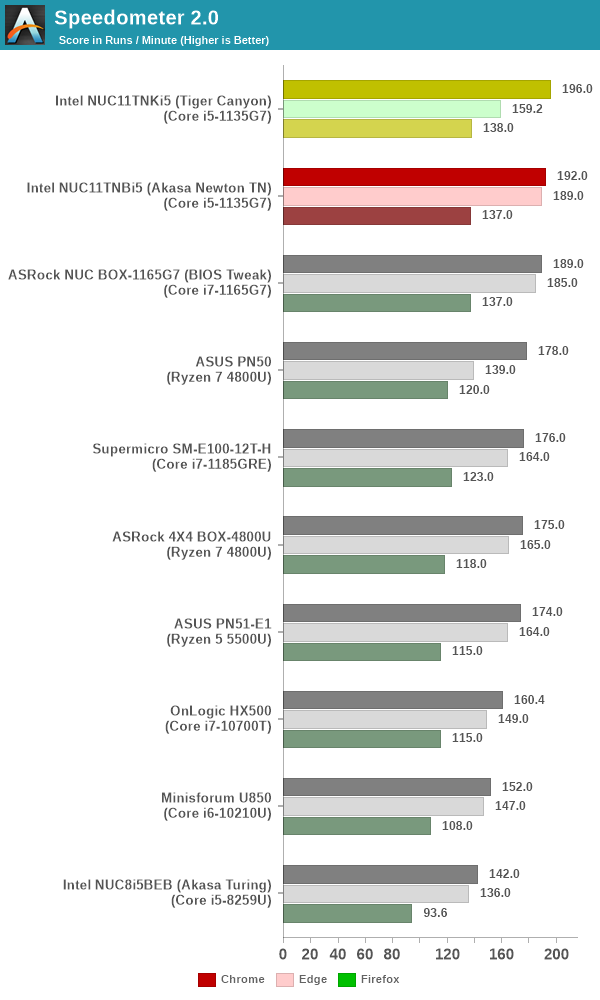
From a real-life workload perspective, we also process WebXPRT4 from Principled Technologies. WebXPRT4 benchmarks the performance of some popular JavaScript libraries that are widely used in websites.
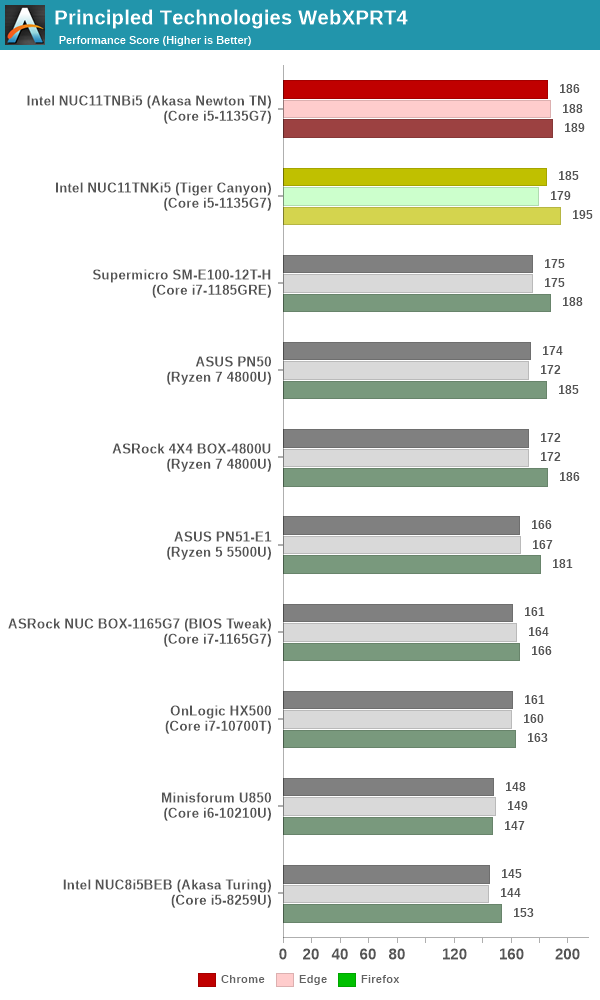
Browsers enjoy multiple cores, but it is single-threaded performance that ends up as a performance limiter. Here, Tiger Lake shines across the board – particularly in the real-world Principled Technologies WebXPRT4 workload.
Application Startup: GIMP 2.10.30
A new addition to our systems test suite is AppTimer – a benchmark that loads up a program and determines how long it takes for it to accept user inputs. We use GIMP 2.10.30 with a 50MB multi-layered xcf file as input. What we test here is the first run as well as the cached run – normally on the first time a user loads the GIMP package from a fresh install, the system has to configure a few dozen files that remain optimized on subsequent opening. For our test we delete those configured optimized files in order to force a fresh load every second time the software is run.
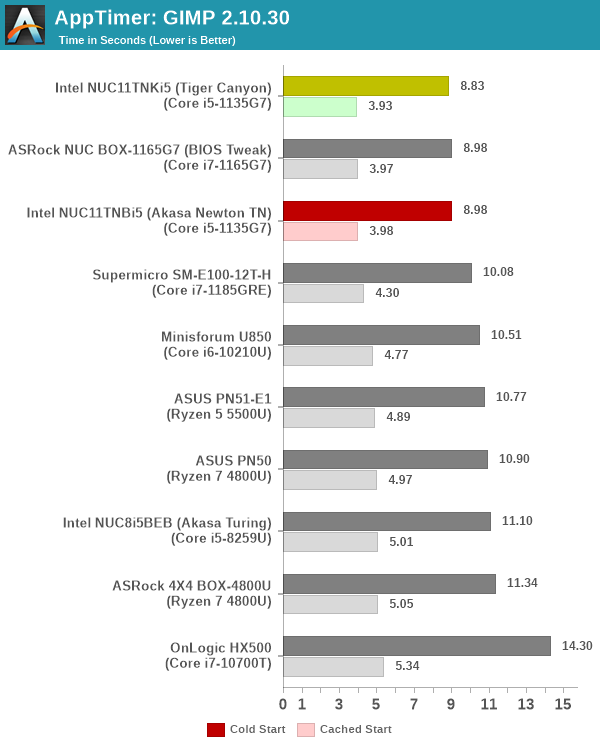
As it turns out, GIMP does optimizations for every CPU thread in the system, which requires that higher thread-count processors take a lot longer to run. So the test runs quick on systems with fewer threads, however fast cores are also needed. This combination works out well for Tiger Lake, and we see the four TGL-U systems take up the top spots.
Tiger Lake’s integrated GPU based on the reworked scalable Xe microarchitecture provides a significant increase in performance over the previous Intel iGPUs. In mini-PCs, the GPUs are generally used for casual gaming and multimedia workloads (including shader-enabled video postprocessing). GPU performance evaluation typically involves gaming workloads, and for select PCs, GPU compute.
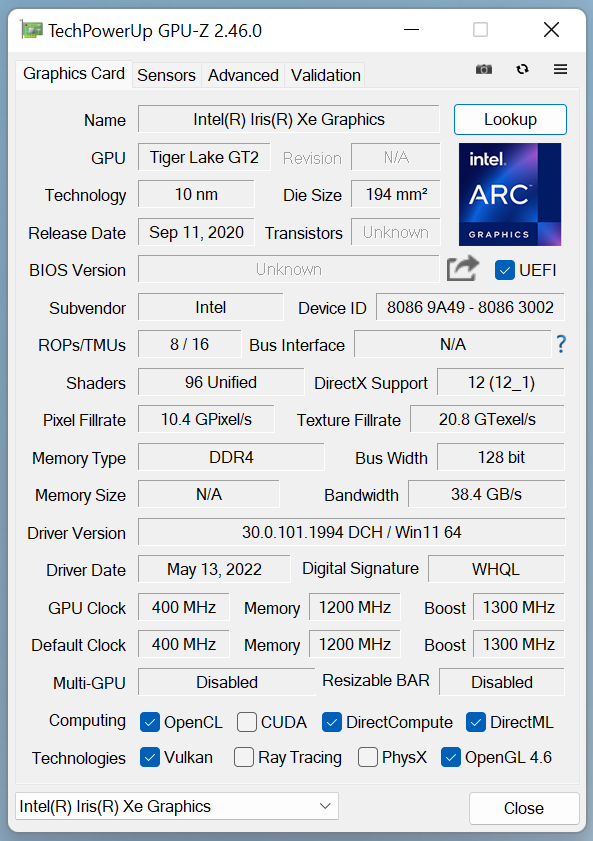
The Intel Iris Xe Graphics in the NUC11TNBi5’s Core i5-1135G7 has 80 EUs clocked between 0.4 GHz and 1.3 GHz (not 96, as shown in the screenshot above by GPU-Z). The performance of this iGPU is miles ahead of previous iGPUs from both Intel and AMD, as the benchmarks below show.
GFXBench
The DirectX 12-based GFXBench tests from Kishonti are cross-platform, and available all the way down to smartphones. As such, they are not very taxing for discrete GPUs and modern integrated GPUs. We processed the offscreen versions of the ‘Aztec Ruins’ benchmark.
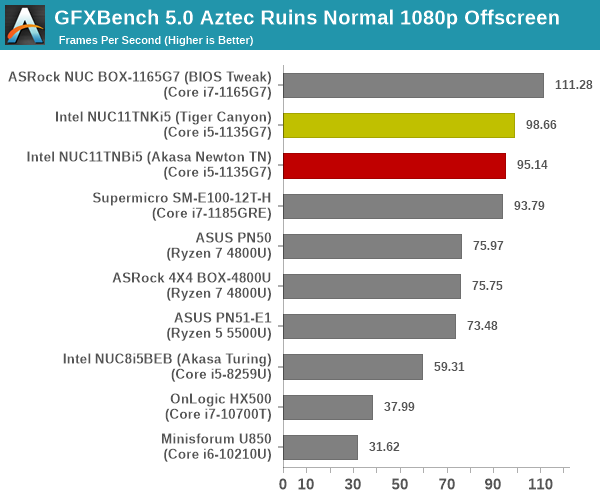
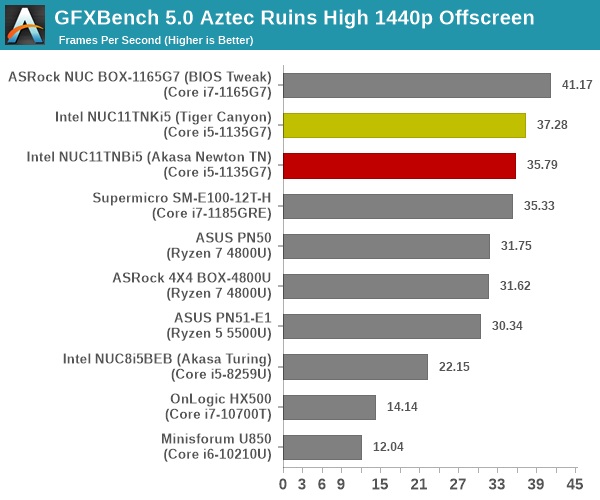
The extra EUs in the Core i7-1165G7, coupled with the higher PL1 limits enable the ASRock Industrial NUC BOX-1165G7 to grab the top spot here. However, the NUC11TNBi5 configurations take up the next two spots. The high-end Renoir SKUs reach around 80% of the performance of the NUC11TNBi5’s iGPU.
UL 3DMark
Four different workload sets were processed in 3DMark – Fire Strike, Time Spy, Night Raid, and Wild Life.
3DMark Fire Strike
The Fire Strike benchmark has three workloads. The base version is meant for high-performance gaming PCs. It uses DirectX 11 (feature level 11) to render frames at 1920 x 1080. The Extreme version targets 1440p gaming requirements, while the Ultra version targets 4K gaming system, and renders at 3840 x 2160. The graph below presents the overall score for the Fire Strike Extreme and Fire Strike Ultra benchmark across all the systems that are being compared.
| UL 3DMark – Fire Strike Workloads | |||

The relative difference observed in GFXBench translate to both Fire Strike workloads, with the NUC11 configurations taking up the second and third spots behind the NUC BOX-1165G7.
3DMark Time Spy
The Time Spy workload has two levels with different complexities. Both use DirectX 12 (feature level 11). However, the plain version targets high-performance gaming PCs with a 2560 x 1440 render resolution, while the Extreme version renders at 3840 x 2160 resolution. The graphs below present both numbers for all the systems that are being compared in this review.
| UL 3DMark – Time Spy Workloads | |||

The advantage for the TGL-U’s iGPU runs thin in the Time Spy workloads, with the high-end Renoir systems catching up to the NUC11’s Core i5-1135G7 at 4K resolution, and only slightly behind at 1080p.
3DMark Wild Life
The Wild Life workload was initially introduced as a cross-platform GPU benchmark in 2020. It renders at a 2560 x 1440 resolution using Vulkan 1.1 APIs on Windows. It is a relatively short-running test, reflective of mobile GPU usage. In mid-2021, UL released the Wild Life Extreme workload that was a more demanding version that renders at 3840 x 2160 and runs for a much longer duration reflective of typical desktop gaming usage.
| UL 3DMark – Wild Life Workloads | |||

The GFXBench story and analysis repeats for the Wild Life workload also.
3DMark Night Raid
The Night Raid workload is a DirectX 12 benchmark test. It is less demanding than Time Spy, and is optimized for integrated graphics. The graph below presents the overall score in this workload for different system configurations.
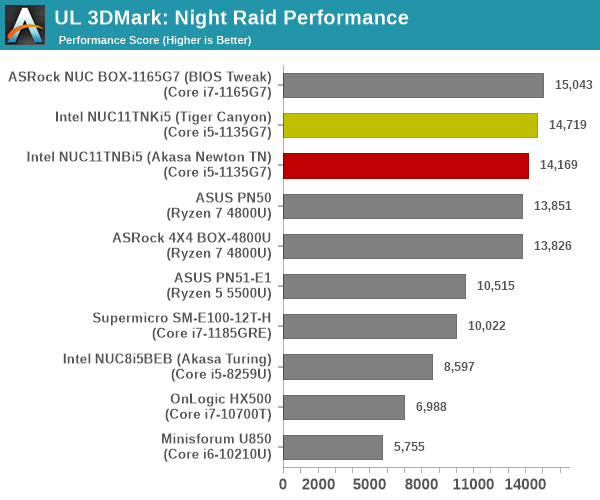
The ‘Night Raid’ workload sees the gap between the high-end Renoir and mid-range TGL-U iGPU narrow down, but the advantage still rests with TGL-U.
One of the key drivers of advancements in computing systems is multi-tasking. On mobile devices, this is quite lightweight – cases such as background email checks while the user is playing a mobile game are quite common. Towards optimizing user experience in those types of scenarios, mobile SoC manufacturers started integrating heterogeneous CPU cores – some with high performance for demanding workloads, while others were frugal in terms of both power consumption / die area and performance. This trend is now slowly making its way into the desktop PC space.
Multi-tasking in typical PC usage is much more demanding compared to phones and tablets. Desktop OSes allow users to launch and utilize a large number of demanding programs simultaneously. Responsiveness is dictated largely by the OS scheduler allowing different tasks to move to the background. Intel’s Alder Lake processors work closely with the Windows 11 thread scheduler to optimize performance in these cases. Keeping these aspects in mind, the evaluation of multi-tasking performance is an interesting subject to tackle.
We have augmented our systems benchmarking suite to quantitatively analyze the multi-tasking performance of various platforms. The evaluation involves triggering a VLC transcoding task to transform 1716 3840×1714 frames encoded as a 24fps AVC video (Blender Project’s ‘Tears of Steel’ 4K version) into a 1080p HEVC version in a loop. VLC internally uses the x265 encoder, and the settings are configured to allow the CPU usage to be saturated across all cores. The transcoding rate is monitored continuously. One complete transcoding pass is allowed to complete before starting the first multi-tasking workload – the PCMark 10 Extended bench suite. A comparative view of the PCMark 10 scores for various scenarios is presented in the graphs below. Also available for concurrent viewing are scores in the normal case where the benchmark was processed without any concurrent load, and a graph presenting the loss in performance.
| UL PCMark 10 Load Testing – Digital Content Creation Scores | |||

| UL PCMark 10 Load Testing – Productivity Scores | |||

| UL PCMark 10 Load Testing – Essentials Scores | |||

| UL PCMark 10 Load Testing – Gaming Scores | |||

| UL PCMark 10 Load Testing – Overall Scores | |||

Except for the gaming workload which is pretty much unaffected by the CPU loading, the sheer number of cores in the Renoir-based systems help it in salvaging good scores in the presence of concurrent loading.
Following the completion of the PCMark 10 benchmark, a short delay is introduced prior to the processing of Principled Technologies WebXPRT4 on MS Edge. Similar to the PCMark 10 results presentation, the graph below show the scores recorded with the transcoding load active. Available for comparison are the dedicated CPU power scores and a measure of the performance loss.
| Principled Technologies WebXPRT4 Load Testing Scores (MS Edge) | |||

The Tiger Lake-U systems are the top performers here, both in terms of raw scores and minizing performance loss.
The final workload tested as part of the multitasking evaluation routine is CINEBENCH R23.
| 3D Rendering – CINEBENCH R23 Load Testing – Single Thread Score | |||

| 3D Rendering – CINEBENCH R23 Load Testing – Multiple Thread Score | |||

The large number of cores in the Renoir systems allow it to shuffle around the tasks in such a way that the performance loss for rendering workloads is minimized.
After the completion of all the workloads, we let the transcoding routine run to completion. The monitored transcoding rate throughout the above evaluation routine (in terms of frames per second) for select systems are tabulated below.
| VLC Transcoding Rate (Multi-Tasking Test) – Frames per Second | |||||
| Enc. Pass #1 | PCMark 10 | WebXPRT4 | Cinebench | Enc. Pass #2 | |
| ASRock 4X4 BOX-4800U (Ryzen 7 4800U) |
1.6366 | 1.5167 | 1.4080 | 1.5505 | 1.6073 |
| Intel NUC11TNBi5 (Akasa Newton TN) (Core i5-1135G7) |
0.8662 | 0.7773 | 0.7275 | 0.7773 | 0.8722 |
| ASRock NUC BOX-1165G7 (Core i7-1165G7) |
0.8409 | 0.8004 | 0.7230 | 0.7534 | 0.8854 |
The transcoding rates in different systems drop down with simultaneous loading, as expected. The key numbers to note in the above table are the first and second encoding passes for the Newton build. With the numbers actually showing a slight advantage for the second pass, it is clear that there is no throttling at play for this particular workload and duration.
The HTPC-related sections in previous SFF PC reviews covered a range of aspects. Display refresh rate stability (particularly, the ability to drive 23.976 Hz for stutter-free playback of cinema content), OTT streaming efficiency (YouTube and Netflix), and local media playback performance and efficiency evaluation were some of them. While such a detailed study may still make sense for dedicated HTPC reviews, we have decided to pare down the evaluated aspects for system reviews. Workloads were processed on the Intel NUC11TNBi5 in Akasa’s Newton TN fanless case for the results in this section.
YouTube Streaming Efficiency
4K video streaming has become ubiquitous enough for its support to be a necessity even for secondary HTPCs. HDR has also become affordable – in fact, one of the key changes for HTPCs in Jasper Lake is the enabling of HDR over HDMI, a feature not available in Gemini Lake-based systems. Keeping these aspects in mind, we have chosen Mystery Box’s Peru 8K HDR 60FPS video as our test sample moving forward. On PCs running Windows, it is recommended that HDR streaming videos be viewed using the Microsoft Edge browser after putting the desktop in HDR mode.
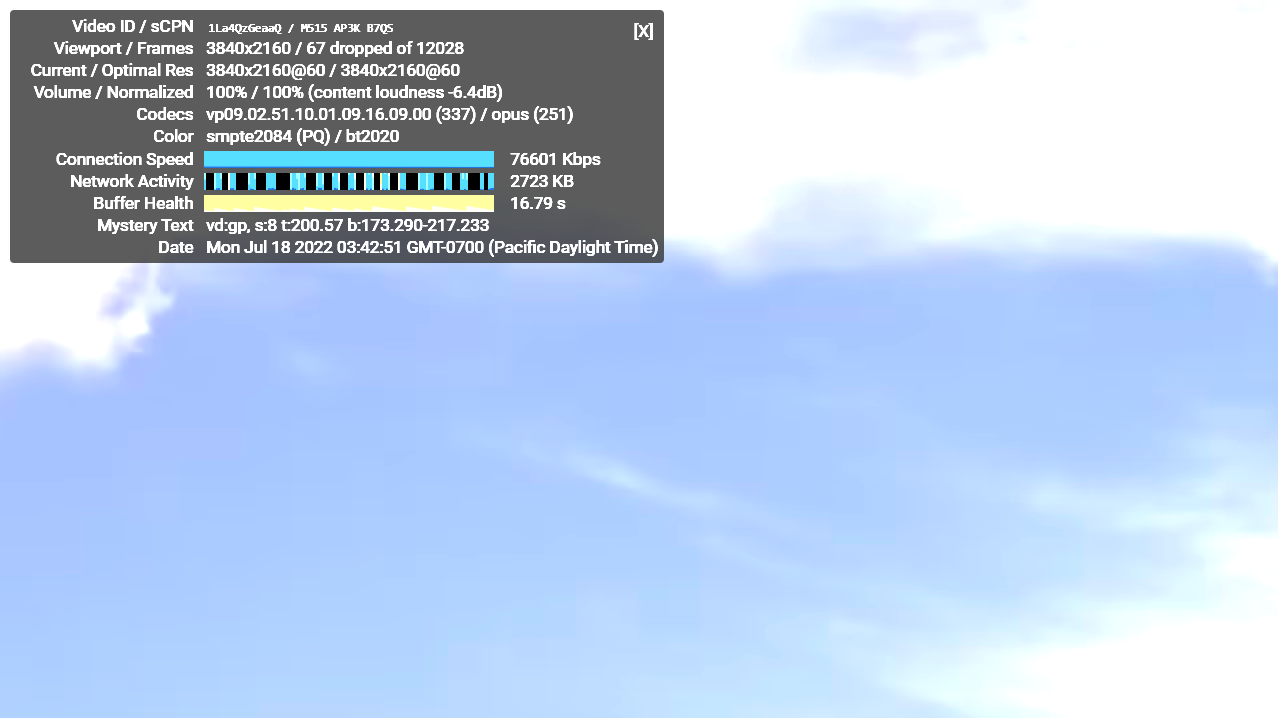
Intel’s Xe Graphics in TGL-U supports hardware decoding for VP9 Profile 2. Taking advantage of this feature, MS Edge automatically fetches the 4Kp60 VP9 Profile 2 encode from the YouTube servers. The playback was flawless in both builds, with the few dropped frames happening in the beginning during playback resolution / fullscreen switching.
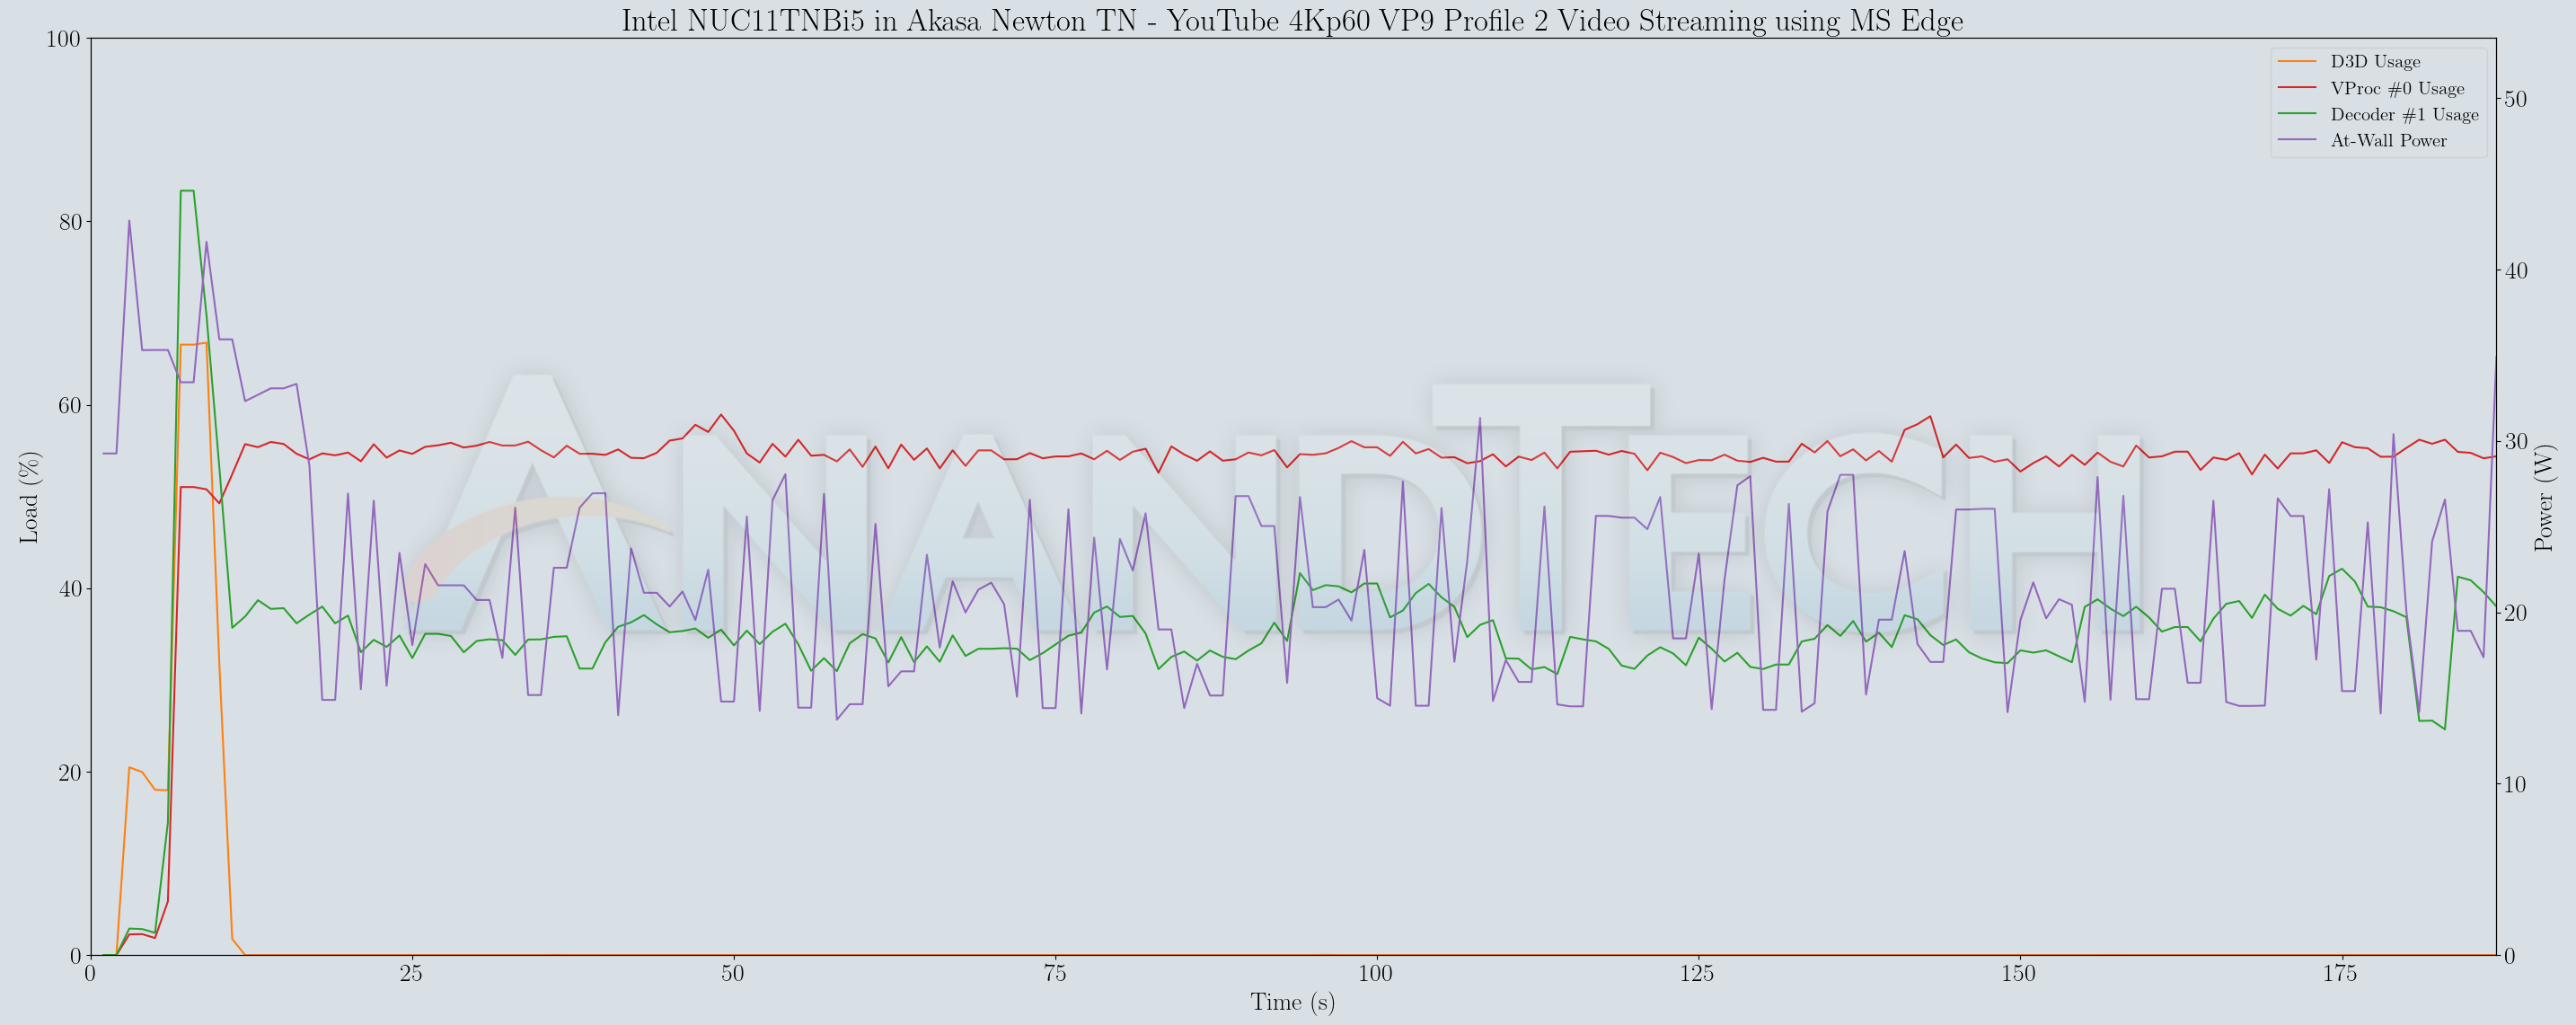
D3D usage makes its appearance for upscaling purposes (when the streamed / decoded video doesn’t match the native display resolution), but soon disappears after the 4Kp60 stream starts coming in. The at-wall power consumption is around 20W on an average and the decoder loading is south of 40%, with the video processor load coming in around 55%. With smooth playback and no dropped frames worth analyzing, the graph analysis turns out to be pretty uneventful.
Hardware-Accelerated Encoding and Decoding
The transcoding benchmarks in the systems performance section presented results from evaluating the QuickSync encoder within Handbrake’s framework. The iGPU in the systems support hardware encode for AVC, JPEG, HEVC (8b and 10b, 4:2:0 and 4:4:4), and VP9 (8b and 10b, 4:2:0 and 4:4:4). The capabilities of the decoder engine are brought out by DXVAChecker.
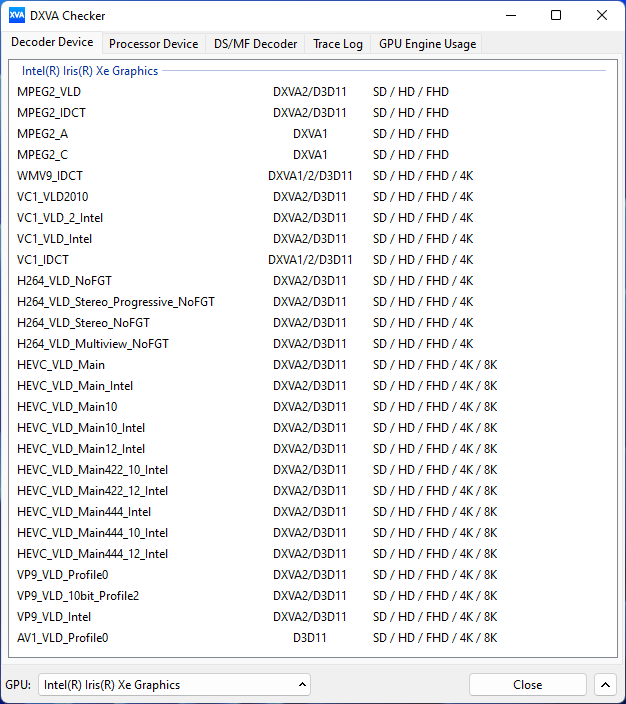
The decoder engine in Tiger Lake-U supports the latest and greated that Intel has to offer (except for AV1 encode, which is present only in the Arc dGPUs for now).
Local Media Playback
Evaluation of local media playback and video processing is done by playing back files encompassing a range of relevant codecs, containers, resolutions, and frame rates. A note of the efficiency is also made by tracking GPU usage and power consumption of the system at the wall. Users have their own preference for the playback software / decoder / renderer, and our aim is to have numbers representative of commonly encountered scenarios. Considering the target market for Tiger Lake-U systems, we played back the test streams using the following install-and-forget combinations:
- VLC 3.0.17.4
- Kodi 19.4
The fourteen test streams (each of 90s duration) were played back from the local disk with an interval of 30 seconds in-between. Various metrics including GPU usage and at-wall power consumption were recorded during the course of this playback. Based on the DXVAChecker report presented previously, the GPU should be able to play back all codecs with hardware acceleration.
All our playback tests were done with the desktop HDR setting turned on. It is possible for certain system configurations to automatically turn on/off the HDR capabilities prior to the playback of a HDR video, but, we didn’t take advantage of that in our testing.
VLC is the playback software of choice for the average PC user who doesn’t need a ten-foot UI. Its install-and-play simplicity has made it extremely popular. Over the years, the software has gained the ability to take advantage of various hardware acceleration options. Kodi, on the other hand, has a ten-foot UI making it the perfect open-source software for dedicated HTPCs. Support for add-ons make it very extensible and capable of customization. We played back our test files using the default VLC and Kodi configurations, and recorded the following metrics.
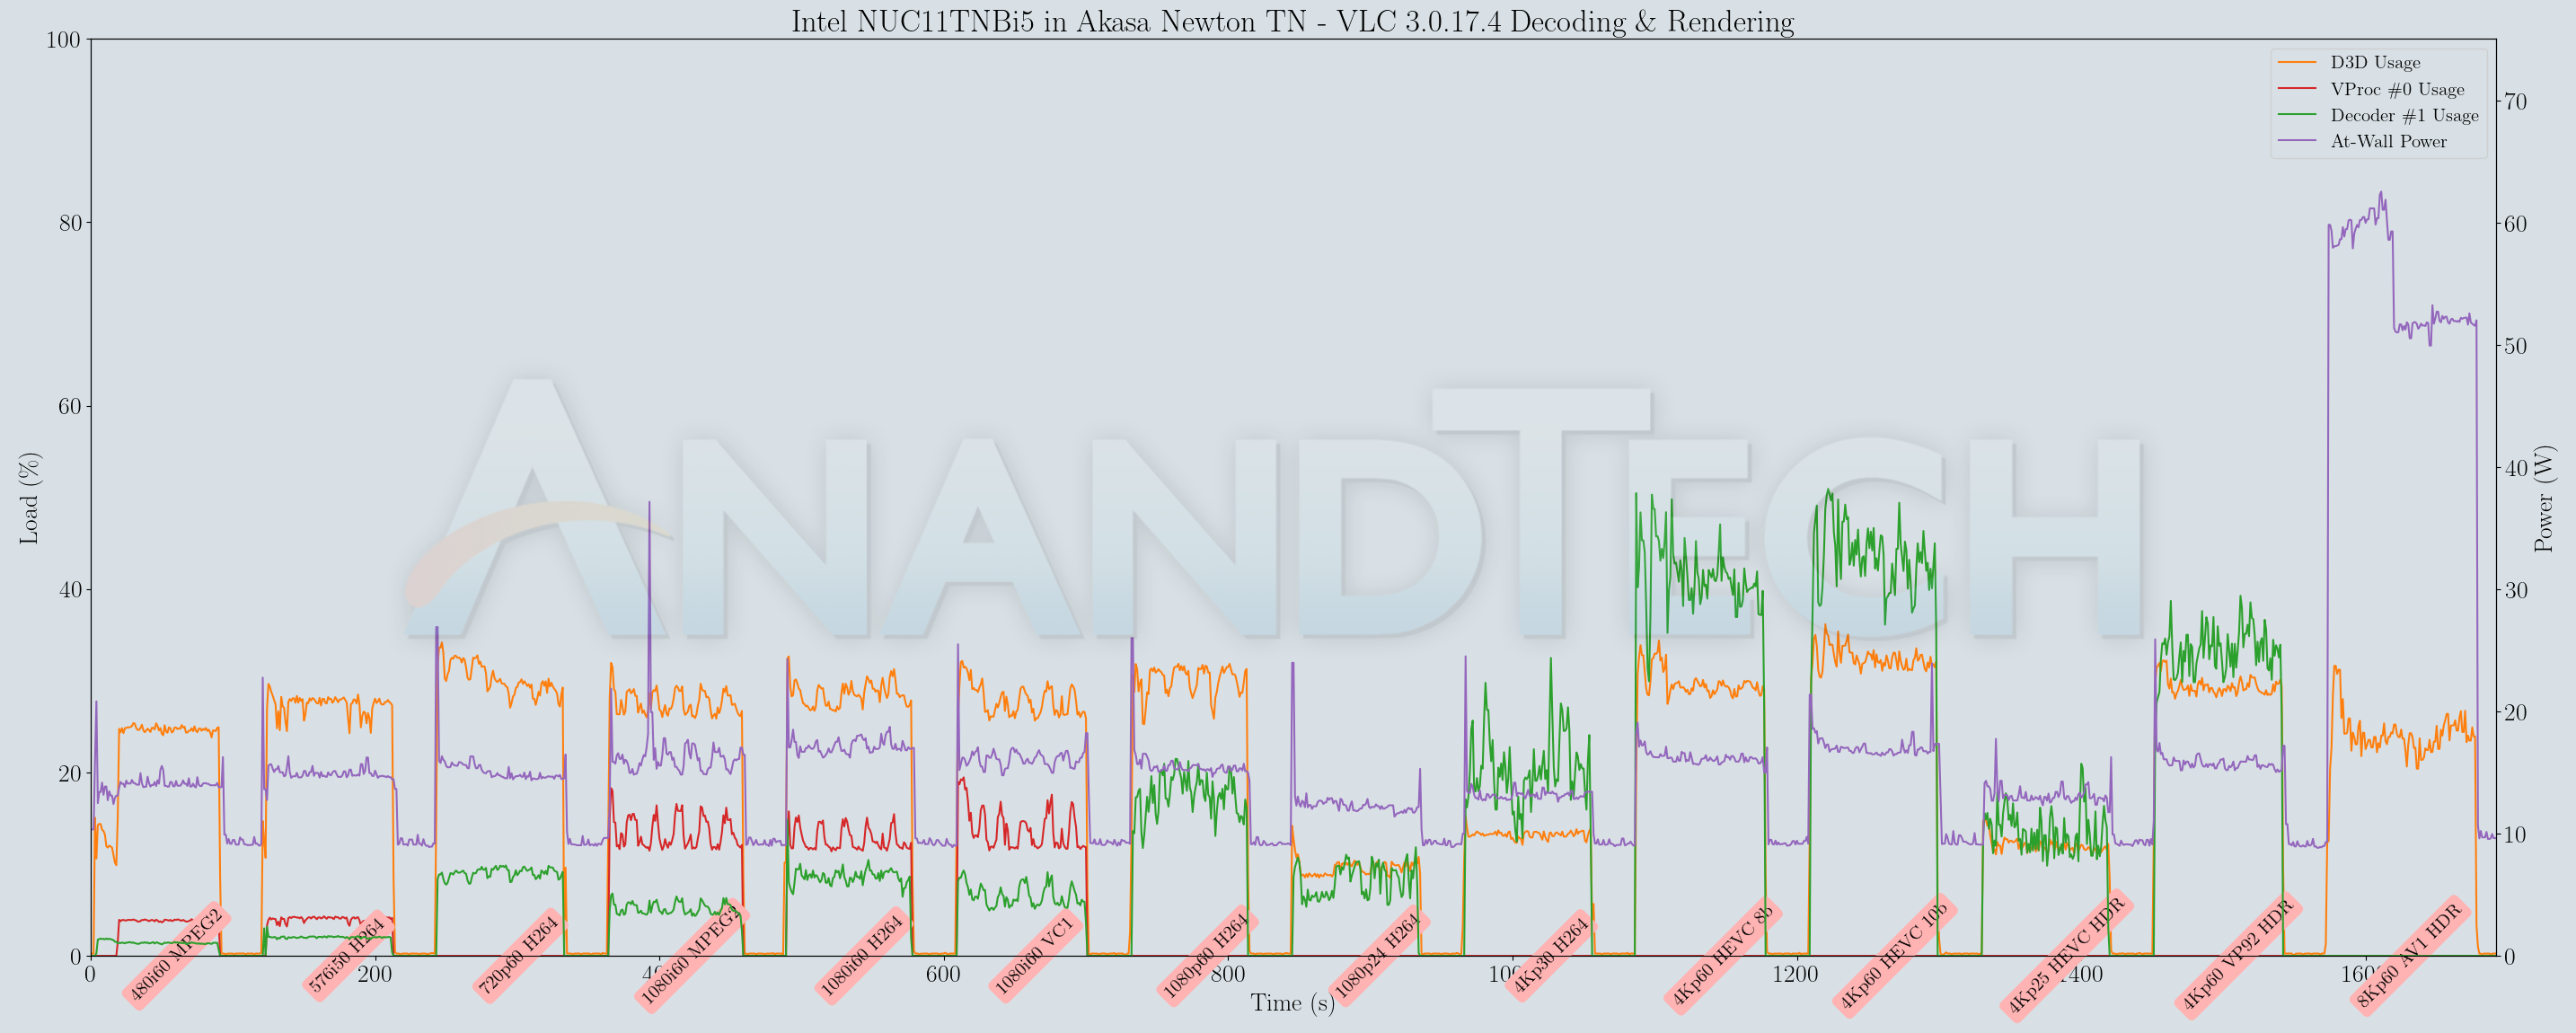
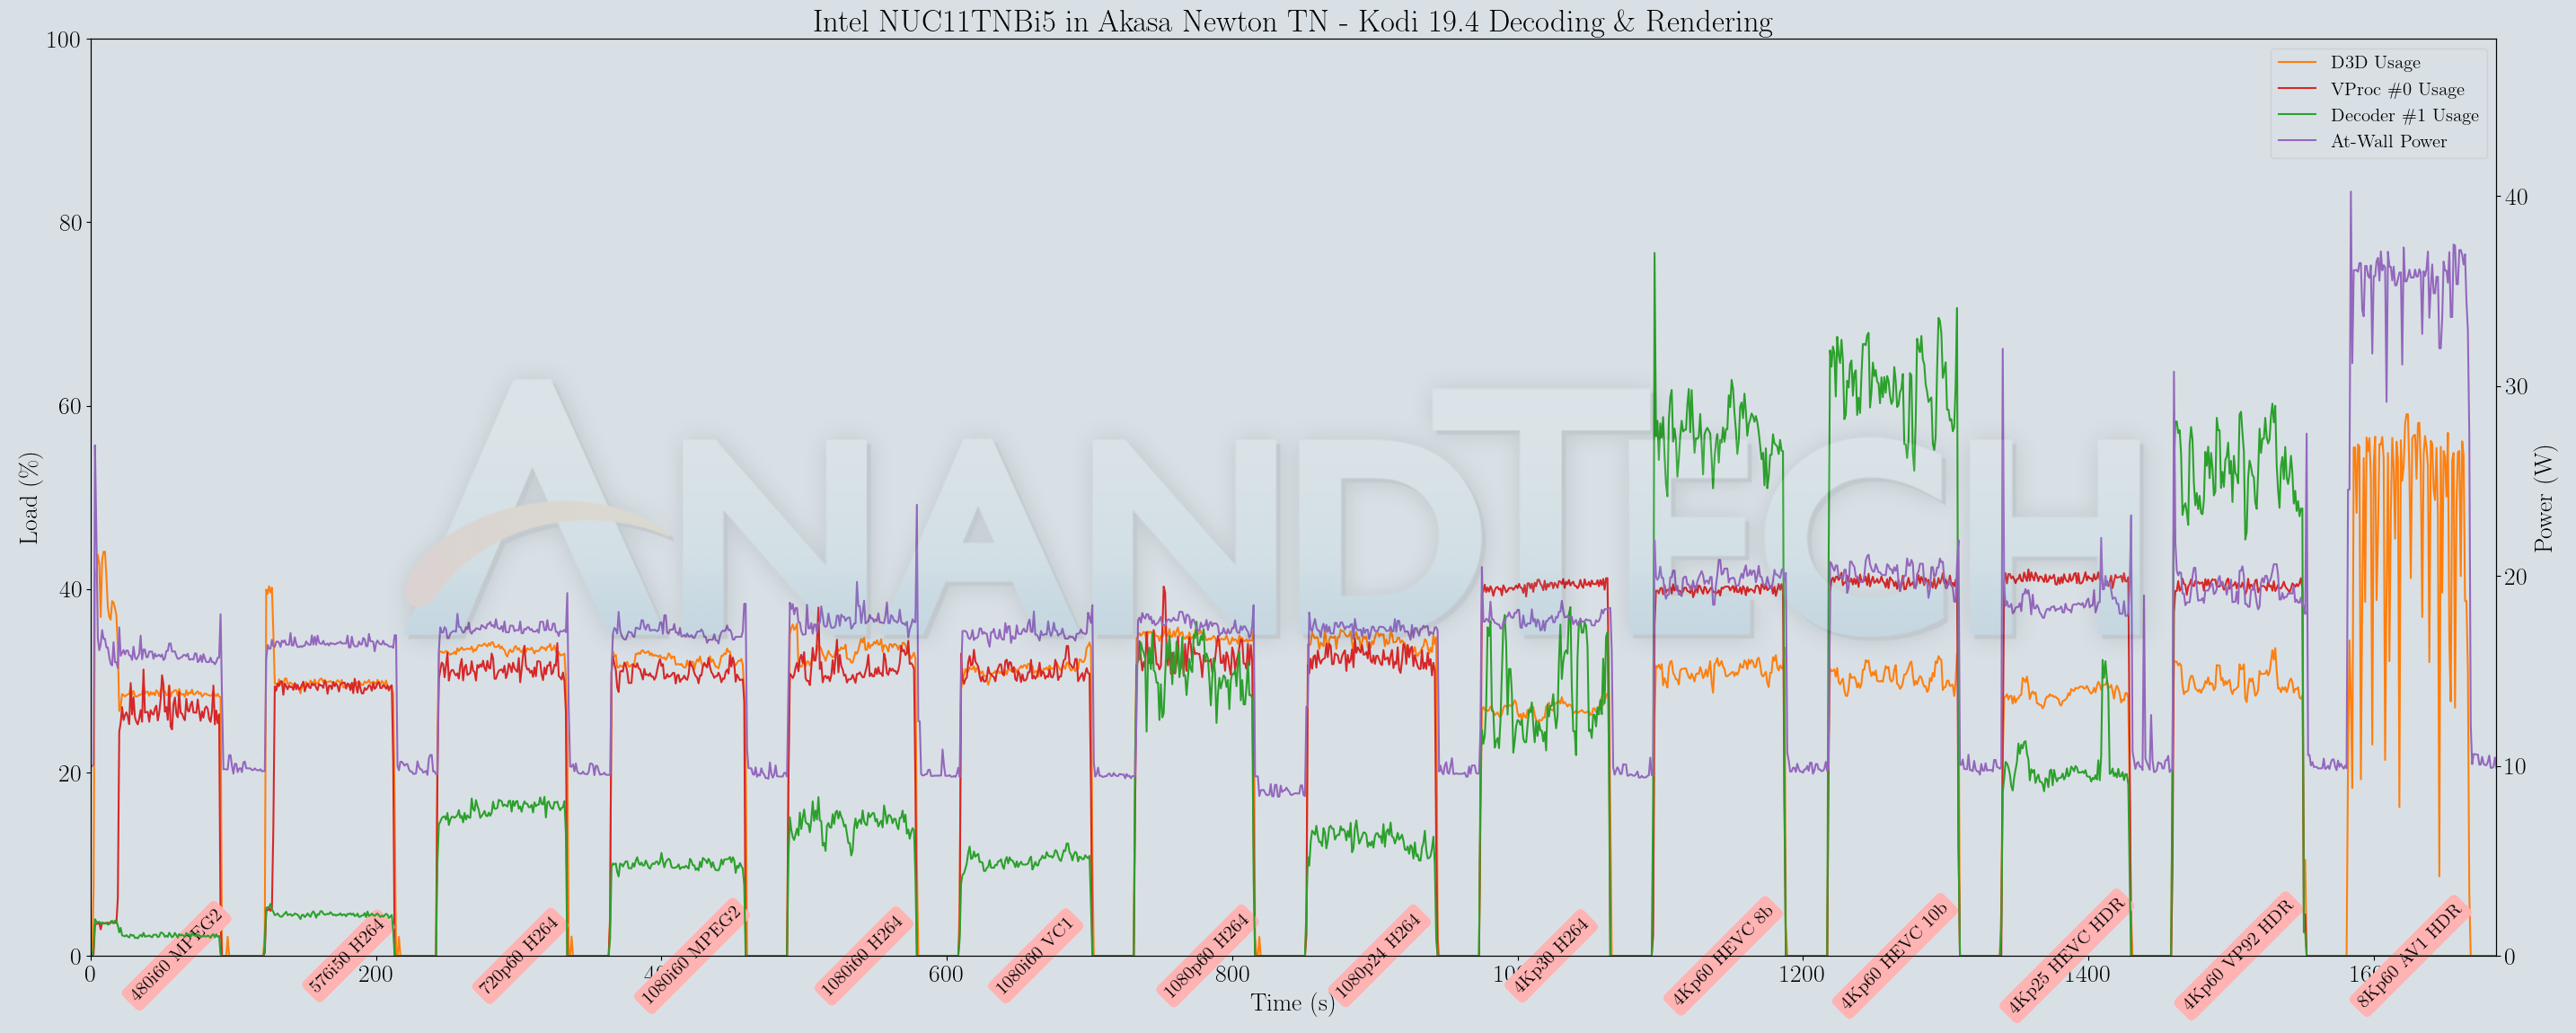
Playback is perfectly smooth in both VLC and Kodi for all streams except the 8Kp60 AV1 clip. Power consumption is below 20W for all streams decoded in hardware. While hardware decoding support for AV1 exists, this is a case of the software infrastructure yet to catch up with the hardware capabilities. With alpha releases of Kodi supporting AV1 hardware decoding, this scenario for the 8Kp60 AV1 clip is bound to change for the better in the coming months.
The power consumption at the wall was measured with a 4K display being driven through one of the HDMI ports in the system. In the graph below, we compare the idle and load power of the Intel NUC11TNBi5 (Akasa Newton TN) with other systems evaluated before. For load power consumption, we ran the AnandTech System Stress Test (a combination of Prime95, Furmark, and the AIDA64 System Stability Test with various stress components) and noted the peak as well as idling power consumption at the wall.
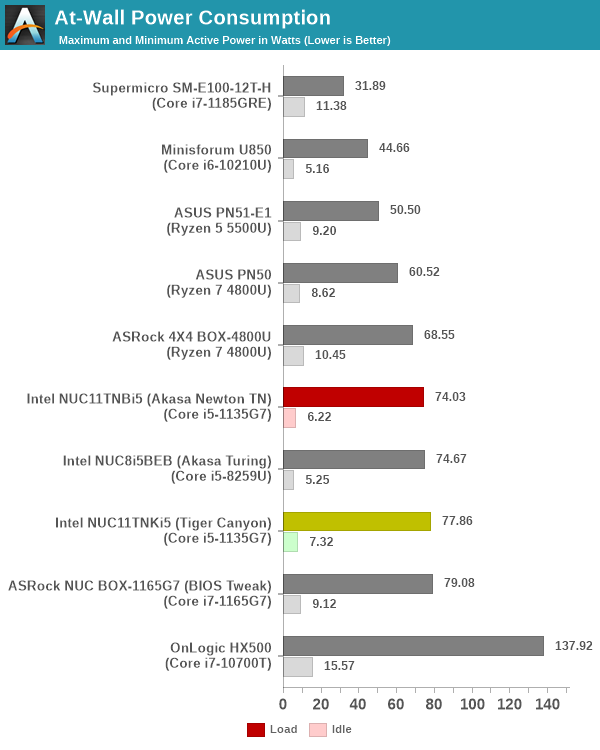
The numbers are consistent with the TDP and configured PL1 / PL2 values for the processors in the systems, and do not come as any surprise. The absence of the fan in the Newton TN build provides some idle power saving compared to the regular NUC11TNKi5.
Stress Testing
Our thermal stress routine is a combination of Prime95, Furmark, and Finalwire’s AIDA64 System Stability Test. The following 9-step sequence is followed, starting with the system at idle:
- Start with the Prime95 stress test configured for maximum power consumption
- After 30 minutes, add Furmark GPU stress workload
- After 30 minutes, terminate the Prime95 workload
- After 30 minutes, terminate the Furmark workload and let the system idle
- After 30 minutes of idling, start the AIDA64 System Stress Test (SST) with CPU, caches, and RAM activated
- After 30 minutes, terminate the previous AIDA64 SST and start a new one with the GPU, CPU, caches, and RAM activated
- After 30 minutes, terminate the previous AIDA64 SST and start a new one with only the GPU activated
- After 30 minutes, terminate the previous AIDA64 SST and start a new one with the CPU, GPU, caches, RAM, and SSD activated
- After 30 minutes, terminate the AIDA64 SST and let the system idle for 30 minutes
Traditionally, this test used to record the clock frequencies – however, with the increasing number of cores in modern processors and fine-grained clock control, frequency information makes the graphs cluttered and doesn’t contribute much to understanding the thermal performance of the system. The focus is now on the power consumption and temperature profiles to determine if throttling is in play. All the thermal stress tests reported in this section were conducted with the ambient temperature between 78F and 82F and no explicit airflow across the system under test.
The first set of graphs is for the actively-cooled Intel NUC11TNKi5. Starting off with the temperatures and fan speed, we see that the package briefly reaches 92C during the initial PL2 bursts. However, the fan kicks up to 3500 RPM and soon cools it down to around 70C. For regular PL1 loading, the fan stays at around 3150 RPM. The maximum sustained temperature for the package was recorded during the AIDA64 CPU, FPU, caches, and RAM stress – around 83C. The maximum SSD temperature was recorded to be around 65C during the AIDA64 SSD stress component.
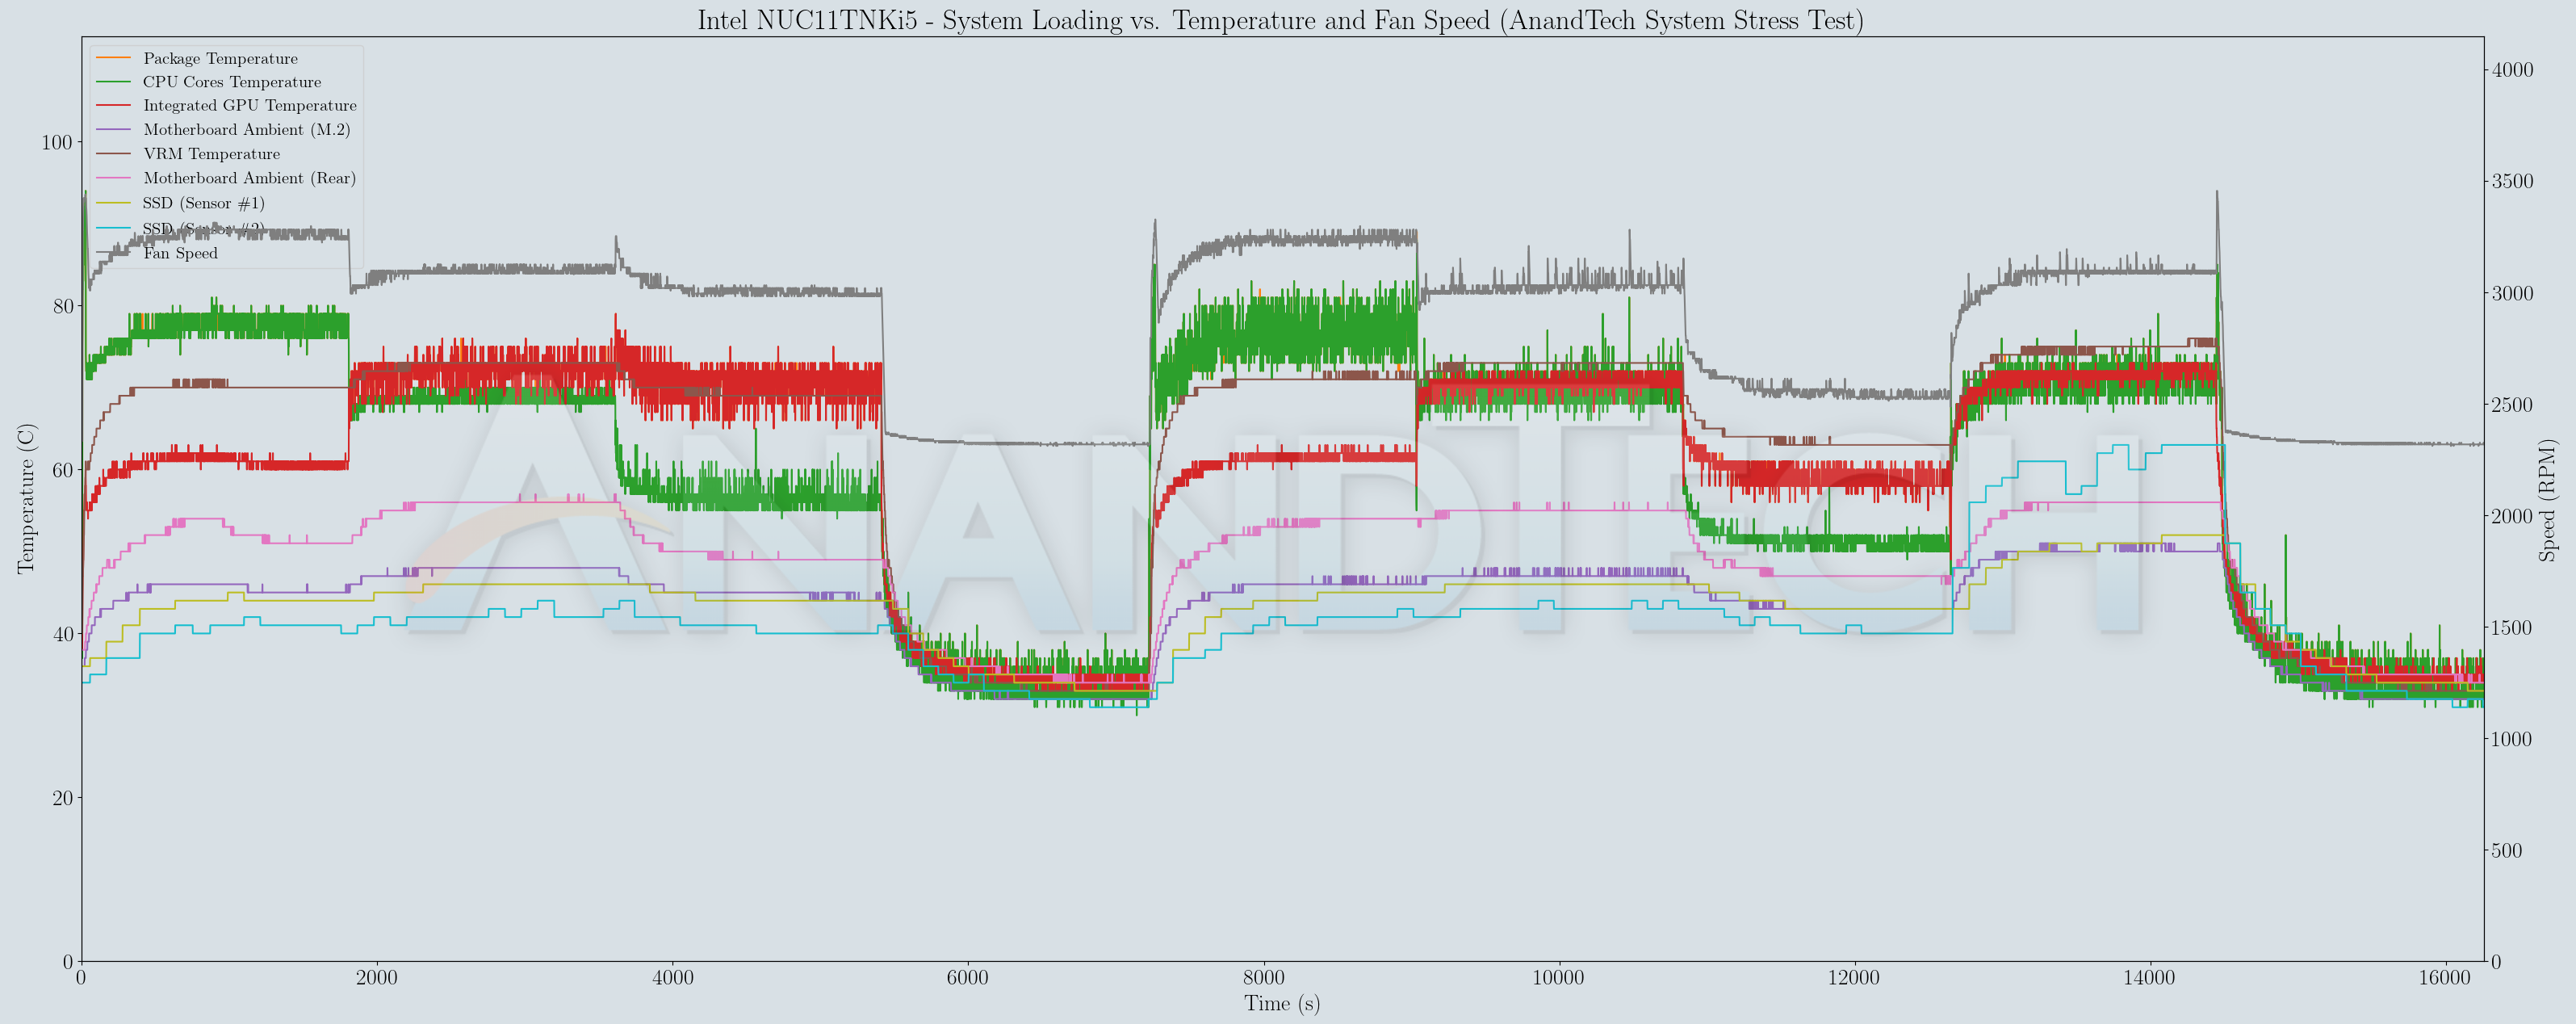
Based on the temperatures recorded above, we do not expect to see any throttling in the picture. This is confirmed by the power numbers reported for the internal components, as well as the at-wall power consumption number.
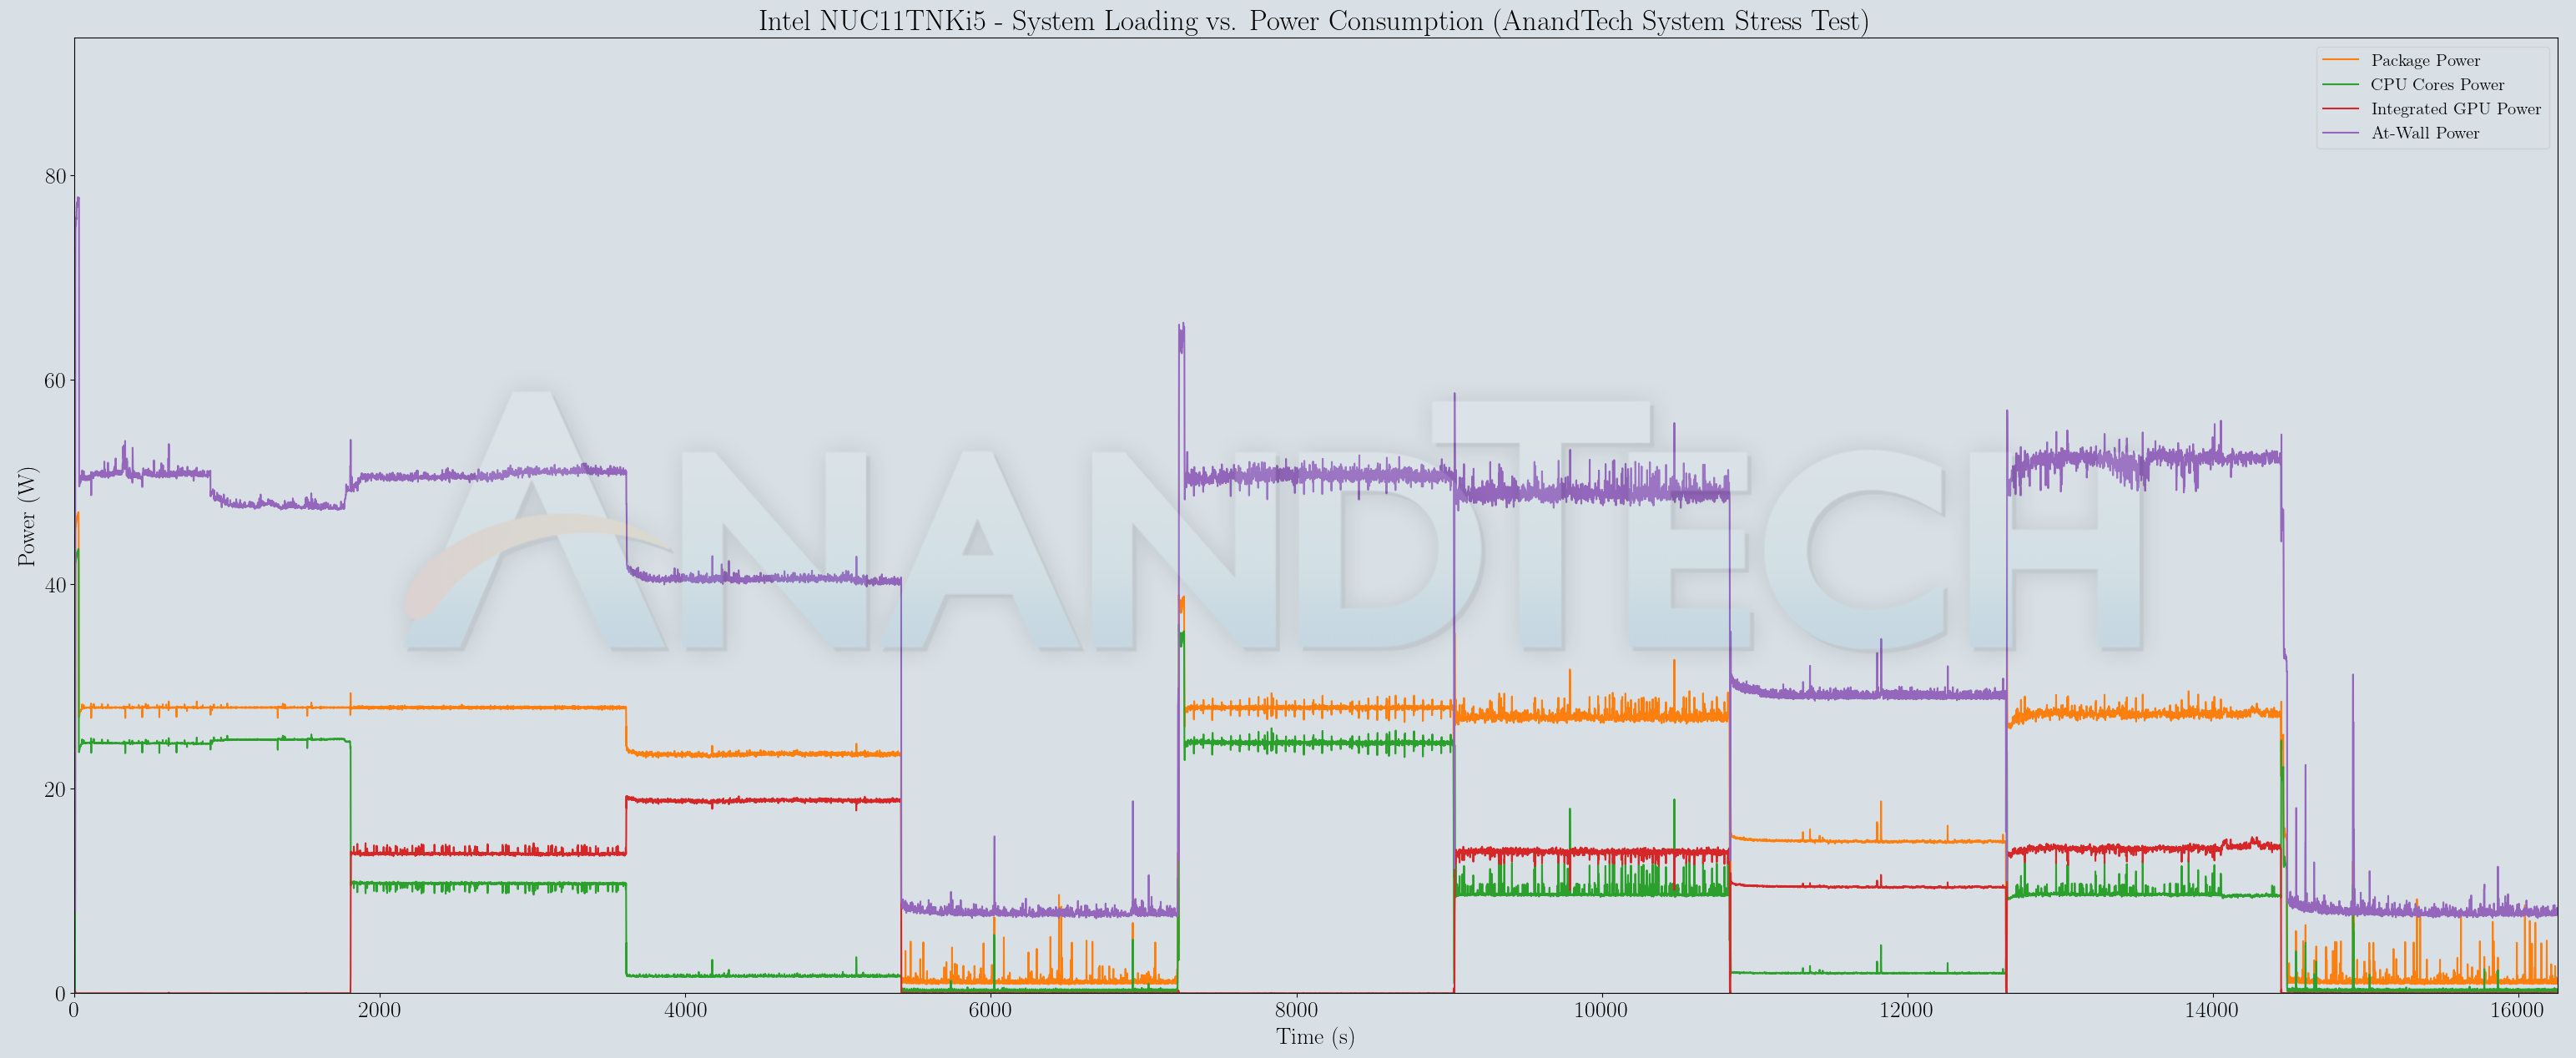
In regions of pure CPU stress, the package power consumption is 28W right through. Addition of workload components like GPU and SSD stressing reduces this number somewhat as CPU cycles are spent controlling those peripherals also. For the GPU in particular, the power balance budgeting between the CPU and the GPU comes into play and prevents the full 28W capacity from being utilized. The maximum allowed GPU power consumption appears to be around 18W.
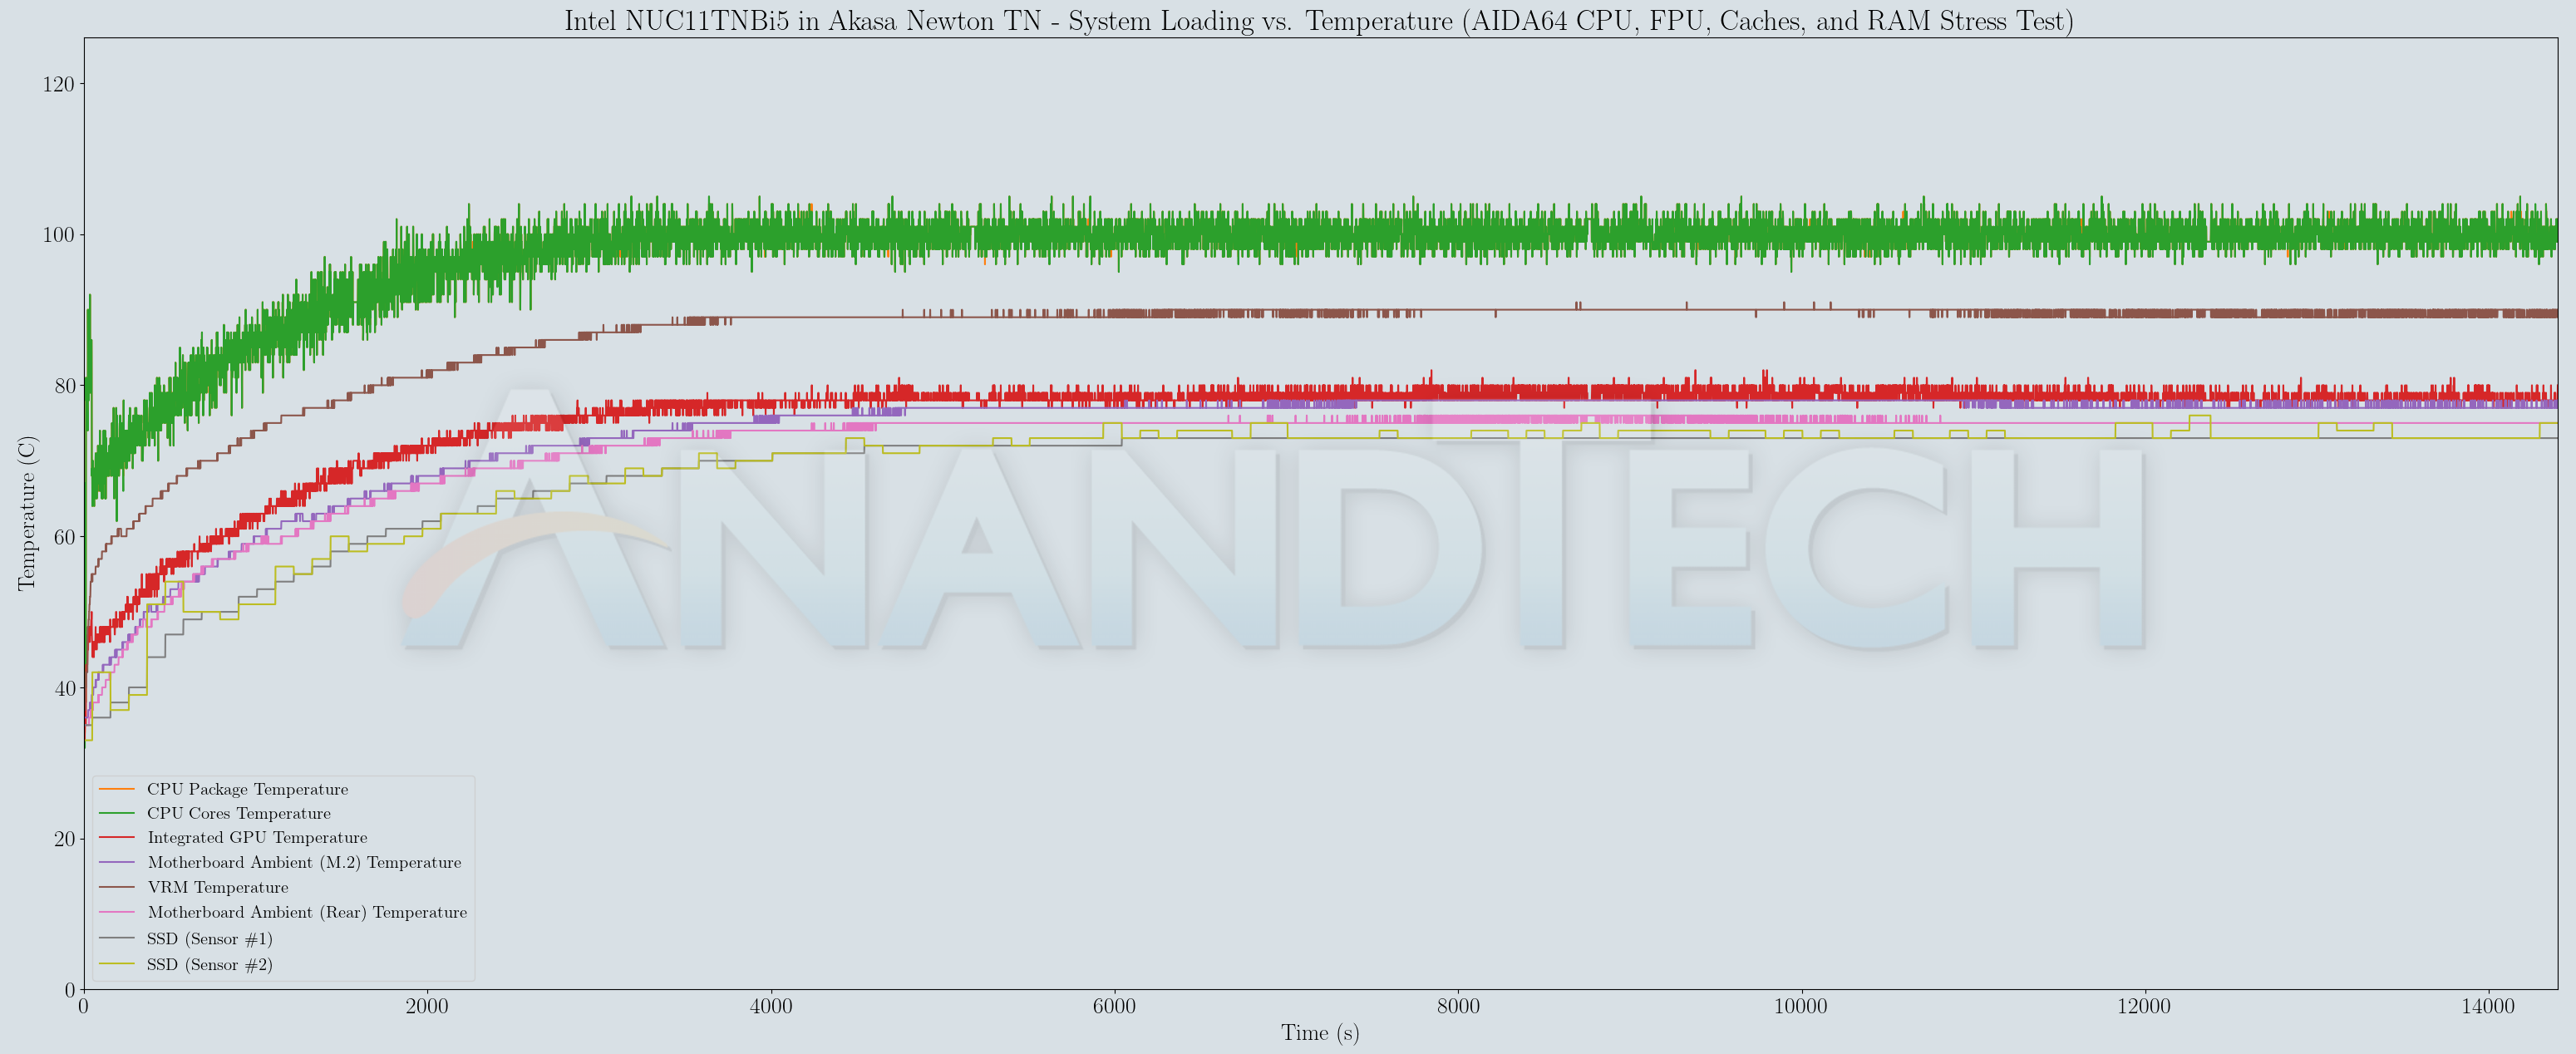
A similar stress sequence was applied to the Newton TN build. Analyzing the temperature graph first, a spike to 90C+ is seen in the beginning. However, the ramp up of the temperature during the Prime95 component is much steeper than the actively cooled version. The temperature during the Furmark-only segment reaches around 94C, but was still short of the junction temperature (105C). On the other hand, during first AIDA64 SST stress segment, the temperatures seemed to touch 102C and was still ramping up when the 30 minutes allotted to the segment had elapsed. While the VRM circuitry remained under safe limits (a maximum of 92C and stabilized), the SSD hit 86C during the stress test.
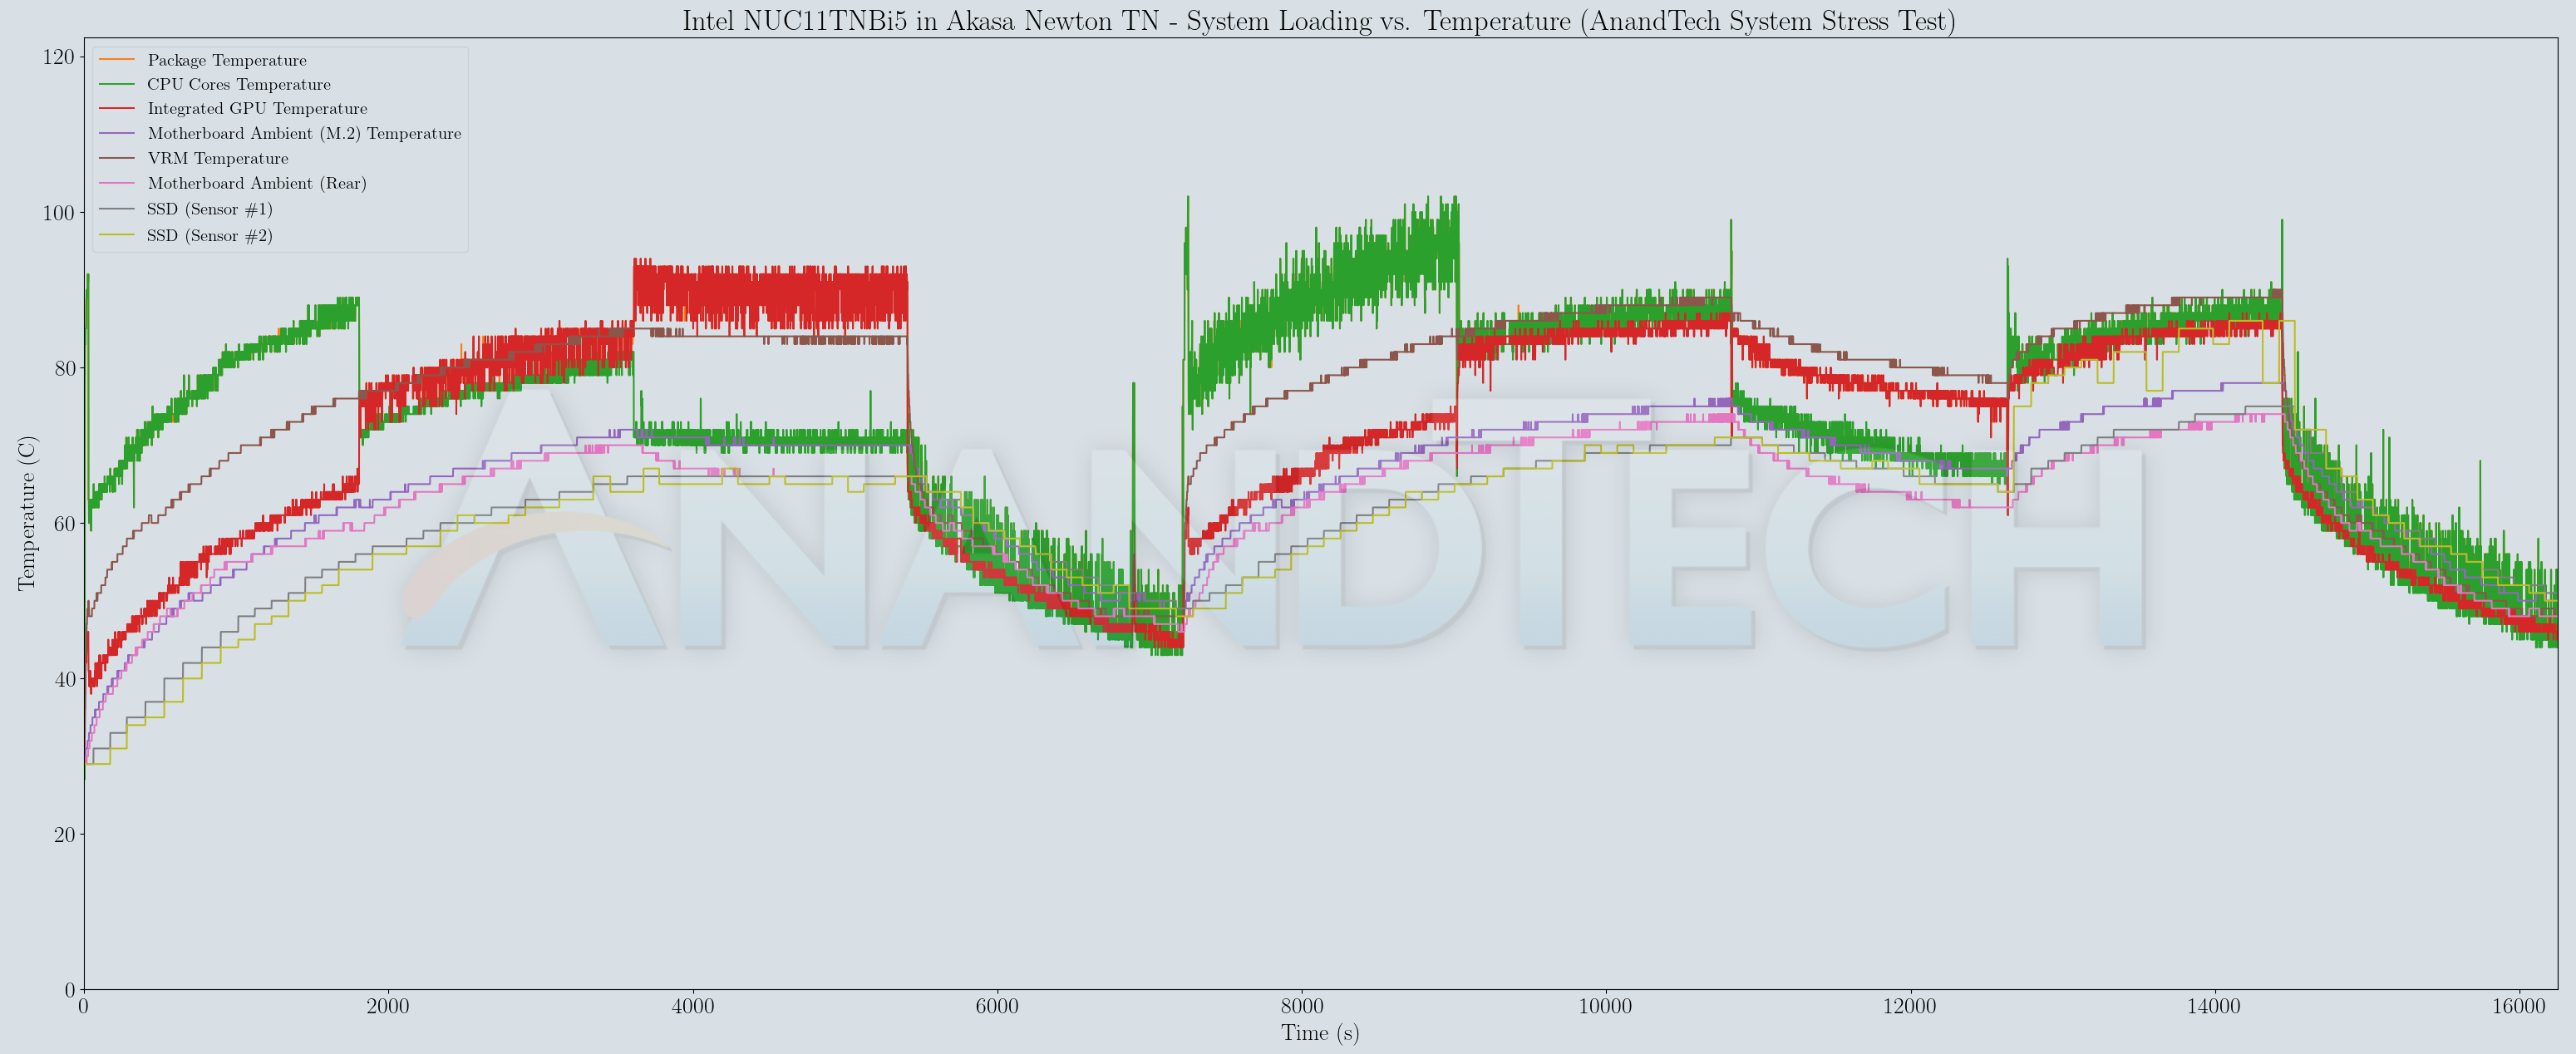
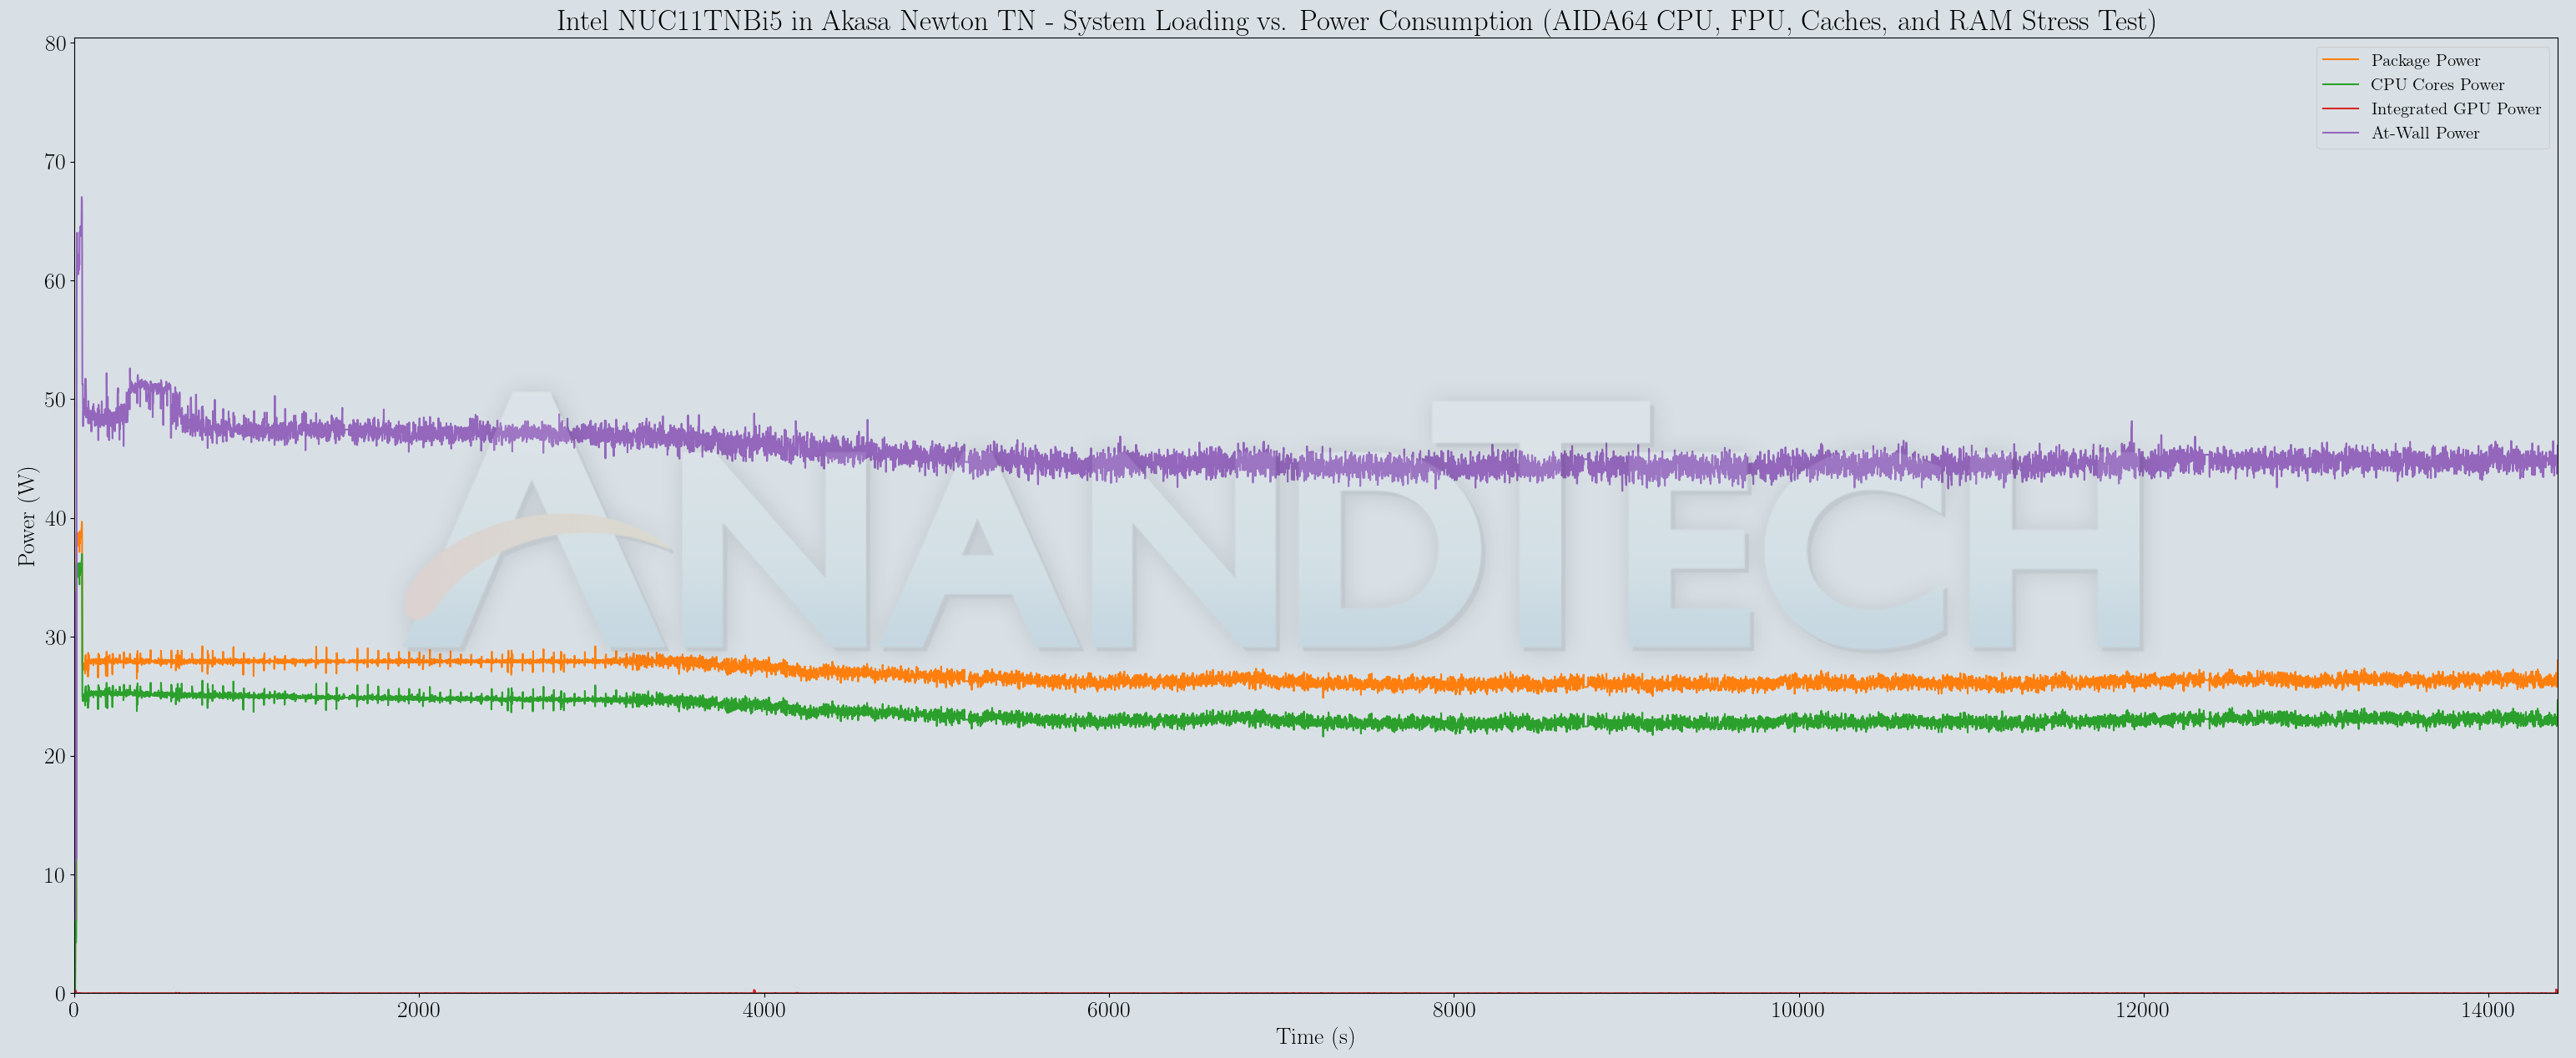
The temperatures recorded above appear to get stabilized within 30 minutes for all workloads except the AIDA64 SST’s first segment. In this context, the package power numbers would be interesting to analyze. We look at the collected power numbers below.
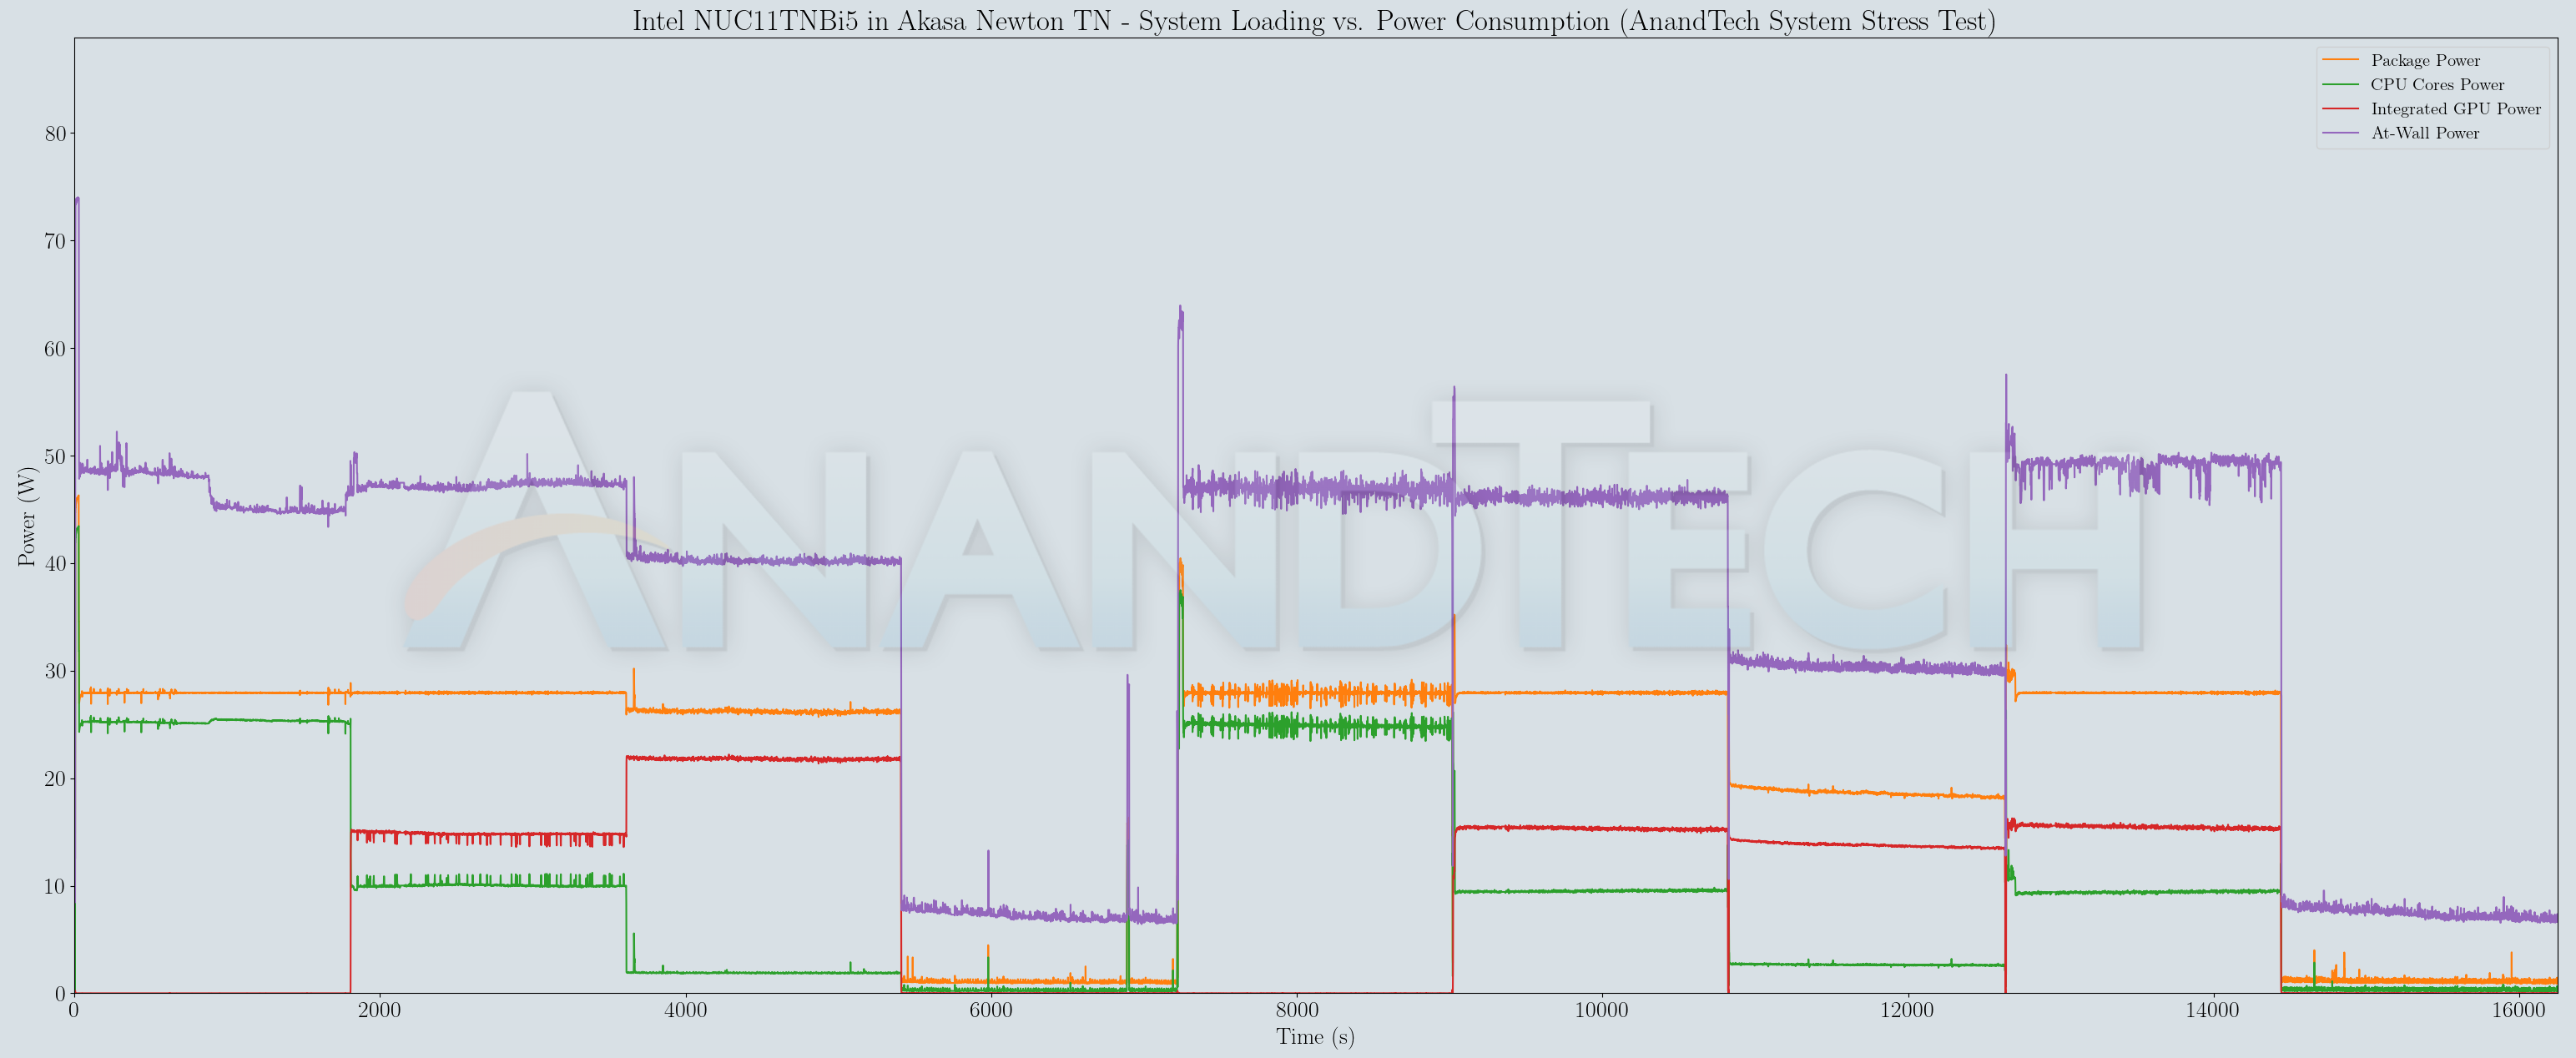
The power numbers reveal interesting aspects. The package power numbers for simultaneous Prime95 and Furmark remains solid at 28W, but the package temperature had started flattening around 86C. On the other hand, the first segment of AIDA64 SST also has a package power of 28W, but the temperature peak was 102C, and was still ramping up after 30 minutes. It appears that the case would eventually throttle the CPU assuming an extended duration for this stress segment. To analyze this further, we configured the segment to run alone for 4 hours while recording the same parameters.
As expected, the junction temperature (105C) was hit around 1 hour into the stress test and throttling kicked in to drop the package power and keep the package temperature around 100C. The package temperature oscillated between 25W and 26W during this duration. As an additional experiment, we repeated the same stress test after setting the PL1 limit to 25W in the BIOS.
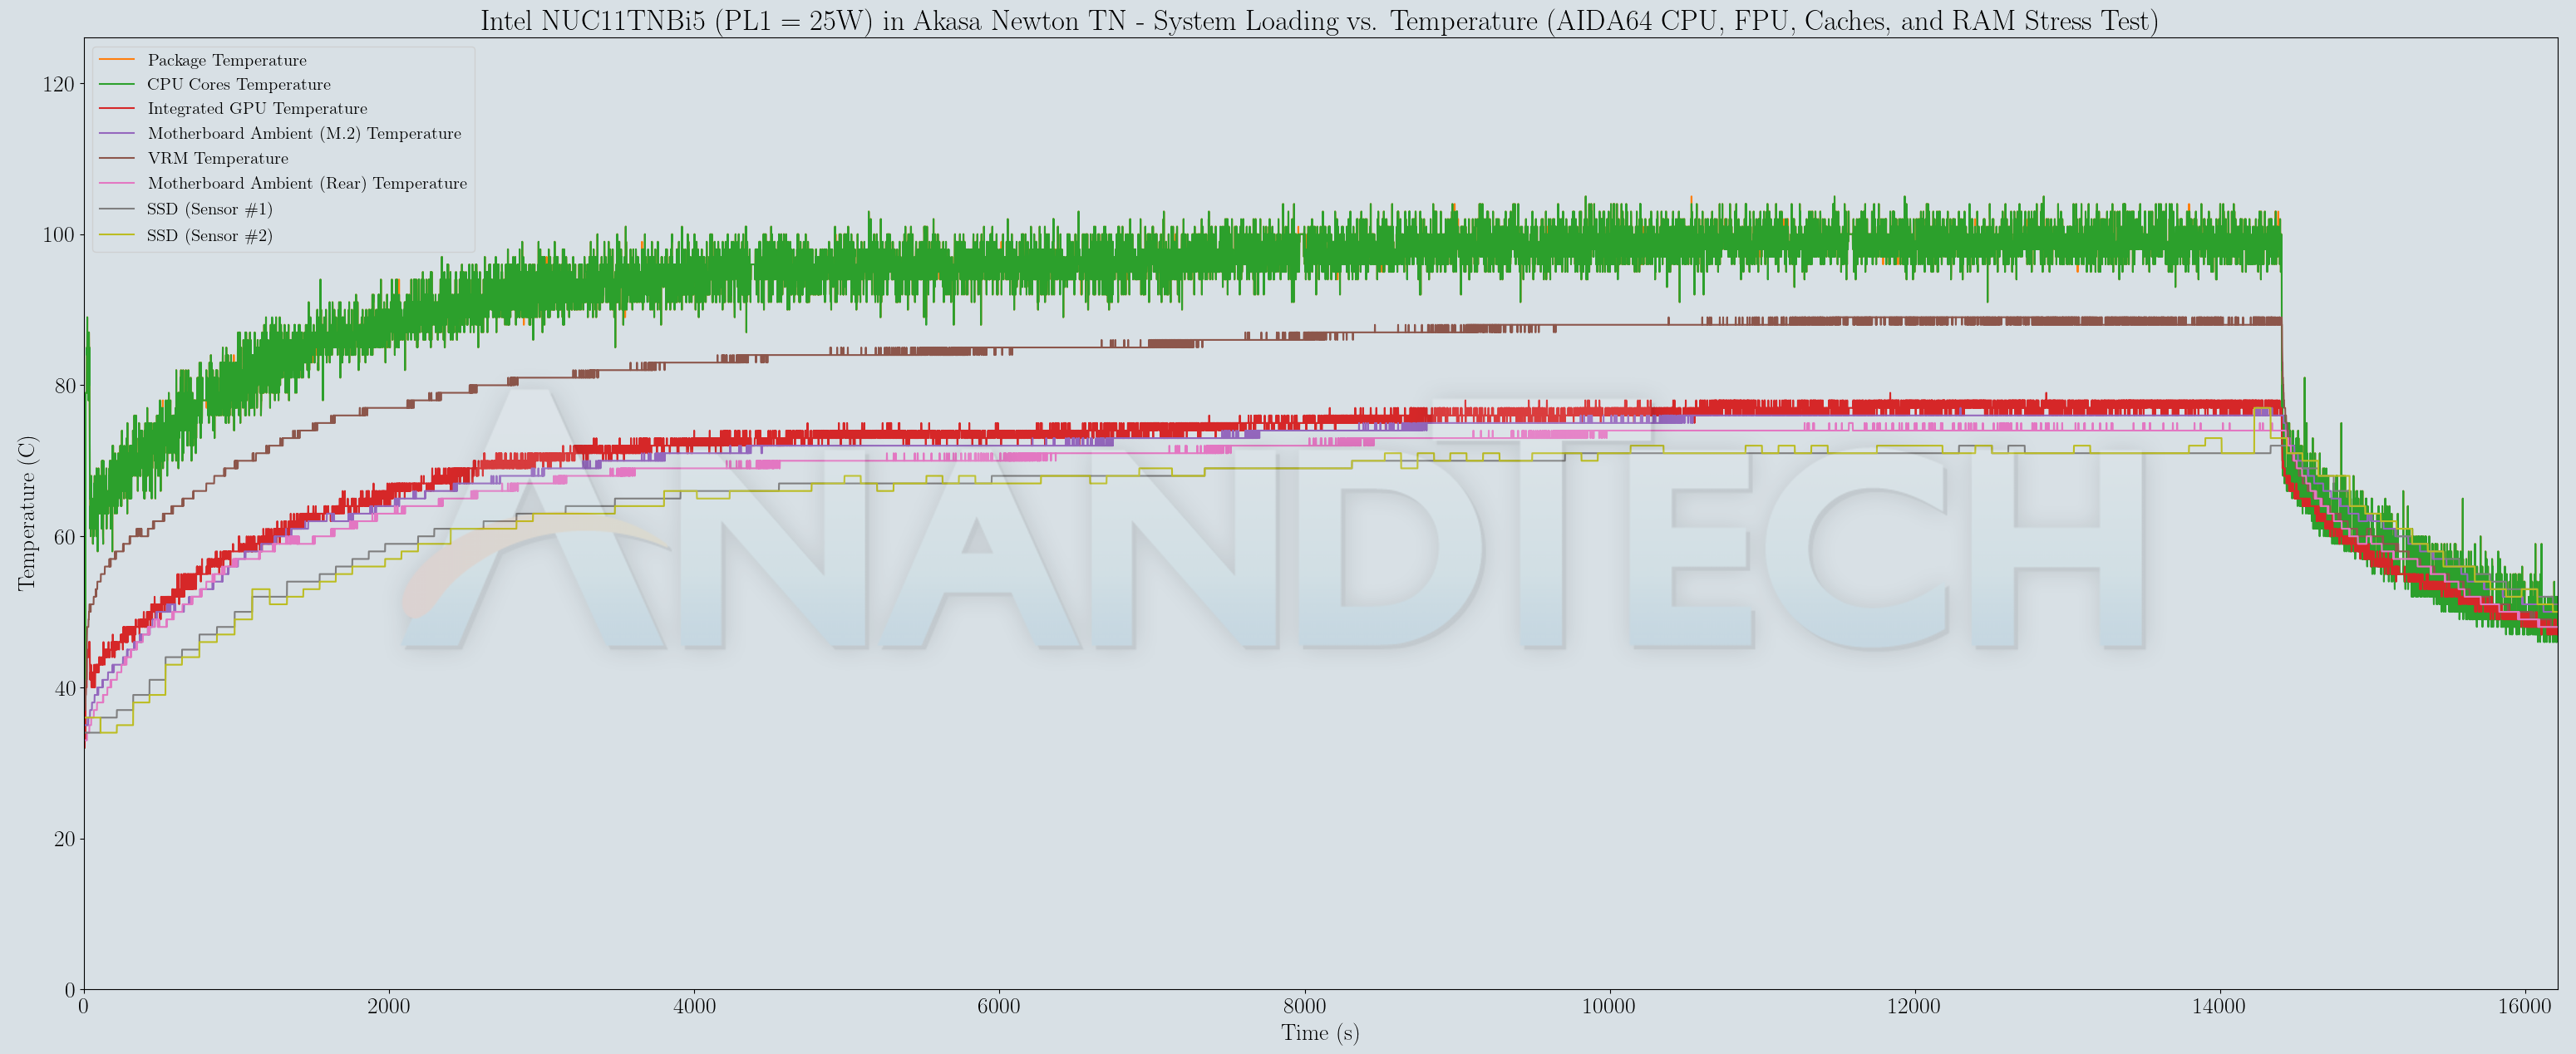
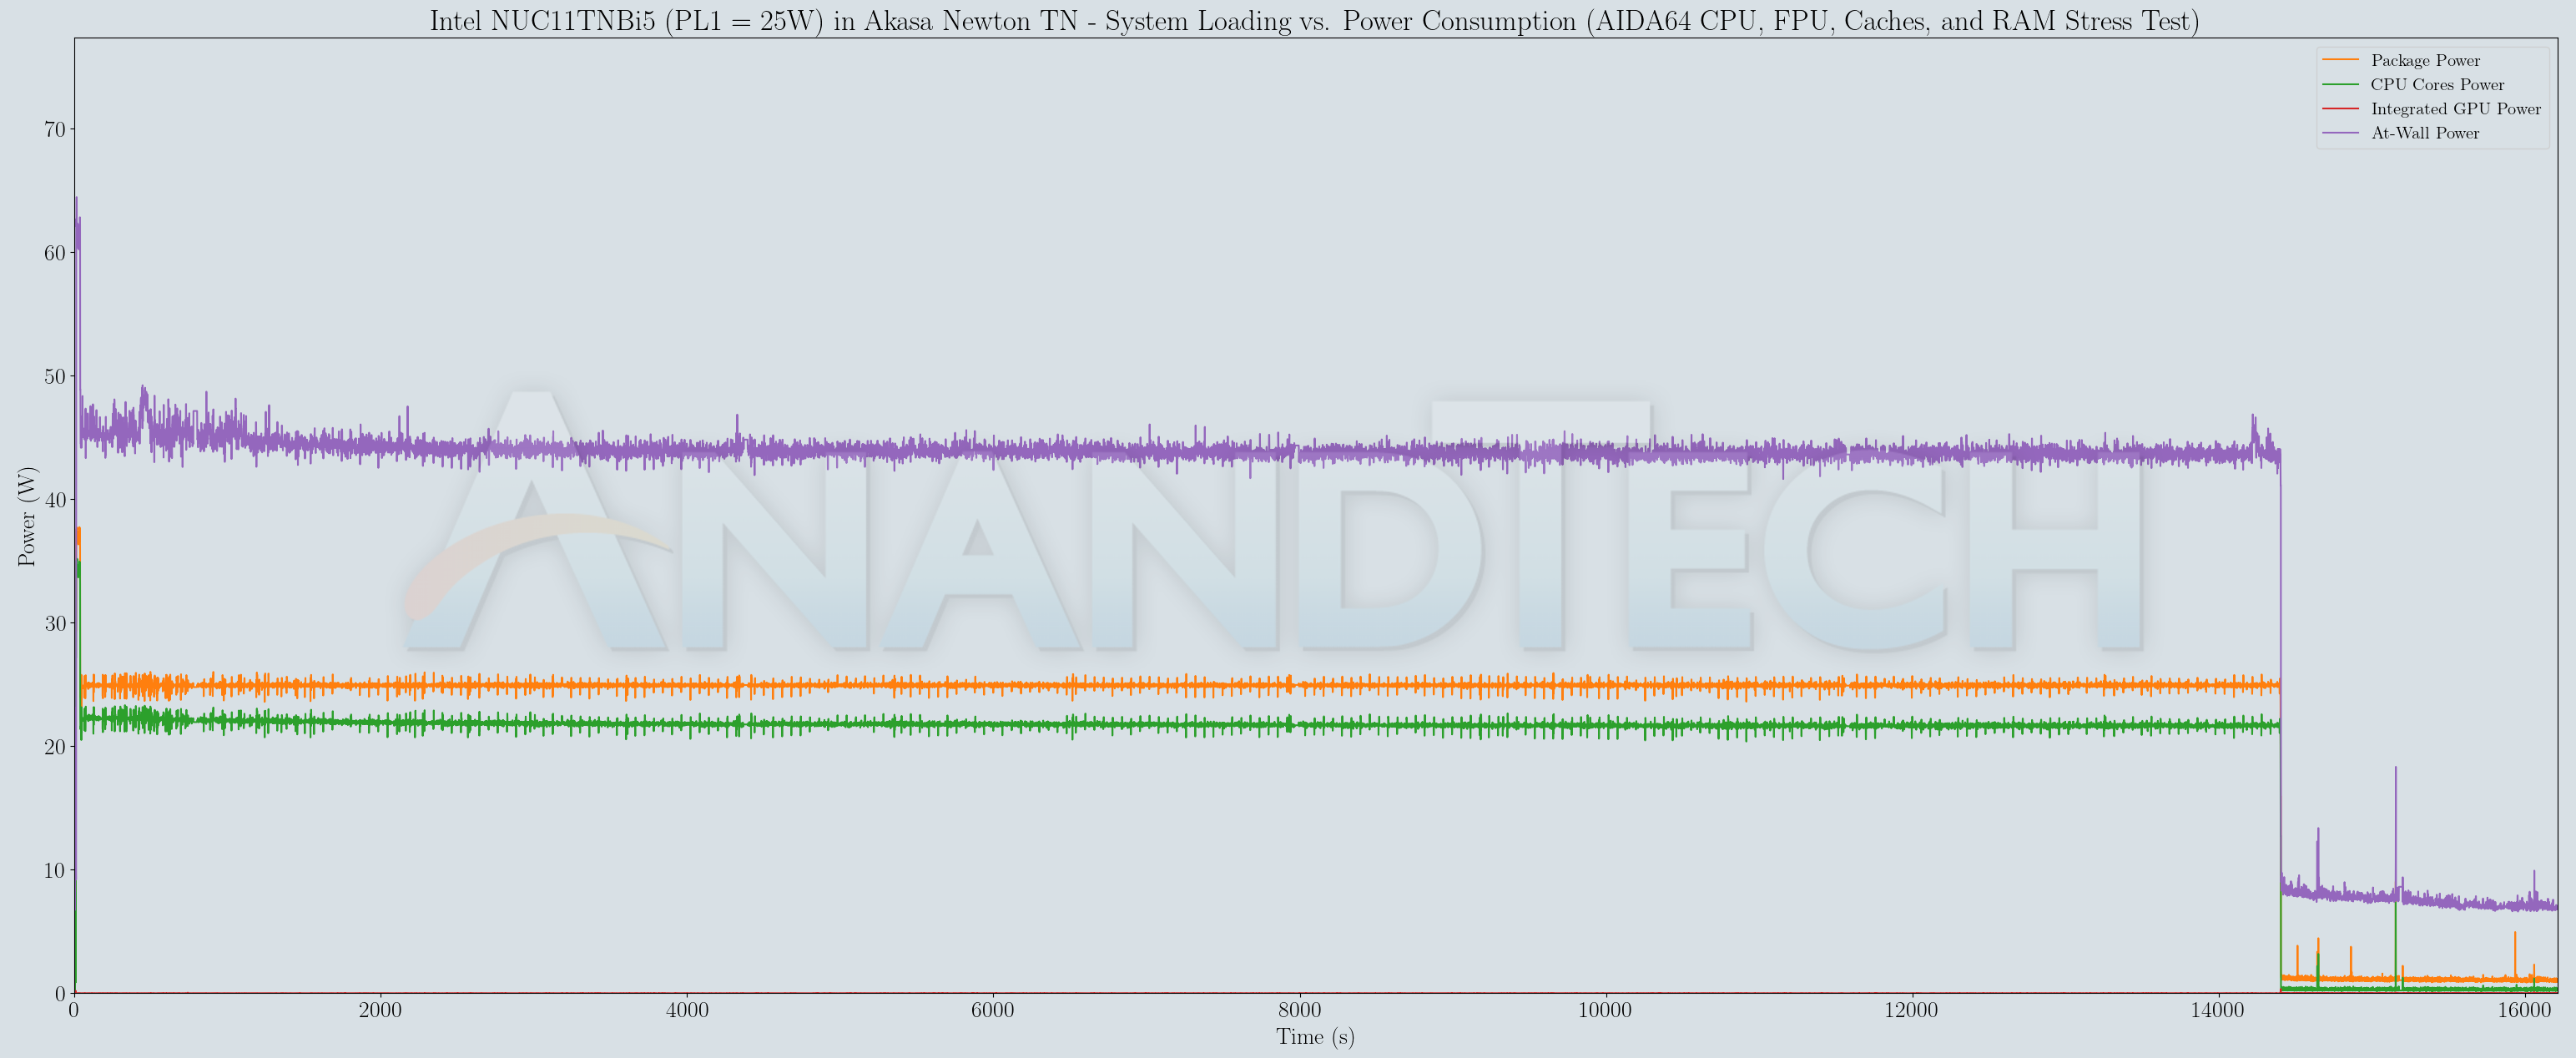
Unfortunately, even with a PL1 of 25W, the junction temperature was still hit around 165 minutes into the test. This indicates that the problem is not one of handling a 28W TDP – rather it is an issue of drawing away the heat from a particular hot spot on the package that is triggered explicitly by the AIDA64 CPU, FPU, Caches, and RAM stress test.
Thermal Profile
One of the key aspects of fanless systems is the thermal profile under load. Our stress test saw the internal package temperature go as high as 105C. However, even with the package temperature oscillating around that mark, the highest temperature we recorded deep inside one of the ridges was just 70C. A FLIR One Pro thermal camera was used for this purpose.
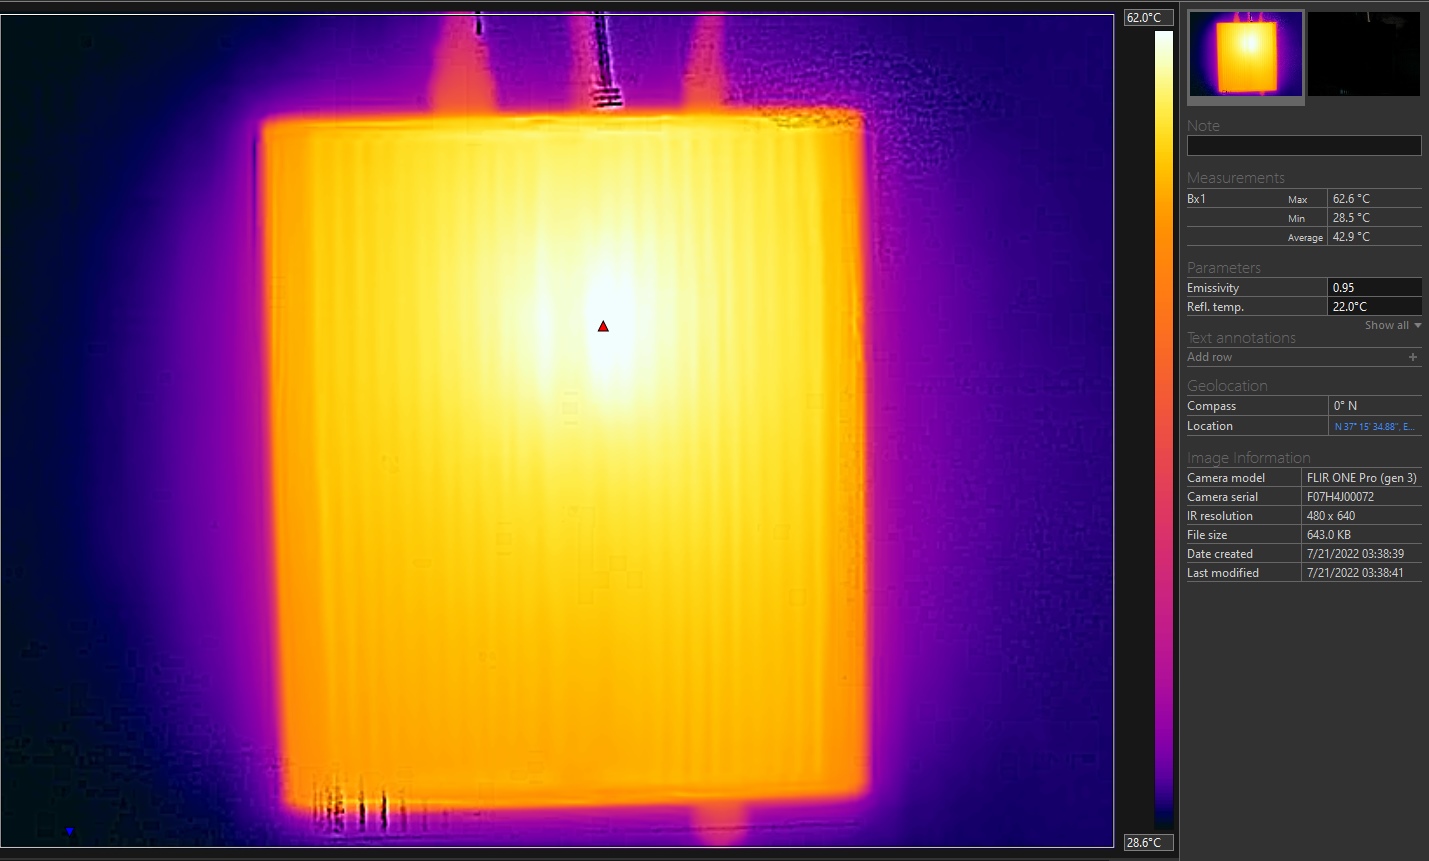
The gallery below presents some of the other thermal pictures gathered during the course of the four hour stress test which managed to hit the junction temperature. The numbers in the pictures show that the chassis is not heat saturated.


The case itself is more than capable of handling a 28W TDP processor. However, that is only half the story. On both the processor package and SSD fronts, it is disappointing to see that the solution is not able to draw heat away quick enough for specific workloads. Eventually, throttling is forced to come into the picture.
Networking and storage are aspects that may be of vital importance in specific PC use-cases. The Intel NUC11TNKi5 comes with a 2.5 GbE port that carries over to the Newton TN build too. However, the WLAN solution – Intel Wireless AX201 – needs an additional purchase. An U.FL IPEX MHF4 to RP-SMA antenna connector adapter cable bundled with Wi-Fi antennae (such as the one here) is needed. The WLAN interface is available to the OS even without this add-on, but the signal pick up is too weak to be of any practical use. The Newton TN has antenna holes in the rear panel to accommodate the RP SMA connector.
On the storage side, our review sample of the NUC11TNKi5 was configured with a high-performance Samsung SSD 980 PRO. We carried that over to the fanless Newton TN build. From a benchmarking perspective, we provide results from the WPCstorage test of SPECworkstation 3.1. This benchmark replays access traces from various programs used in different verticals and compares the score against the one obtained with a 2017 SanDisk 512GB SATA SSD in the SPECworkstation 3.1 reference system.
| SPECworkstation 3.1.0 – WPCstorage SPEC Ratio Scores | |||

The graphs above present results for different verticals, as grouped by SPECworkstation 3.1. The storage workload consists of 60 subtests. Access traces from CFD solvers and programs such as Catia, Creo, and Soidworks come under ‘Product Development’. Storage access traces from the NAMD and LAMMPS molecular dynamics simulator are under the ‘Life Sciences’ category. ‘General Operations’ includes access traces from 7-Zip and Mozilla programs. The ‘Energy’ category replays traces from the energy-02 SPECviewperf workload. The ‘Media and Entertainment’ vertical includes Handbrake, Maya, and 3dsmax. Given that the comparison is between a wide range of SSDs in the systems – including both Gen 3 and Gen 4 NVMe, as well as SATA , the relative numbers for most workloads are not surprising.
The disappointing aspect, however, is the loss of performance in moving from an actively cooled system to the passively cooled one. One would assume the cause to be SSD throttling, based on the temperatures observed in the AIDA64 SST. To get to the bottom of the issue, we ran the benchmark while monitoring key parameters with HWInfo.

Strangely, the loss of performance appears to be due to sudden spikes in the CPU package temperature. The SSD itself remains quite cool, with a maximum of just 57C.
The Intel NUC11TNKi5 provided us with the opportunity to evaluate the Tiger Lake-U platform in a manner intended by Intel. Our previous evaluations involving the ASRock Industrial NUC BOX-1165G7 and Supermicro’s SYS-E100-12T-H had the vendors’ own take on configuring the system for specific markets. Intel’s NUC Pro line targets the typical home / business PC user. Comparing Intel’s default BIOS configuration with that of ASRock Industrial and Supermicro enabled us to understand the various options affecting the performance and efficiency of the system. It goes without saying that Intel’s configuration of PL1 and PL2 limits, as well as configuration of C-states, provides the best balance between performance and energy consumption. As a mid-tier offering, the Core i5-1135G7-based NUC we looked at today completely blew away the competition in its price range. Multi-threaded workloads continue to remain a weakness when compared against high-end Renoir SKUs. At the lower TDPs, TGL-U has the distinct disadvantage of not having enough cores to go ahainst the top-end Renoir-based UCFF PCs. However, user experience continues to rely a lot on single-threaded performance. This is evidenced by the results of some of the key real-world benchmarks (such as web browsing) going in favor of Tiger Lake-U. In any case, the market will soon see Cezanne and Alder Lake-P dueling it out in the mini-PC space – so this just sets some context for those comparisons.
CPU performance is only one of the aspects to consider in computing systems meant for home and business use. In terms of connectivity and I/O options, the NUC11TNKi5 leaves other mini-PCs far behind. Dual Thunderbolt 4 ports mean that a host of high-performance connectivity options are just a dongle or dock away. While taking advantage of PCIe 4.0 in the UCFF form-factor is a bit of a challenge, it can nevertheless deliver benefits in specific storage-centric workloads.
Our experience with Akasa’s Turing chassis for the Bean Canyon NUC had greatly raised our expectations when we were in the process of integrating the NUC11TNBi5 into the Akasa Newton TN fanless case. Our initial experience was very good – the case was actually quite cool to touch, and the package temperature was in the high 30s after the system was left idling at the desktop for more than 15 minutes. Most of our real-world benchmarks showed very little difference when compared against the actively-cooled version’s results. Even in our stress test, the unit managed to escape throttling even though it brushed the junction temperature dangerously towards the end of the particularly strenuous workload component. Eventually, we did draft an extended version of the test to make the unit throttle. The thermal solution for the SSD also leaves a bit to be desired – the two thermal pads and the metal block aid in the SSD making contact with the metal chassis. However, it is not enough to prevent the SSD from touching 85C+ under sustained read-intensive workloads.
Our detailed tests revealed that the CPU throttling issue is not one of the chassis being able to handle the 28W PL1 settings – we were able to replicate the problem even with a 25W PL1. Rather, it appears that certain workloads create hotspots that the thermal design is not able to draw the heat away from sufficiently quickly. We saw that in one of the AIDA64 SST components, and also during the WPCStorage component of the SPECworkstation 3.1 benchmark. Likely causes for this issue include the thermal paste not having enough thermal conductivity (2.9 W/mK appears to be on the low end compared to what we usually see in thermal compounds used with desktop CPU coolers), or the use of aluminum against copper for the block transferring the heat away from the processor package. It could also be due to my own user error in doing a poor paste job. I have reached out to Akasa to check on this aspect. Overall, whether such CPU throttling cases arise frequently enough for it to matter in day to day usage as a home or business PC is up for debate, as the Newton TN otherwise maintains an excellent thermal profile.

A comparison of the Akasa Newton TN to the Turing is inevitable. They do have vastly different form-factors. However, the Turing definitely performed better in our thermal evaluation a couple of years back. One of the contributing factors in that could be sheer mass – the Turing with the board installed (and no 2.5″ drive) clocks in at 2618g, while the Newton TN with a similar board configuration clocks in at just 1572g. The form-factor of the Turing also allows for more surface area for the heat to be dissipated. That said, there are a few advantages for the Newton TN – it can be VESA mounted, and it integrates additional I/O compared to the standard kit. In fact, the extra USB 2.0 ports come in handy for connecting various HID peripherals that do not require much bandwidth. Enabling the serial port functionality can also expand the target market for the chassis.
In terms of scope for improvement, one obvious aspect would be better thermal performance. Akasa can also attempt to add I/O diversity to the front panel with USB hub chips similar to what’s done by Intel in their Extreme NUCs. Overall, the Akasa Newton TN is an effective solution to create a silent Tiger Canyon NUC while expanding the I/O functionality of the standard kit. Purely based on our experience with the original Akasa Turing / Bean Canyon NUC, we recommend the Akasa Turing TN if the form-factor or the VESA mounting capabilities or expanded I/O functionality are not a must for the deployment under consideration.