ASRock Industrial NUC BOX-1260P and 4X4 BOX-5800U Review: Alder Lake-P and Cezanne UCFF Faceoff
2022-08-05The past few years have seen Intel and AMD delivering new processors in a staggered manner. In the sub-45W category, Intel’s incumbency has allowed it to deliver products for both the notebook and ultra-compact form factor (UCFF) within a few months of each other. On the other hand, AMD’s focus has been on the high-margin notebook market, with the chips filtering down to the desktop market a year or so down the road. In this context, AMD’s Cezanne (most SKUs based on the Zen 3 microarchitecture) and Intel’s Tiger Lake went head-to-head last year in the notebook market, while Rembrandt (based on Zen3+) and Alder Lake-P are tussling it out this year. In the desktop space, Cezanne-based mini-PCs started making an appearance a few months back, coinciding with the first wave of Alder Lake-P systems.
ASRock Industrial has the reputation of being one of the first vendors to launch UCFF systems based on the latest available processors from both Intel and AMD. We had reviewed their NUC BOX-1165G7 as our first Tiger Lake-U mini-PC, and the 4X4 BOX-4800U was one of the earliest Renoir-based desktops. The company is continuing the tradition with the NUC BOX-1200 series for Alder Lake-P and the NUC 4X4 BOX-5000 series for Cezanne, with the product announcements coming within a month of each other.
The company sent over the flagship models in both lineups for review, giving us a chance to evaluate the performance and value proposition of the NUC BOX-1260P and 4X4 BOX-5800U. The review below provides a detailed hands-on comparison of the two models. It also brings out various configurable aspects that can be tweaked by the vendor and/or end-user in order to extract the maximum possible performance within the form-factor constraints. In that process, we also gain insights into what helps ASRock Industrial introduce mini-PCs based on the latest processors well ahead of its competitors.
Intel introduced heterogeneous computing into its product line with a mixture of performance (P) and efficiency (E) cores in Alder Lake last year. While the desktop line was first out of the door, Intel followed up with the sub-35W processors in February 2022. Fabricated in Intel 7, Alder Lake brings a multi-tasking focus to computing, providing hints to the OS on where different tasks need to be run. Overall, this is supposed to bring in an better user experience – and the Alder Lake-P series is supposed to deliver all that within a 28W power envelop. On the other hand, AMD’s Cezanne was announced in early 2021, bringing the Zen 3 microarchitecture into the notebook space. The 8C/16T configuration of homogeneous high-performance cores provides it the edge in multi-threaded workloads over Intel’s solutions.
Despite the introduction of the solutions more than a year apart, the ultra-compact form-factor and small form-factor desktop systems utilizing these processors have started getting into the market around the same time. Both Cezanne and Alder Lake-P utilize an updated microarchitecture, promising a healthy performance boost over the previous generation. The integrated GPU is also clocked higher. On the system front, the high-speed I/O options get carried over from Renoir and Tiger Lake – Cezanne continues to retain PCIe 3.0 lanes for storage, and supplies only USB 3.2 Gen 2 (10 Gbps) ports for high-bandwidth external peripherals. In contrast, Alder Lake-P provides four dedicated CPU-connected PCIe 4.0 lanes for storage drives, and two Thunderbolt 4/USB4 ports for external peripherals. Aspects requiring a deeper look include system performance for various types of workloads and power / energy consumption profiles.
ASRock is a well-known vendor in the consumer PC market. In 2011, the company set up the ASRock Industrial business unit to focus on industrial motherboards. The division branched out in 2018 as an independent vendor with exclusive focus on B2B products. The company has products for deployment in small businesses (offices), automation, robotics, security, and other industrial / IoT applications. Primarily, the company develops motherboards, and sells them to various system integrators who can do their own value additions. Additionally, the company also sells mini-PCs based on the developed motherboards into the retail channel.
ASRock Industrial sampled their flagship models in the Alder Lake-P (NUC BOX-1260P) and Cezanne (4X4 BOX-5800U) lineups. It is rare that two flagship products come in for review simultaneously – so we took the opportunity to evaluate them in parallel.
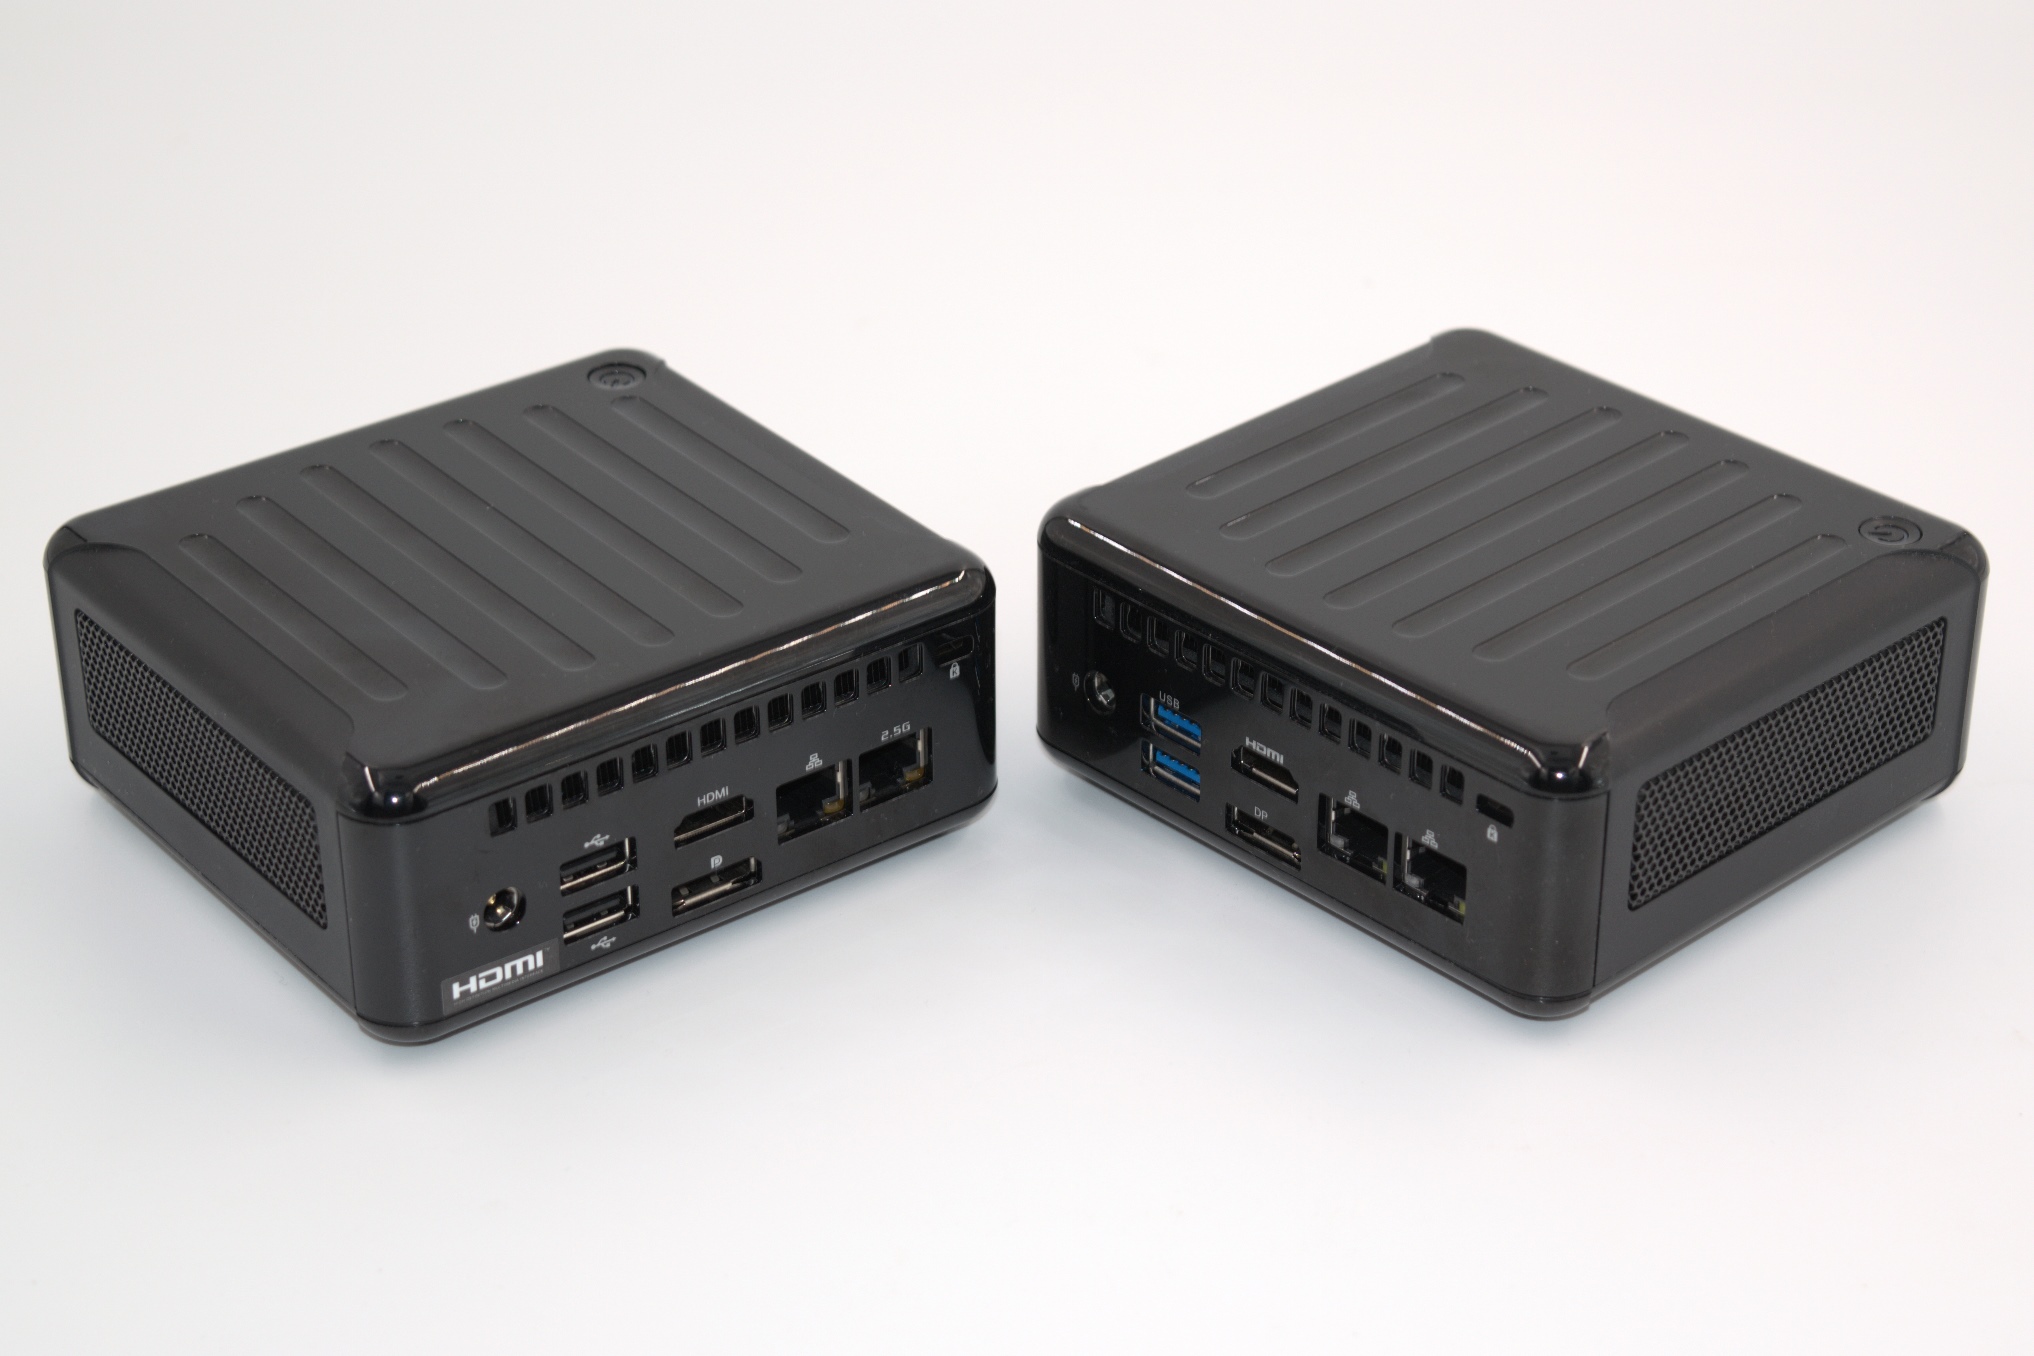
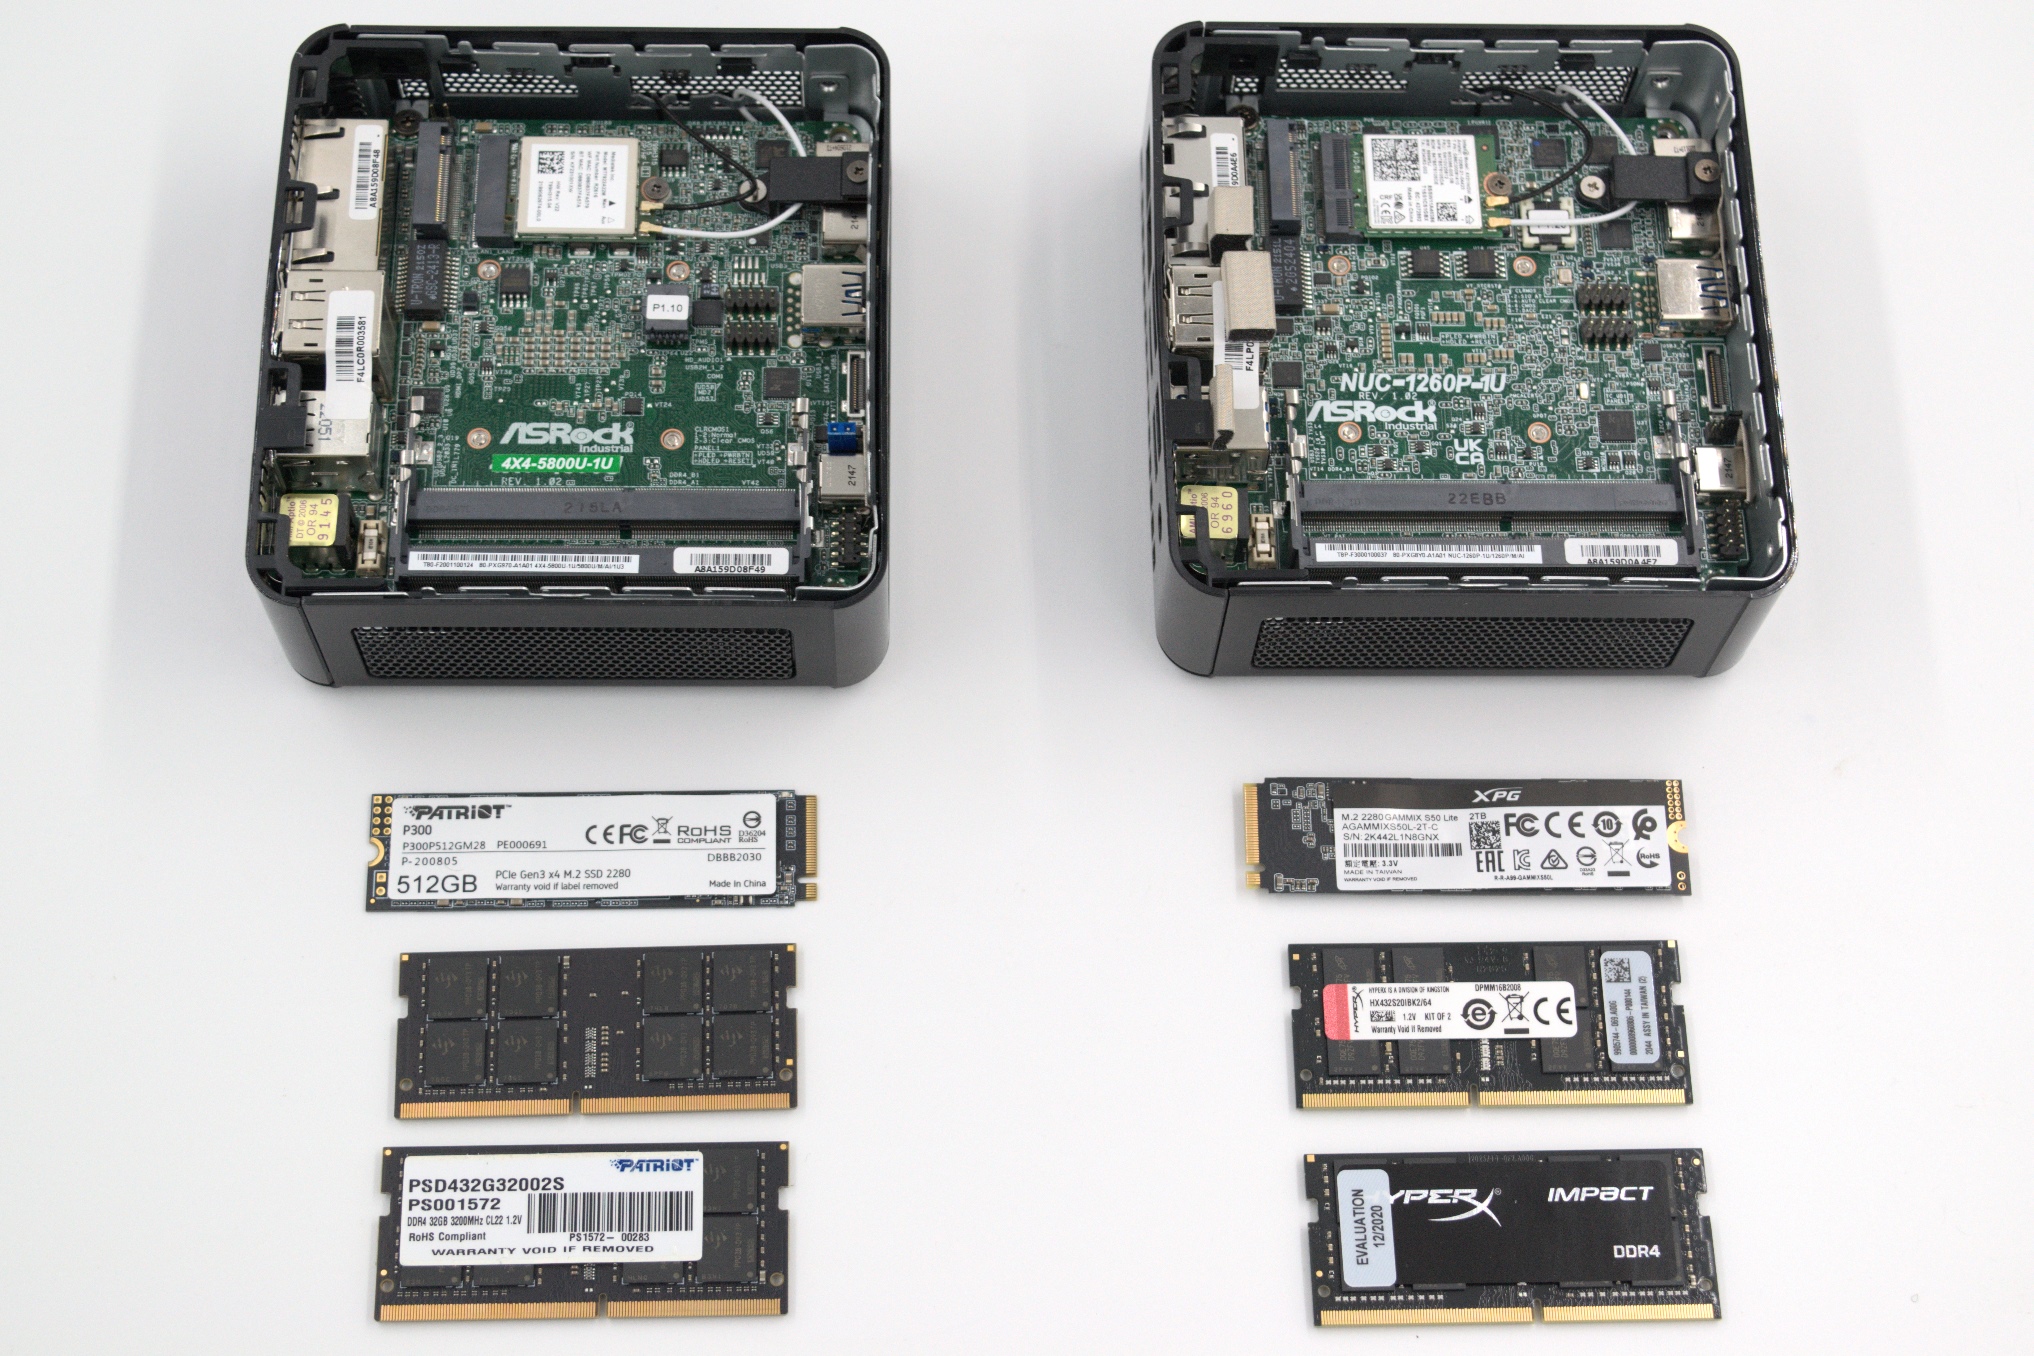
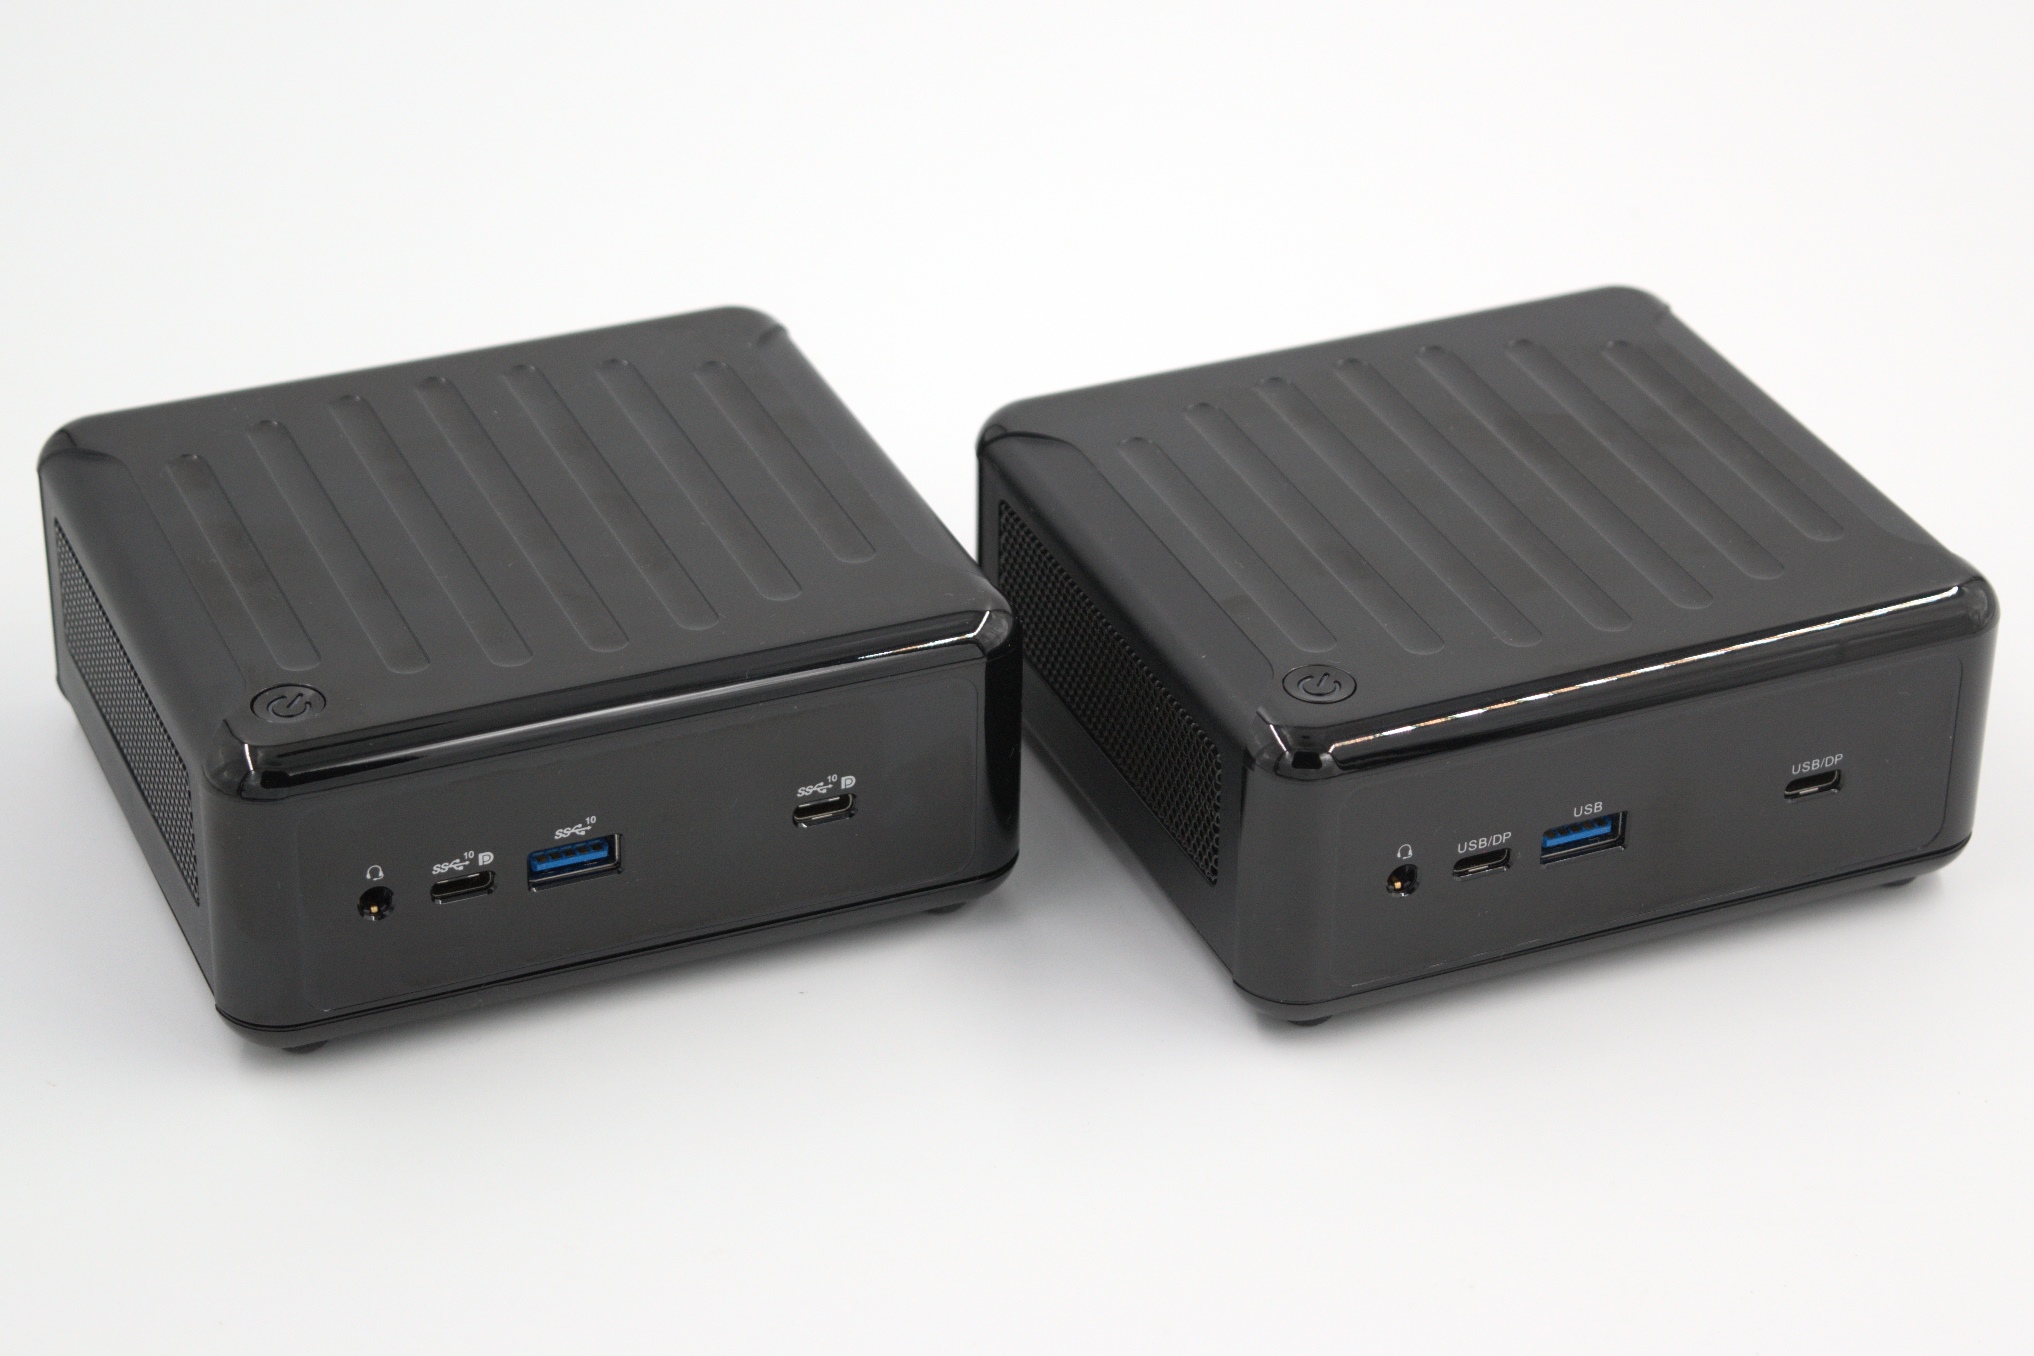
As a reminder, the NUC BOX and 4X4 BOX series both use a chassis tracing its roots back to ASRock’s now defunct Beebox product line. The cooling solution is time-tested within that case design, and all that ASRock Industrial does is to alter the I/O cut-outs slightly to match different motherboards. As the above photograph shows, it is difficult to differentiate between the two systems at first glance, as the cut-outs are exactly the same (in fact, the previous-generation NUC BOX-1165G7 and 4X4 BOX-4800U are the same too). Only on a closer look does the presence of two black USB 2.0 ports in the rear I/O of the 4X4 BOX-5800U (compared to the blue USB 3.2 Gen 2 ports in the NUC BOX-1260P) serve as a differentiating factor.
ASRock Industrial’s main focus is on B2B customers. It is no surprise that their systems are packaged in a nondescript manner. However, within the package, the company includes everything that an end-user would need – a VESA mount and associated screws, 2.5″ drive and M.2 SSD installation aids, a geo-specific power cord and a 90W power adapter.
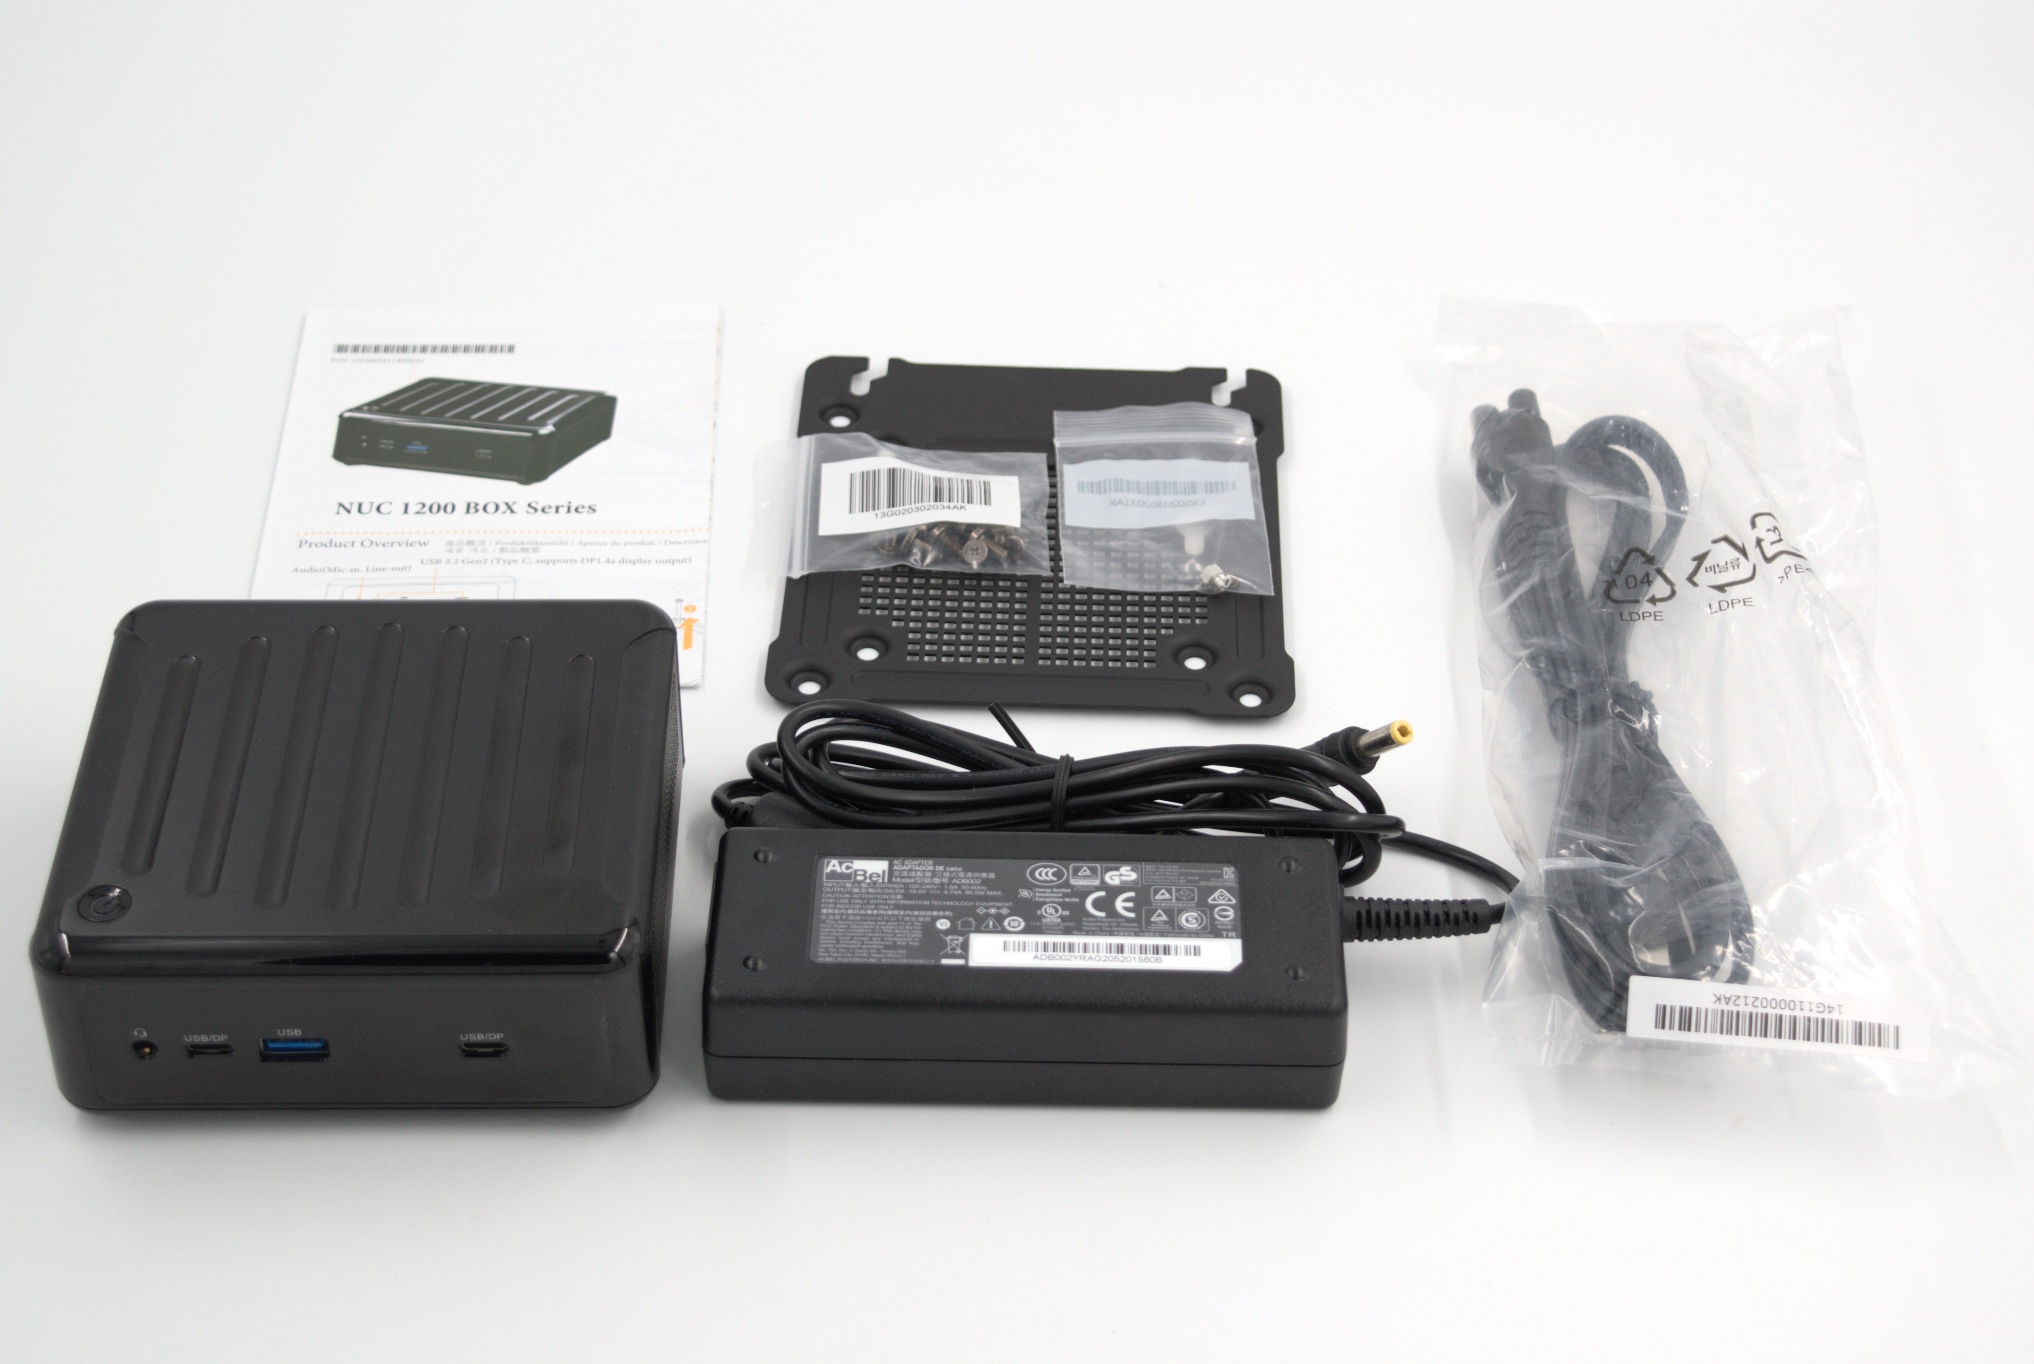
ASRock Industrial NUC BOX-1260P Package Contents
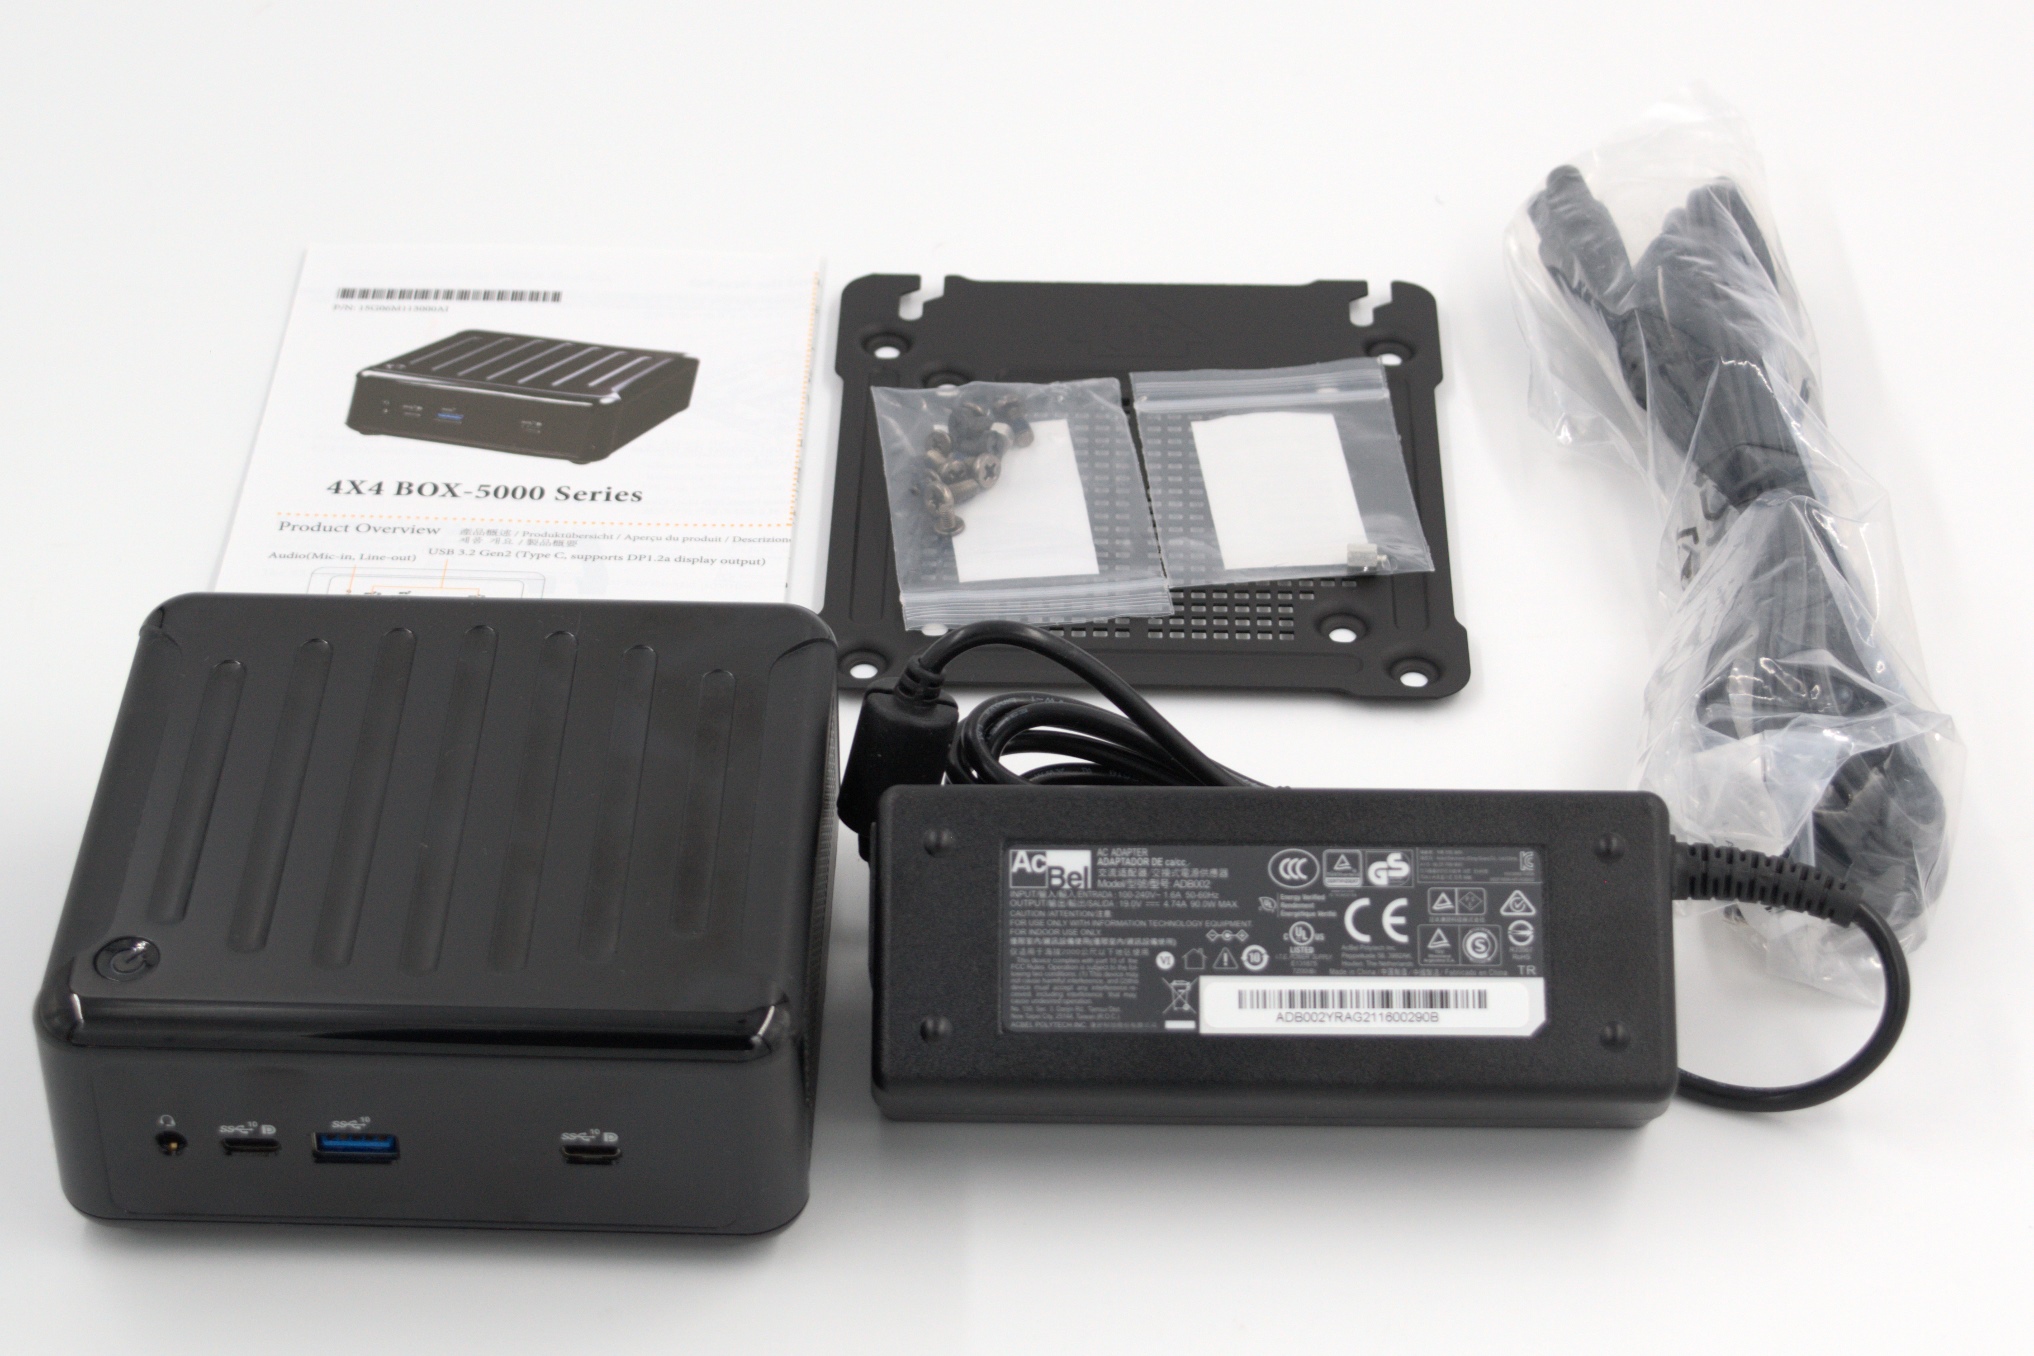
ASRock Industrial 4X4 BOX-5800U Package Contents
Since our sample of the NUC BOX-1260P was an early engineering sample, it didn’t have the model number markings on the underside (unlike the 4X4 BOX-5800U). Both samples were barebones – the RAM and disk drive are left to the discretion of the end-user. In order to make an apples-to-apples comparison, we opted to utilize the same set of components used in the reviews of the company’s systems based on Tiger Lake-U and Renoir. The NUC BOX-1260P was equipped with an ADATA XPG GAMMIX S50 Lite and 2x 32GB of the Kingston FURY Impact DDR4-3200 SODIMMs. A Patriot Memory P300 SSD and 2x 32GB Patriot Memory DDR4-3200 SODIMMs were installed in the 4X4 BOX-5800U for evaluation.
Beyond the similar build and industrial design, a closer look at the NUC BOX-1260P and the 4X4 BOX-5800U reveal a number of differentiation aspects both internally and externally. They are summarized in the table below. The rationale behind the (BIOS 1.2E) and the (Performance) suffices are covered in the next section.
| Systems Specifications (as tested) |
||
| ASRock NUC BOX-1260P (BIOS 1.2E) | ASRock 4X4 BOX-5800U (Performance) | |
| Processor | Intel Core i7-1260P Alder Lake 4P + 8E / 16T, up to 4.7 GHz (P) up to 3.4 GHz (E) Intel 7, 18MB L2, Min / Max / Base TDP: 20W / 64W / 28W PL1 = 28W, PL2 = 64W |
AMD Ryzen 7 5800U Zen 3 (Cezanne) 8C/16T, 1.9 – 4.4 GHz TSMC 7nm, 16MB L3, 10-25 W (15W) Min / Max / Target TDP : 10W / 54W / 25W-30W |
| Memory | Kingston FURY Impact KHX3200C20S4/32GX DDR4-3200 SODIMM 20-22-22-48 @ 3200 MHz 2×32 GB |
Patriot Memory PSD432G32002S DDR4-3200 SODIMM 22-22-22-52 @ 3200 MHz 2×32 GB |
| Graphics | Intel Iris Xe Graphics (96EU @ 1.40 GHz) |
AMD Radeon Graphics (Renoir) – Integrated (8 CUs @ 2 GHz) |
| Disk Drive(s) | ADATA XPG GAMMIX S50 Lite (2 TB; M.2 2280 PCIe 4.0 x4 NVMe;) (Micron 96L 3D TLC; Silicon Motion SM2267 Controller) |
Patriot P300 SSD P300P512GM28 (512 GB; M.2 2280 PCIe 3.0 x4 NVMe;) (Kioxia BiCS4 96L 3D TLC; Silicon Motion SM2263XT Controller) |
| Networking | 2x 2.5 GbE RJ-45 (Intel I225-LM) Intel Wi-Fi 6E AX211 (2×2 802.11ax – 2.4 Gbps) |
1x 2.5 GbE RJ-45 (Realtek RTL8125) 1x GbE RJ-45 (Realtek RTL8168/8111) Mediatek MT7922 (RZ616) Wi-Fi 6E (2×2 802.11ax – 1.9 Gbps) |
| Audio | Realtek ALC233 (3.5mm Audio Jack in Front) Digital Audio with Bitstreaming Support over HDMI and Display Port |
Realtek ALC233 (3.5mm Audio Jack in Front) Digital Audio with Bitstreaming Support over HDMI and Display Port |
| Video | 1x HDMI 2.0b 1x Display Port 1.4 2x Display Port 1.4 over Type-C Alt-Mode |
1x HDMI 2.0a 1x Display Port 1.2a 2x Display Port 1.2a over Type-C Alt-Mode |
| Miscellaneous I/O Ports | 1x Thunderbolt 4 Type-C (Front) 1x USB 3.2 Gen 2 Type-C (Front) 1x USB 3.2 Gen 2 Type-A (Front) 2x USB 3.2 Gen 2 Type-A (Rear) |
2x USB 2.0 (Rear) 2x USB 3.2 Gen 2 Type-C (Front) 1x USB 3.2 Gen 2 Type-A (Front) |
| Operating System | Windows 11 Enterprise (22000.832) | Windows 11 Enterprise (22000.778) |
| Pricing | (Street Pricing on July 24th, 2022) US $650 (barebones) US $1090 (as configured, no OS) |
(Street Pricing on July 24th, 2022) US $630 (barebones) US $858 (as configured, no OS) |
| Full Specifications | ASRock Industrial NUC BOX-1260P Specifications | ASRock Industrial 4X4 BOX-5800U Specifications |
The 110 mm x 117.5 mm x 47.85 mm chassis used by ASRock Industrial for both systems is made of polycarbonate, though an inner metal frame does exist. The bottom panel is held by four screws that need to be taken out to access the M.2 and SODIMM slots. The top of the chassis is glossy and easily attracts smudges and fingerprints, though it does come with a plastic film that can be retained without any loss of cooling efficiency. The two sides have perforated windows for air intake. The rear panel has openings on top to allow the internal blower fan to exhaust hot air after passing it through the heat spreader.


A closer look at the two cases and internal pictures are available in the galleries above. It can be seen that ASRock Industrial provides support for mounting a 2.5″ drive inside. This makes it difficult to accommodate a thermal gap filler for the M.2 SSD. In fact, the components are densely packed on the board, and even mounting a M.2 2280 SSD requires a special plastic tab that hangs atop one of the USB-C ports on the board.
In the next section, we take a look at the BIOS options along with an analysis of the motherboard platform. Following that, we have a number of sections focusing on various performance aspects before concluding with an analysis of the value proposition of the system.
Upon completion of the hardware configuration of the two systems and freshly installing the OS, we took some time to look into their BIOS interfaces. The videos below present the entire gamut of available options for both systems.
ASRock Industrial primarily plays in the B2B space, where a functional feature-rich BIOS is valued over a fancy GUI-based one with fewer knobs. In that context, it is not hugely surprising that the BIOS interface in both systems is similar and spartan in nature. Since both systems are meant for business deployment as the primary use-case, the control knobs mainly relate to the activation of specific CPU and chipset features, along with the peripherals. The BIOS home screen provides a quick overview of the system configuration – processor details, along with the DRAM configuration (including the memory controller speeds).
Your browser does not support HTML video.
The BIOS for the NUC BOX-1260P supports configuration of AMT, allowing for remote administration by IT personnel. It also includes ability to remotely wipe the system along with secure erasing of the internal SSD. BIOS updates are possible through the built-in Instant Flash utility. Basic control over fan speed is possible, though the ability to fine-tune the fan curves that is available in consumer-oriented BIOS systems is absent.
The BIOS home screen for the 4X4 BOX-5800U is similar. The key differences are in the CPU configuration section. While the BIOS for the Alder Lake system doesn’t expose the PL1 and PL2 values for end-user configuration, the Cezanne system offers a bit of flexibility with the ‘CPU Operating Mode’ option. In the ‘Normal Mode’ (default), the PL1 and PL2 values are set to 20W and 24W, and the fan speed adapts to the temperature. Selecting the ‘Performance Mode’ sets the PL1 and PL2 values to 25W and 30W respectively, at the cost of running the fan at full speed throughout.
Your browser does not support HTML video.
True to its business focus, the 4X4 BOX-5800U retains the DASH functionality for remote administration. We had covered DASH in detail as part of our 4X4 BOX-4800U review – it comes across as a credible alternative to vPro-based out-of-band management. Other BIOS settings are similar to the ones in the Alder Lake-P system.
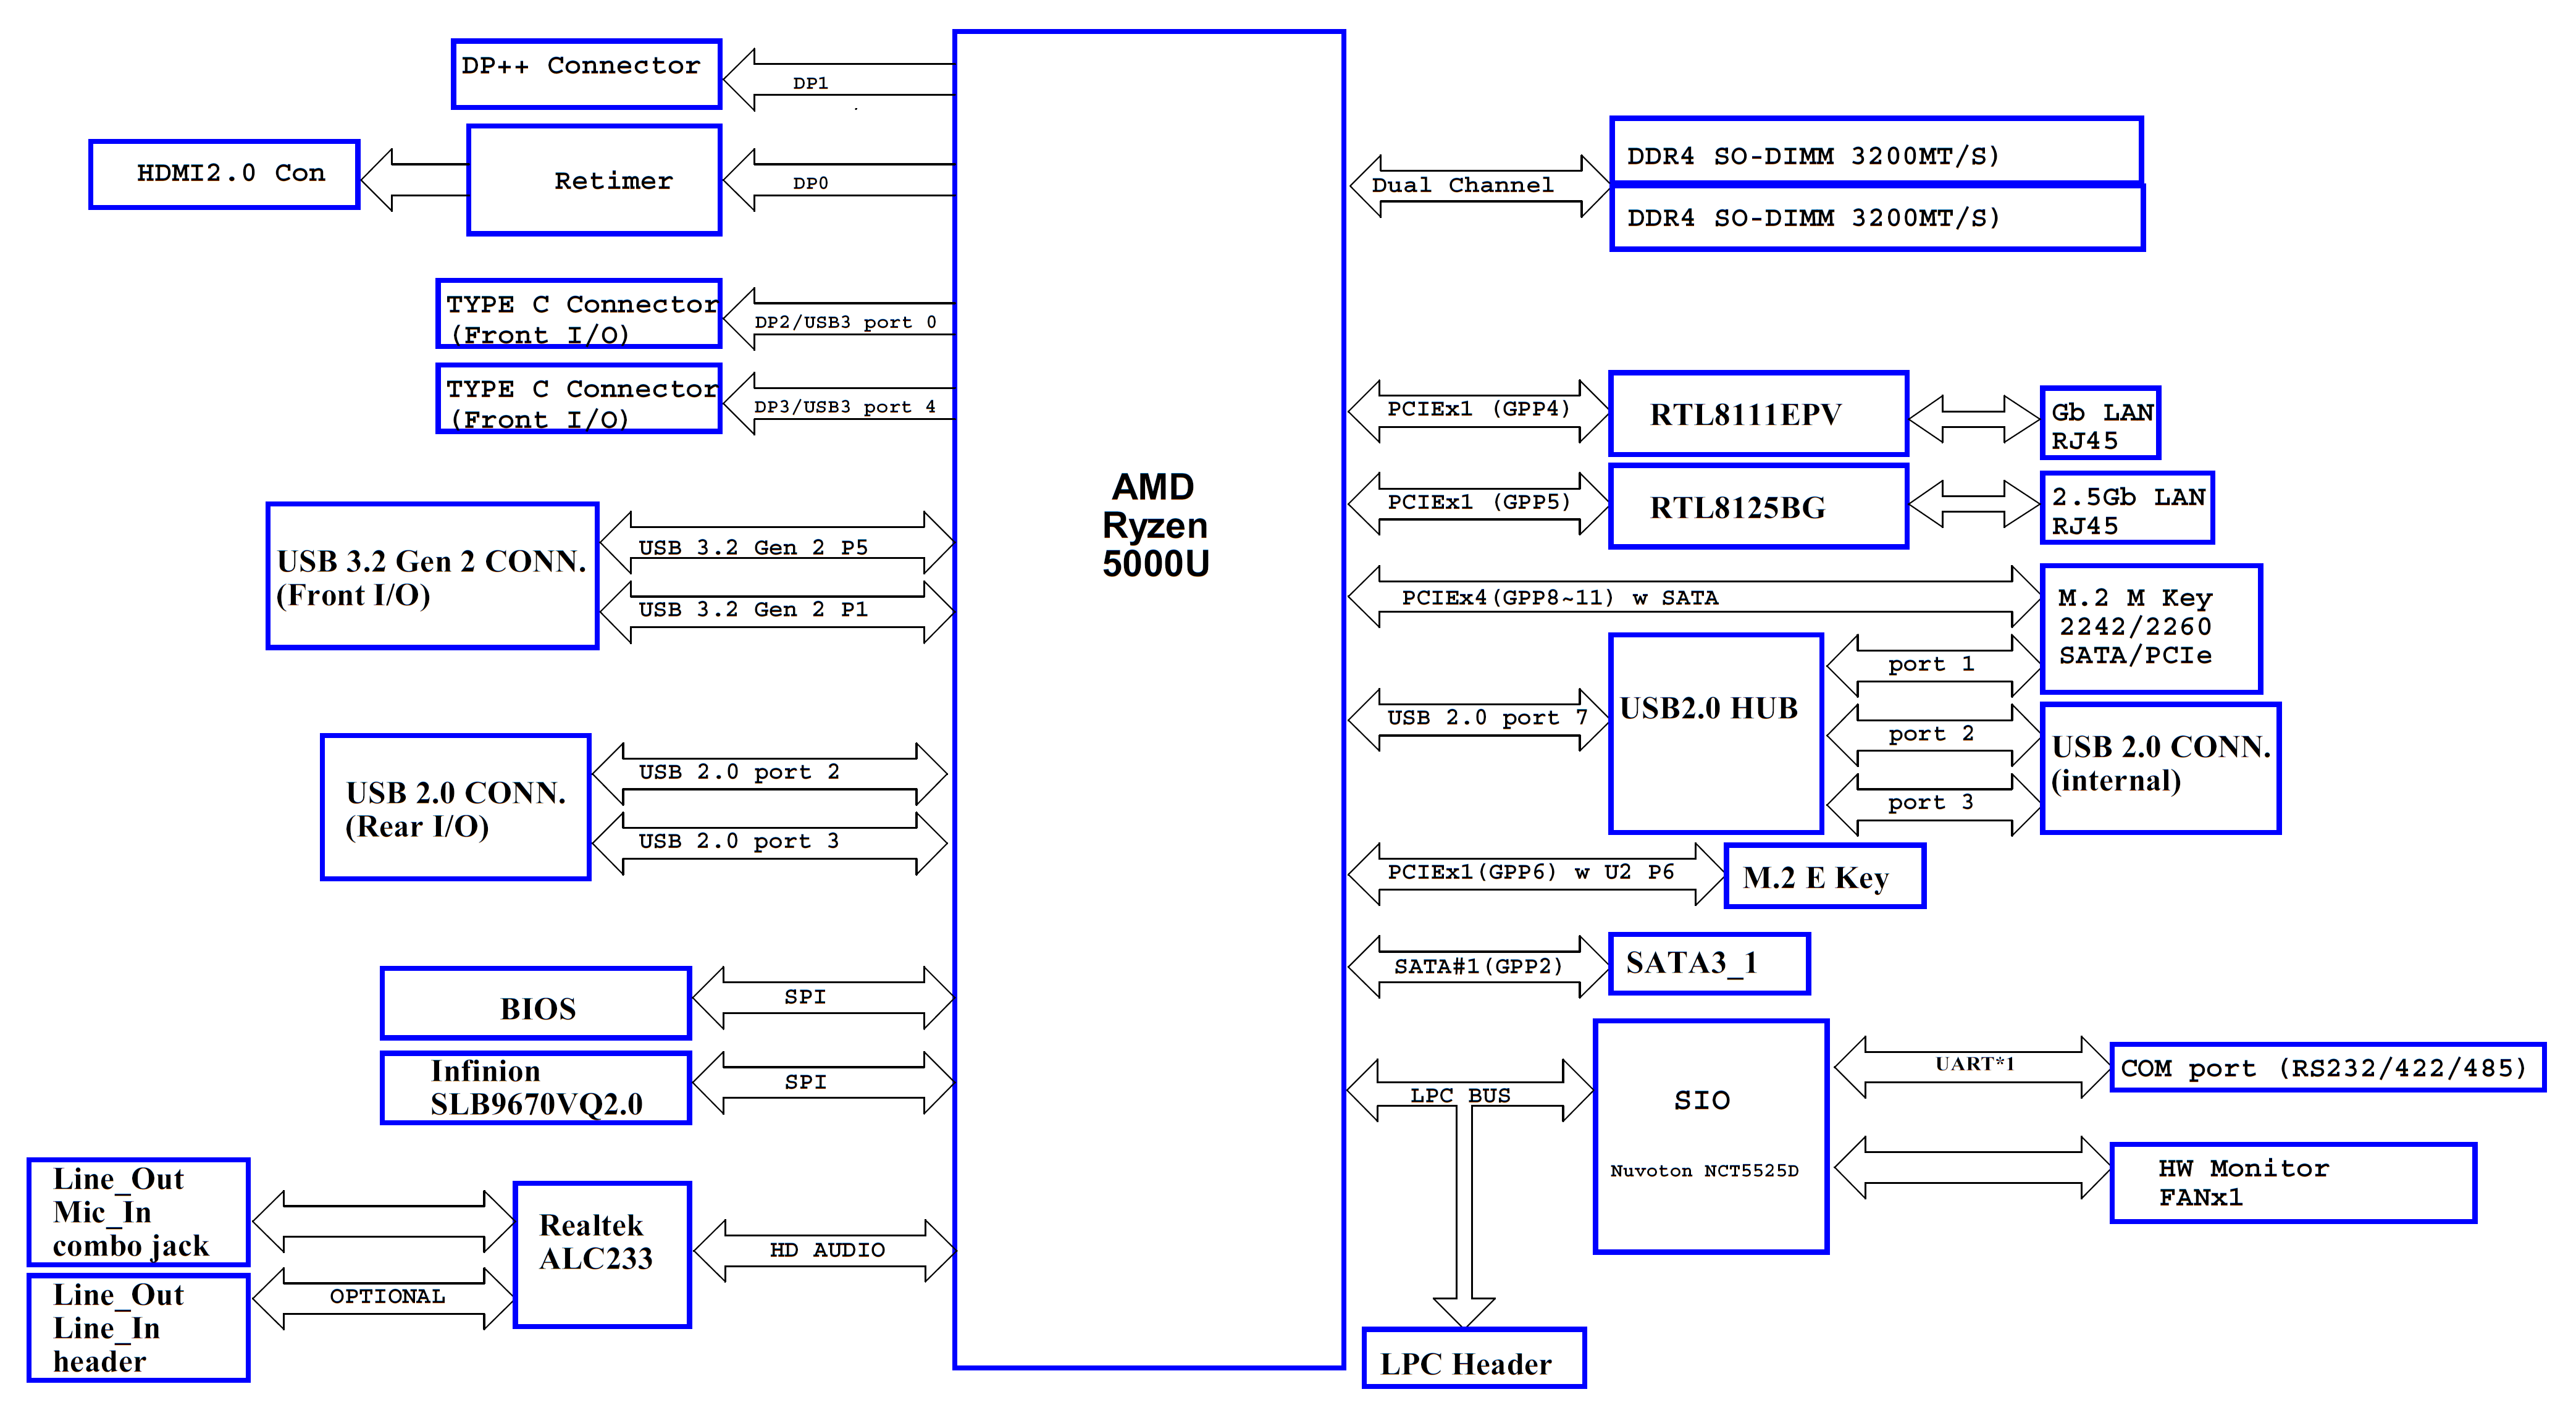
Thanks to the B2B focus of the products, ASRock Industrial supplies detailed block diagrams of the motherboards in both systems in their documentation. The NUC BOX-1260P platform clearly shows one of the Type-C ports in the front panel (the one adjacent to the Type-A port, as we found via experiments described later on) having the capability to act as a Thunderbolt 4 host port. The HD Audio bus is connected to the Realtek ALC233 codec, and the chipset PCIe lanes are used to enable the 2.5G LAN ports using the Intel I-225LM controllers. The M.2 2230 Wi-Fi slot is backed up by a PCIe x1 connection from the chipset, while the M.2 2260 / 2280 slot is connected to four PCIe 4.0 lanes directly from the CPU.

The above aspects are also brought out in the AIDA64 system report:
- [ North Bridge: Intel Alder Lake-P IMC ]
- PCIe 4.0 x4 port #5 In Use @ x4 (Silicon Motion SM2267EN PCIe 4.0 x4 NVMe 1.3 SSD Controller)
- PCIe 4.0 x4 port #2 Empty
- [ South Bridge: Intel Alder Point-P ]
- PCIe 3.0 x1 port #1 Empty
- PCIe 3.0 x1 port #5 In Use @ x1 (Intel I218-LM Ethernet Controller)
- PCIe 3.0 x1 port #9 In Use @ x1 (Intel I218-LM Ethernet Controller)
Based on the system report, the Wireless AX211 Wi-Fi 6E WLAN card is connected via CNVi to the Alder Lake-P package. The rest of the PCIe connections are as expected from the block diagram.
Moving on to the 4X4 BOX-5800U, we find the PCIe lanes from the processor package used to service the WLAN M.2 slot, and multiplexed with a SATA lane to service the M.2 M Key 2242 / 2260 / 2280 SSD slot, and the two LAN ports.
The above aspects are also brought out in the AIDA64 system report:
- [ North Bridge: AMD K19.5 IMC ]
- PCIe 3.0 x1 port #2 In Use @ x1 (Realtek RTL8125 Gaming 2.5GbE Family Ethernet Controller)
- PCIe 3.0 x1 port #3 In Use @ x1 (Realtek RTL8111xP RealManage Virtual COM1, Realtek RTL8168/8111 PCI-E Gigabit Ethernet Adapter)
- PCIe 3.0 x1 port #4 In Use @ x1 (MediaTek MT7922 (RZ616) Wi-Fi 6E 160MHz Wireless Network Adapter)
- PCIe 3.0 x8 port #0 In Use @ x4 (Silicon Motion SM2263 PCIe 3.0 x4 NVMe 1.3 SSD Controller)
In the table below, we have an overview of the various systems that we are comparing the ASRock Industrial NUC BOX-1260P and 4X4 BOX-5800U against. Note that they may not belong to the same market segment. The relevant configuration details of the machines are provided so that readers have an understanding of why some benchmark numbers are skewed for or against the two machines when we come to those sections.
| Comparative PC Configurations | ||
| Aspect | ASRock NUC BOX-1260P (BIOS 1.2E) | |
| CPU | Intel Core i7-1260P Alder Lake 4P + 8E / 16T, up to 4.7 GHz (P) up to 3.4 GHz (E) Intel 7, 18MB L2, Min / Max / Base TDP: 20W / 64W / 28W PL1 = 28W, PL2 = 64W |
Intel Core i7-1260P Alder Lake 4P + 8E / 16T, up to 4.7 GHz (P) up to 3.4 GHz (E) Intel 7, 18MB L2, Min / Max / Base TDP: 20W / 64W / 28W PL1 = 28W, PL2 = 64W |
| GPU | Intel Iris Xe Graphics (96EU @ 1.40 GHz) |
Intel Iris Xe Graphics (96EU @ 1.40 GHz) |
| RAM | Kingston FURY Impact KHX3200C20S4/32GX DDR4-3200 SODIMM 20-22-22-48 @ 3200 MHz 2×32 GB |
Kingston FURY Impact KHX3200C20S4/32GX DDR4-3200 SODIMM 20-22-22-48 @ 3200 MHz 2×32 GB |
| Storage | ADATA XPG GAMMIX S50 Lite (2 TB; M.2 2280 PCIe 4.0 x4 NVMe;) (Micron 96L 3D TLC; Silicon Motion SM2267 Controller) |
ADATA XPG GAMMIX S50 Lite (2 TB; M.2 2280 PCIe 4.0 x4 NVMe;) (Micron 96L 3D TLC; Silicon Motion SM2267 Controller) |
| Wi-Fi | 2x 2.5 GbE RJ-45 (Intel I225-LM) Intel Wi-Fi 6E AX211 (2×2 802.11ax – 2.4 Gbps) |
2x 2.5 GbE RJ-45 (Intel I225-LM) Intel Wi-Fi 6E AX211 (2×2 802.11ax – 2.4 Gbps) |
| Price (in USD, when built) | (Street Pricing on July 24th, 2022) US $650 (barebones) US $1090 (as configured, no OS) |
(Street Pricing on July 24th, 2022) US $650 (barebones) US $1090 (as configured, no OS) |
In general, we review SFF and UCFF systems with the BIOS options set to default. This is the standard deployment scenario of a vast majority of end-users. However, the two ASRock Industrial systems we are considering today turned out to be a bit of a challenge. Firstly, ASRock Industrial specifically asked us to evaluate the 4X4 BOX-5800U with the CPU Operating Mode set to ‘Performance’. After a bit of back and forth with ASRock Industrial’s Technical Support Division (TSD), we found that the setting involved configuration of different PL1 / PL2 equivalents for the Ryzen SoC. Since we had not done that type of investigation into the notebook-focused Ryzen processors, we took advantage of this BIOS feature to evaluate the 4X4 BOX-5800U in both Normal and Performance modes. The system completed our evaluation process in both modes with mostly expected results (based on AMD’s claims for the processor’s performance).
The evaluation of the NUC BOX-1260P turned out to be a long and protracted affair. Our review sample shipped with BIOS P1.20. After our first benchmarking round, we found that the system performed worse than the NUC BOX-1165G7 (TGL-U i7) – which, in turn, was performing worse than the NUC11TNKi5 (TGL-U i5) across all benchmarks. After working closely with ASRock Industrial’s TSD, we found that the default BIOS (P1.40) for the NUC BOX-1165G7 set both PL1 and PL2 values to 28W – a setting apparently optimized for industrial deployment. We put in some tweaks to better reflect usage in a home / business scenario. ‘Advanced > CPU Configuration > CPU Operation Mode’ was changed from default ‘Normal Mode’ (PL1 = 28W / PL2 = 28W) to ‘Performance Mode’ (PL1 = 38W / PL2 = 55W), ‘Advanced > CPU Configuration > CPU C-States Support’ was changed from default ‘Disabled’ to ‘Enabled’, ‘CPU C States Support > Enhanced Halt State (C1E)’ set to ‘Enabled’, ‘CPU C States Support > Package C State Support’ set to ‘Auto’, and ‘CPU C States Support > CFG Lock’ left at ‘Disabled’. This (BIOS Tweaks) setting for the NUC BOX-1165G7 brought out performance numbers better than the NUC11TNKi5 (as one would expect). Coming back to the NUC BOX-1260P, we found that the CPU Operation Mode option was no longer present. ASRock Industrial’s TSD then went back to the drawing board, and provided us with a string of BIOS releases in order to configure the C-States support and various other tweakable aspects to optimal values. After evaluating around four different BIOS versions, we finally decided to go with the default settings of BIOS 1.2E (ASRock Industrial is currently providing this as a beta version while qualifying it for public release).
The list of compared systems in the following sections represent a wide variety in the same form-factor. As a representation of Tiger Lake-U, we have the NUC BOX-1165G7 with BIOS tweaks, and the Intel NUC11TNKi5. The 4X4 BOX-4800U, ASUS PN50, and ASUS PN51-E1 represent Renoir, and the MinisForum U850 provides some context for the results from the perspective of a 15W Comet Lake-U system. Within the NUC BOX-1260P and the 4X4 BOX-5800U, we have three systems – the BOX-1260P with BIOS 1.2E, and the BOX-5800U in ‘Normal’ and ‘Performance’ modes.
Our 2022 test suite for Windows 11-based systems carries over some of the standard benchmarks we have been using over the last several years, including UL’s PCMark and BAPCo’s SYSmark. Starting this year, we are also including BAPCo’s CrossMark multi-platform benchmarking tool.
PCMark 10
UL’s PCMark 10 evaluates computing systems for various usage scenarios (generic / essential tasks such as web browsing and starting up applications, productivity tasks such as editing spreadsheets and documents, gaming, and digital content creation). We benchmarked select PCs with the PCMark 10 Extended profile and recorded the scores for various scenarios. These scores are heavily influenced by the CPU and GPU in the system, though the RAM and storage device also play a part. The power plan was set to Balanced for all the PCs while processing the PCMark 10 benchmark.
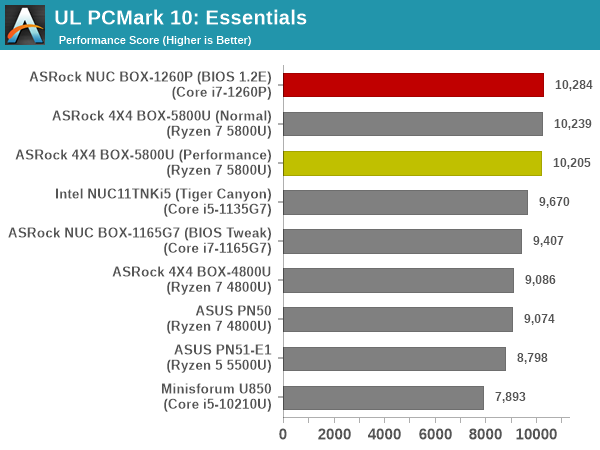
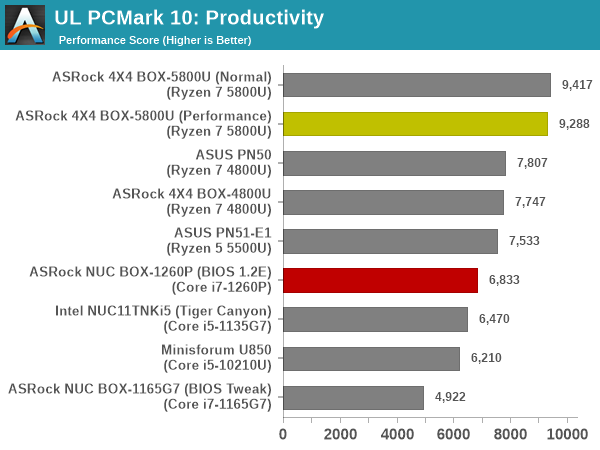
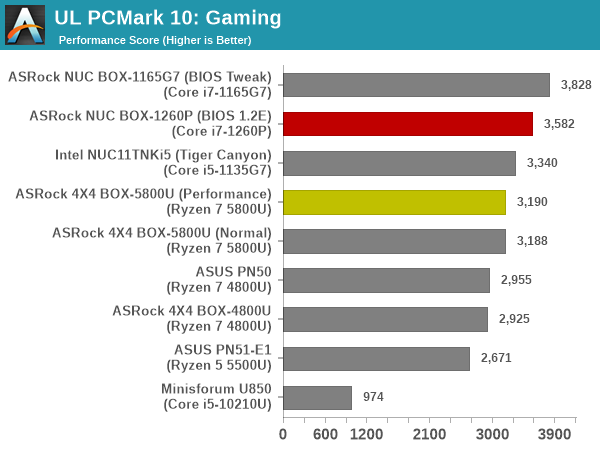
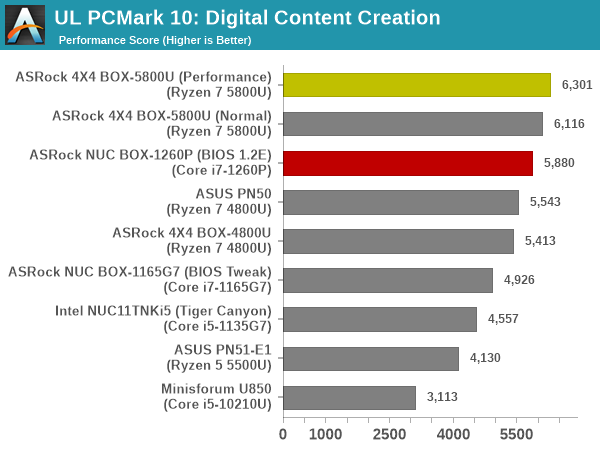
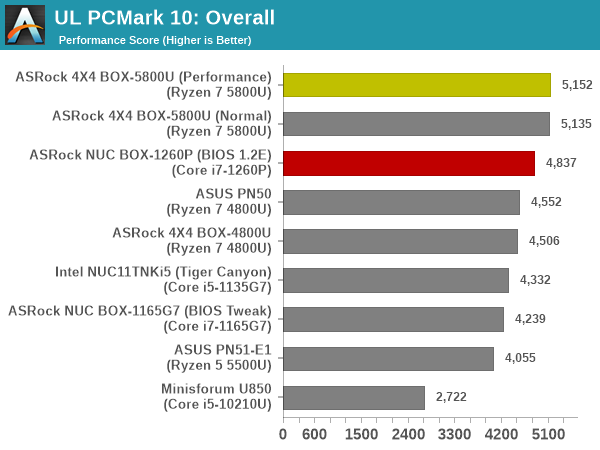
The Essentials and Gaming workloads see the NUC BOX-1260P come out on top with a narrow lead. However, the Productivity and Digital Content Creation workloads both heavily favor multi-threaded processors. The larger number of high-performance cores enable the 4X4 BOX-5800U to gain an healthy edge. Overall, we see the two Cezanne configurations occupy the top two spots in the PCMark 10 leaderboard.
BAPCo SYSmark 25
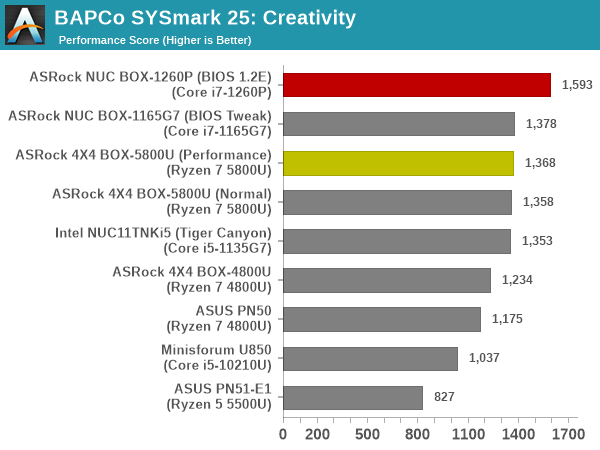
BAPCo’s SYSmark 25 is an application-based benchmark that uses real-world applications to replay usage patterns of business users in the areas of productivity, creativity, and responsiveness. The ‘Productivity Scenario’ covers office-centric activities including word processing, spreadsheet usage, financial analysis, software development, application installation, file compression, and e-mail management. The ‘Creativity Scenario’ represents media-centric activities such as digital photo processing, AI and ML for face recognition in photos and videos for the purpose of content creation, etc. The ‘Responsiveness Scenario’ evaluates the ability of the system to react in a quick manner to user inputs in areas such as application and file launches, web browsing, and multi-tasking.
Scores are meant to be compared against a reference desktop (the SYSmark 25 calibration system, a Lenovo Thinkcenter M720q with a Core i5-8500T and 8GB of DDR4 memory to go with a 256GB M.2 NVMe SSD). The calibration system scores 1000 in each of the scenarios. A score of, say, 2000, would imply that the system under test is twice as fast as the reference system.
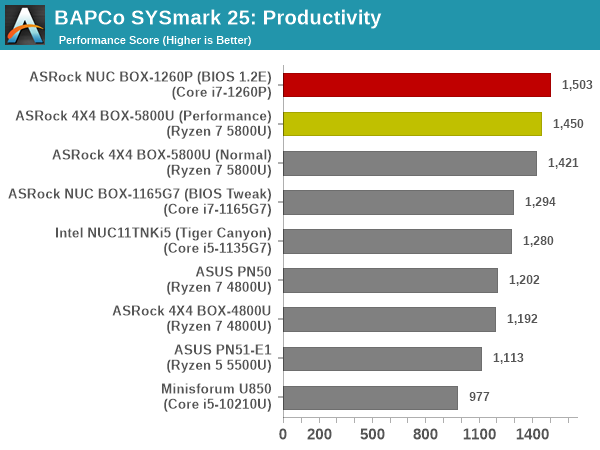


SYSmark 25 also adds energy measurement to the mix. A high score in the SYSmark benchmarks might be nice to have, but potential customers also need to determine the balance between power consumption and the performance of the system. For example, in the average office scenario, it might not be worth purchasing a noisy and power-hungry PC just because it ends up with a 2000 score in the SYSmark 25 benchmarks. In order to provide a balanced perspective, SYSmark 25 also allows vendors and decision makers to track the energy consumption during each workload. In the graphs below, we find the total energy consumed by the PC under test for a single iteration of each SYSmark 25 workload. For reference, the calibration system consumes 8.88 Wh for productivity, 10.81 Wh for creativity, and 19.69 Wh overall.
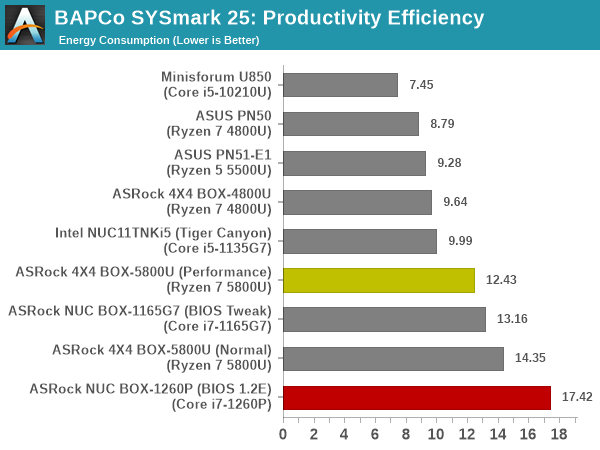
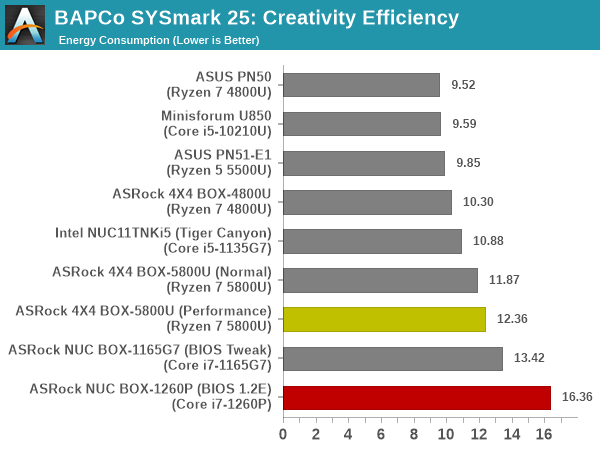
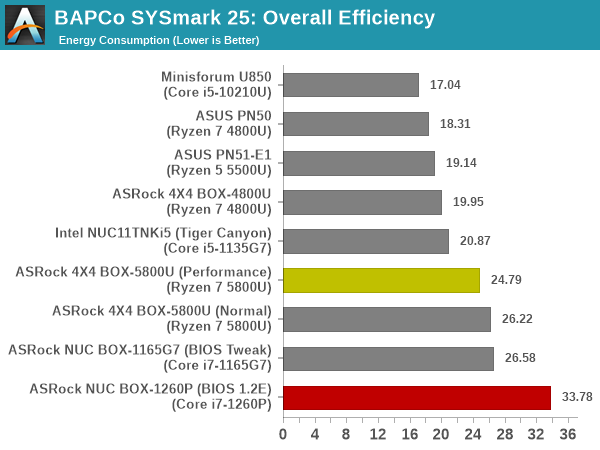
Though the NUC BOX-1260P gets high scores in all segments, the energy consumption is quite high. In fact, at 33.78 Wh overall, it is the worst performer by a significant margin (44.1 / Wh). On the other hand, the Cezanne system in performance mode delivers a score of 54.5 / Wh, and the normal mode delivers a score of 50.9 / Wh. The Cezanne system delivers better performance per Joule in SYSmark 25.
BAPCo CrossMark 1.0.1.86
BAPCo’s CrossMark aims to simplify benchmark processing while still delivering scores that roughly tally with SYSmark. The main advantage is the cross-platform nature of the tool – allowing it to be run on smartphones and tablets as well.
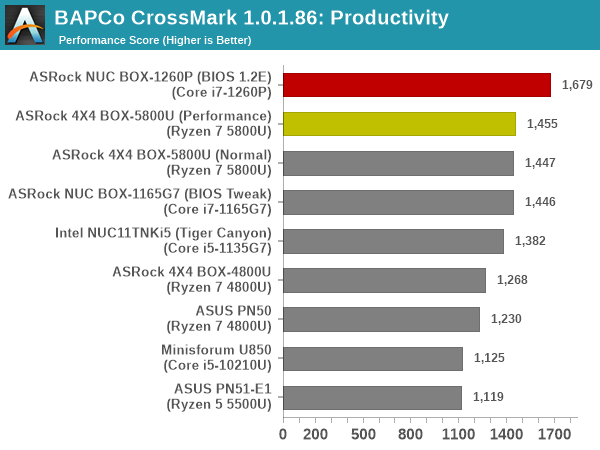
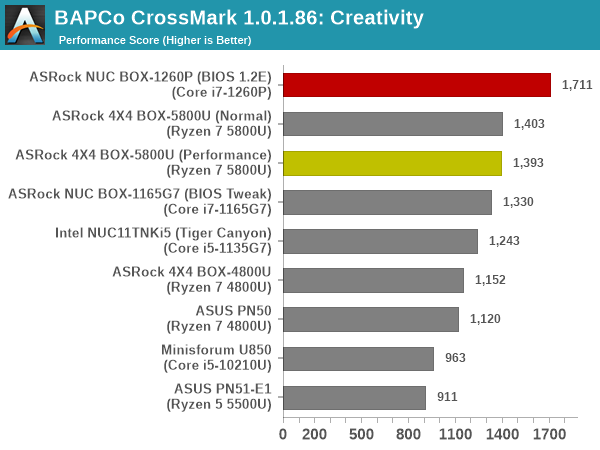
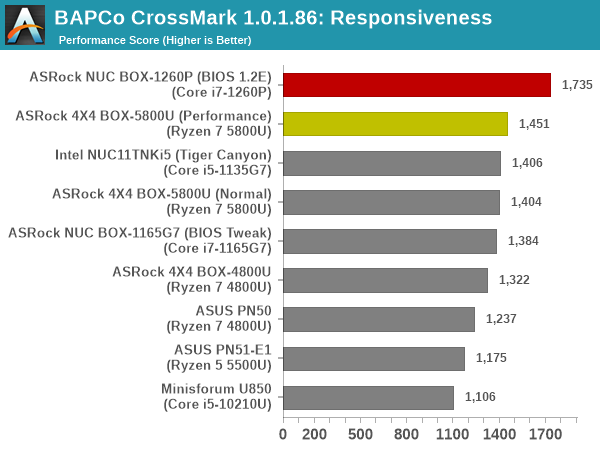
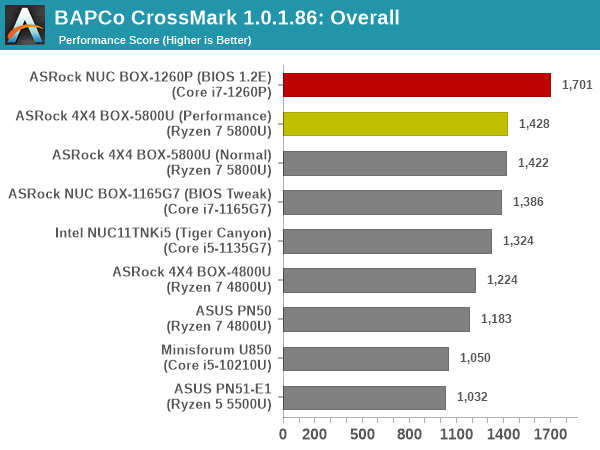
The relative performance seen in SYSmark 25 translate to CrossMark also, as expected. The NUC BOX-1260P comes out on top comfortably, and the Cezanne system is right behind.
Standardized benchmarks such as UL’s PCMark 10 and BAPCo’s SYSmark take a holistic view of the system and process a wide range of workloads to arrive at a single score. Some systems are required to excel at specific tasks – so it is often helpful to see how a computer performs in specific scenarios such as rendering, transcoding, JavaScript execution (web browsing), etc. This section presents focused benchmark numbers for specific application scenarios.
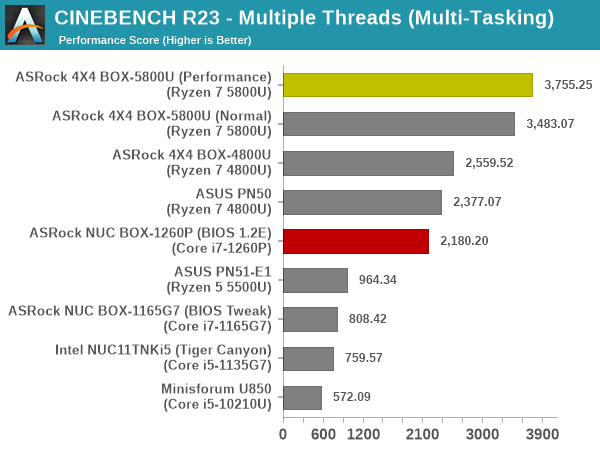
3D Rendering – CINEBENCH R23
We use CINEBENCH R23 for 3D rendering evaluation. R23 provides two benchmark modes – single threaded and multi-threaded. Evaluation of different PC configurations in both supported modes provided us the following results.
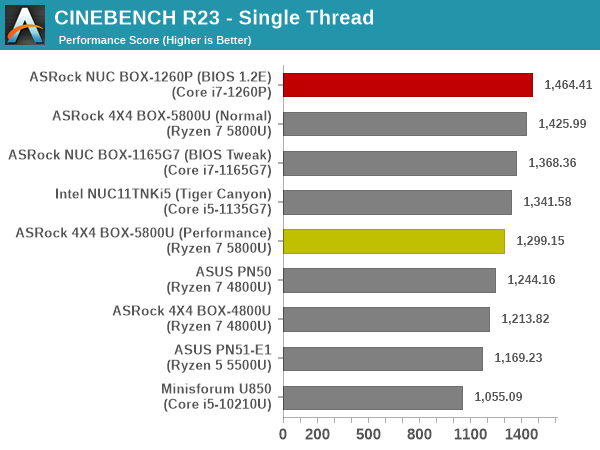
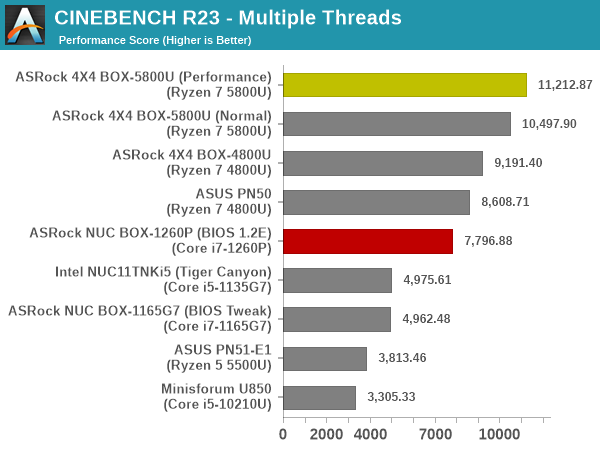
As expected, Alder Lake-P retains the single threaded crown, and the Cezanne system delivers multi-threaded performance that is way ahead of any system in the list based on an Intel processor.
Transcoding: Handbrake 1.5.1
Handbrake is one of the most user-friendly open source transcoding front-ends in the market. It allows users to opt for either software-based higher quality processing or hardware-based fast processing in their transcoding jobs. Our new test suite uses the ‘Tears of Steel’ 4K AVC video as input and transcodes it with a quality setting of 19 to create a 720p AVC stream and a 1080p HEVC stream.
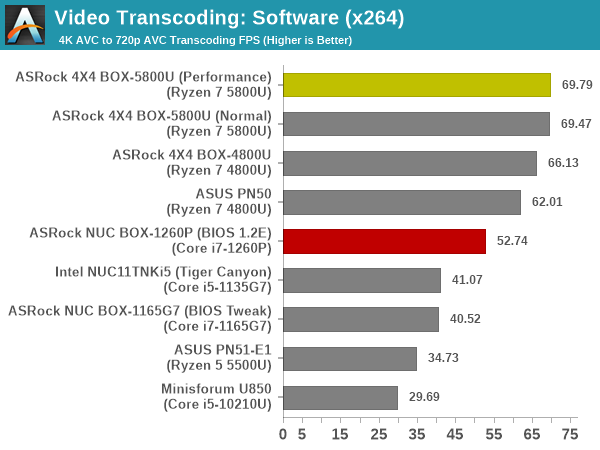
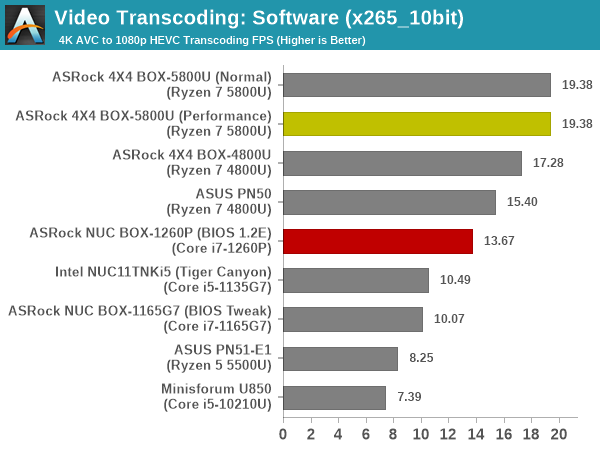
Software transcoding loves a lot of high-performance cores, and we can see the 8C/16T configurataion with Zen 3 cores handily besting the 4P / 8E combination in Alder Lake-P.
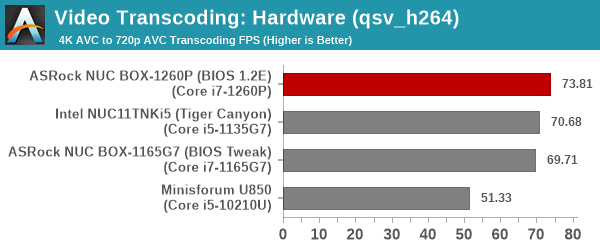
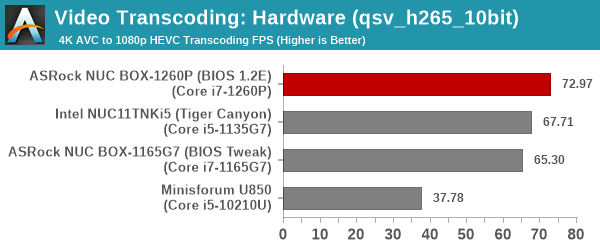
The QuickSync AVC / HEVC engine continues to remain the same between Tiger Lake and Alder Lake, except for a minor bump in clock speeds that get reflected in the transcoding rates above.
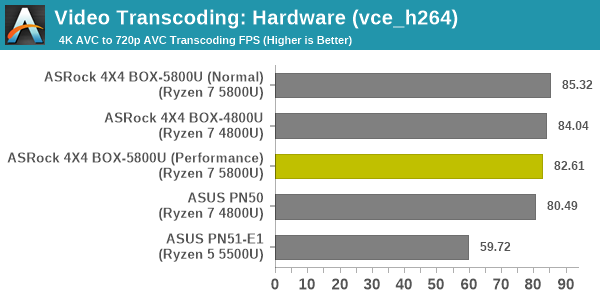
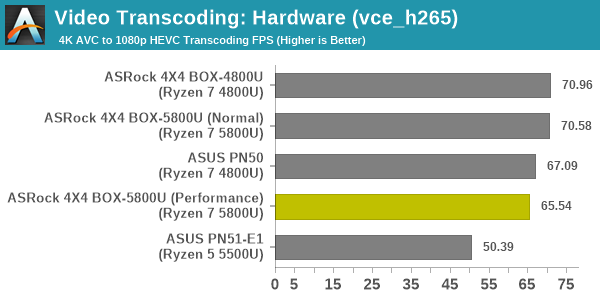
On the other hand, the VCE performance remains essentially the same between Renoir and Cezanne for the flagship SKUs.
Archiving: 7-Zip 21.7
The 7-Zip benchmark is carried over from our previous test suite with an update to the latest version of the open source compression / decompression software.
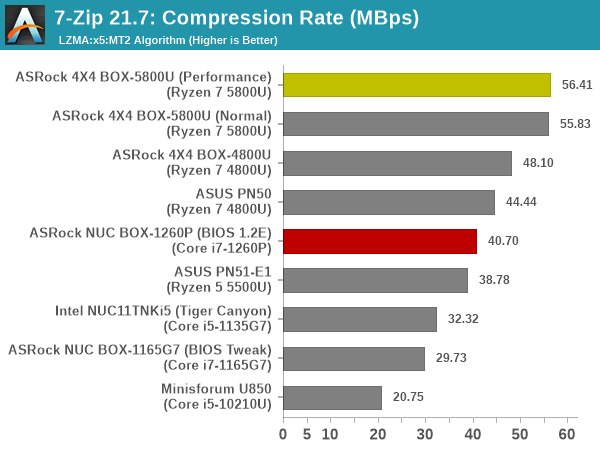
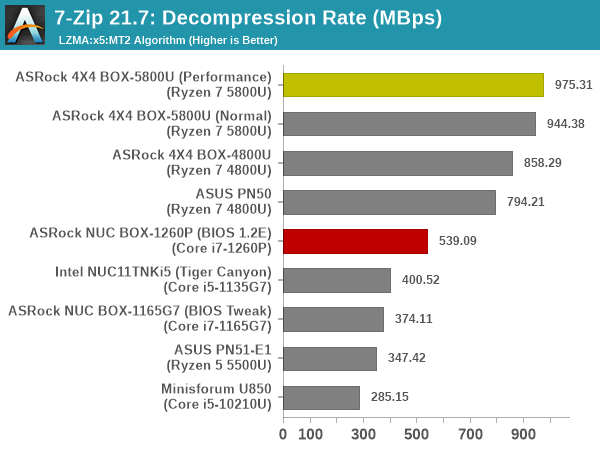
Multiple cores help get compression and decompression done faster, and that is reflected in the significant lead enjoyed by the 4X4 BOX-5800U in the above benchmarks.
Web Browsing: JetStream, Speedometer, and Principled Technologies WebXPRT4
Web browser-based workloads have emerged as a major component of the typical home and business PC usage scenarios. For headless systems, many applications based on JavaScript are becoming relevant too. In order to evaluate systems for their JavaScript execution efficiency, we are carrying over the browser-focused benchmarks from the WebKit developers used in our notebook reviews. Hosted at BrowserBench, JetStream 2.0 benchmarks JavaScript and WebAssembly performance, while Speedometer measures web application responsiveness.
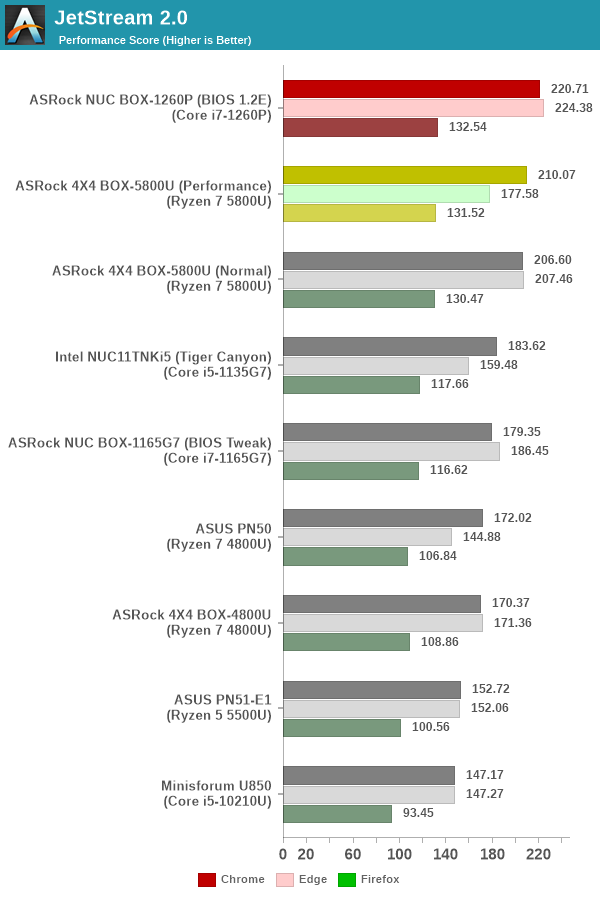
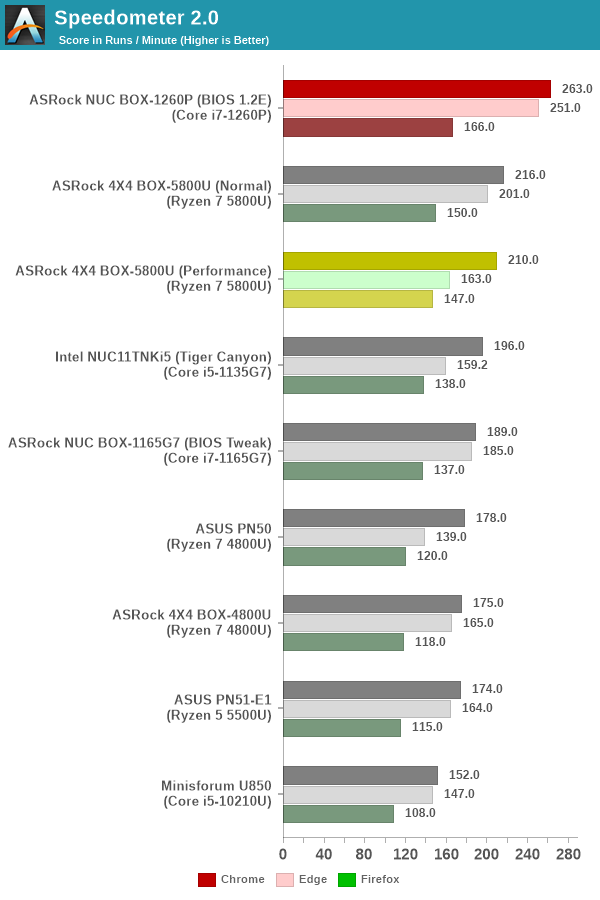
From a real-life workload perspective, we also process WebXPRT4 from Principled Technologies. WebXPRT4 benchmarks the performance of some popular JavaScript libraries that are widely used in websites.
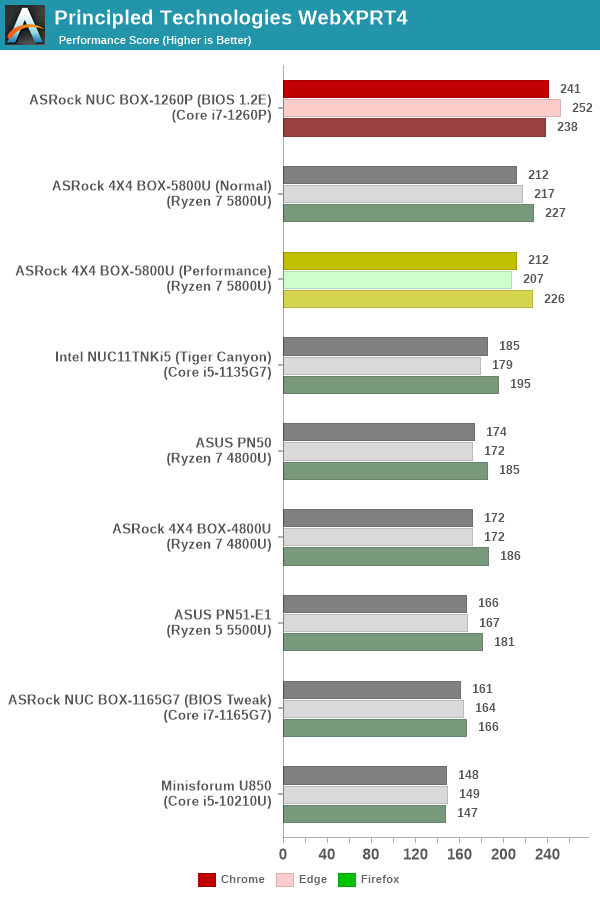
Single threaded performance helps in these benchmarks, and the Alder Lake-P system gets a slight edge across all three browser benchmark components.
Application Startup: GIMP 2.10.30
A new addition to our systems test suite is AppTimer – a benchmark that loads up a program and determines how long it takes for it to accept user inputs. We use GIMP 2.10.30 with a 50MB multi-layered xcf file as input. What we test here is the first run as well as the cached run – normally on the first time a user loads the GIMP package from a fresh install, the system has to configure a few dozen files that remain optimized on subsequent opening. For our test we delete those configured optimized files in order to force a fresh load every second time the software is run.
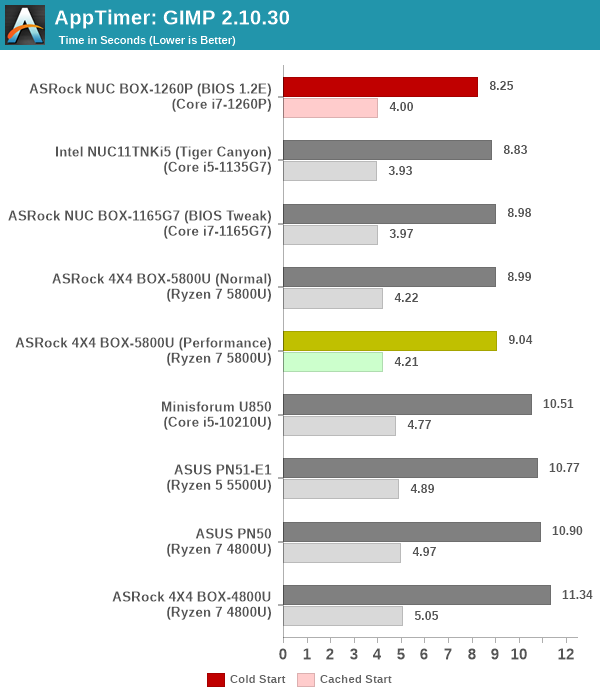
As it turns out, GIMP does optimizations for every CPU thread in the system, which requires that higher thread-count processors take a lot longer to run. So the test runs quick on systems with fewer threads, however fast cores are also needed. The Alder Lake-P system gets the overall edge in this case.
Both Intel and AMD refrained from making significant changes to the integrated GPUs when moving from Tiger Lake to Alder Lake / Renoir to Cezanne. Process maturity allows both vendors to clock the GPUs slightly higher than the previous generation, but the number of EUs / shaders remain the same compared to the equivalent products in the previous generation. GPU performance evaluation typically involved gaming workloads, and for select PCs, GPU compute. Prior to that, a look at the capabilities of the GPU in the two systems is warranted.
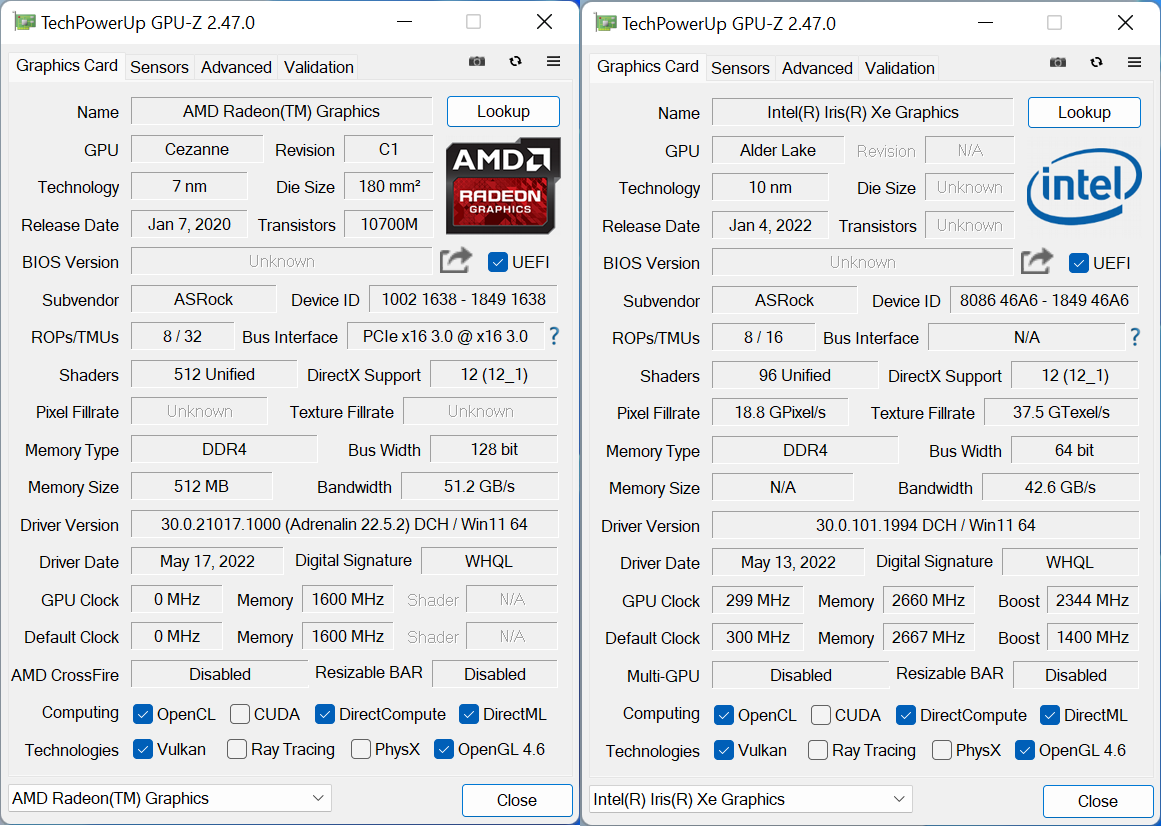
The AMD Radeon Graphics in Cezanne (Ryzen 7 5800U) has 8 CUs, while the Intel Iris Xe Graphics in the Core i7-1260P has 96 EUs. The performance of the Iris Xe iGPU is miles ahead of previous iGPUs from both Intel and AMD, as the benchmarks below show, and is more than capable of surpassing the performance of the iGPU in Cezanne.
GFXBench
The DirectX 12-based GFXBench tests from Kishonti are cross-platform, and available all the way down to smartphones. As such, they are not very taxing for discrete GPUs and modern integrated GPUs. We processed the offscreen versions of the ‘Aztec Ruins’ benchmark.
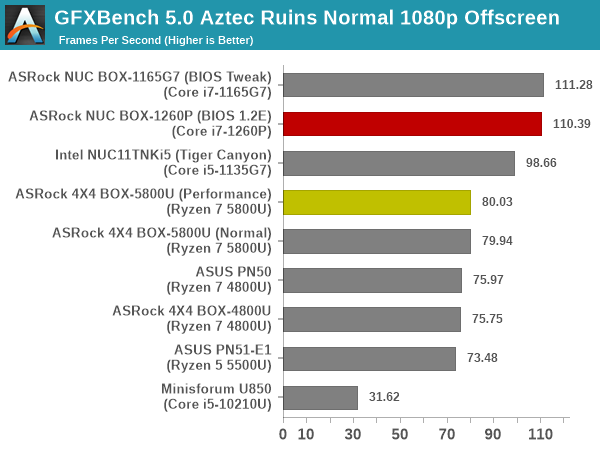
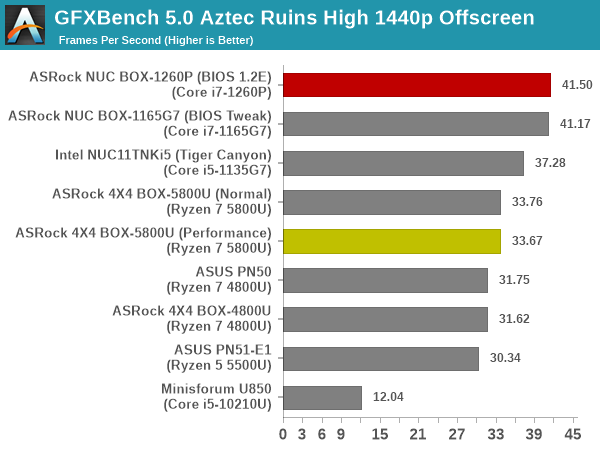
As expected, the reworked architecture from Intel handily bests the AMD offering, delivering around 20% to 30% better numbers.
UL 3DMark
Four different workload sets were processed in 3DMark – Fire Strike, Time Spy, Night Raid, and Wild Life.
3DMark Fire Strike
The Fire Strike benchmark has three workloads. The base version is meant for high-performance gaming PCs. It uses DirectX 11 (feature level 11) to render frames at 1920 x 1080. The Extreme version targets 1440p gaming requirements, while the Ultra version targets 4K gaming system, and renders at 3840 x 2160. The graph below presents the overall score for the Fire Strike Extreme and Fire Strike Ultra benchmark across all the systems that are being compared.
| UL 3DMark – Fire Strike Workloads | |||
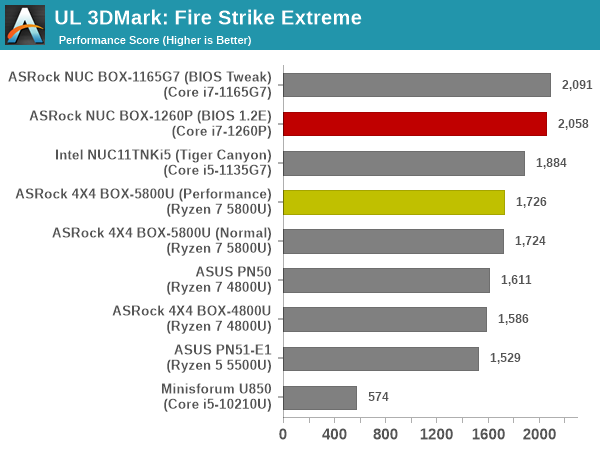
The NUC BOX-1165G7 has a higher power budget compared to the NUC BOX-1260P. Since the GPU configurations are the same, the former comes out ahead of the Alder Lake-P system.
3DMark Time Spy
The Time Spy workload has two levels with different complexities. Both use DirectX 12 (feature level 11). However, the plain version targets high-performance gaming PCs with a 2560 x 1440 render resolution, while the Extreme version renders at 3840 x 2160 resolution. The graphs below present both numbers for all the systems that are being compared in this review.
| UL 3DMark – Time Spy Workloads | |||
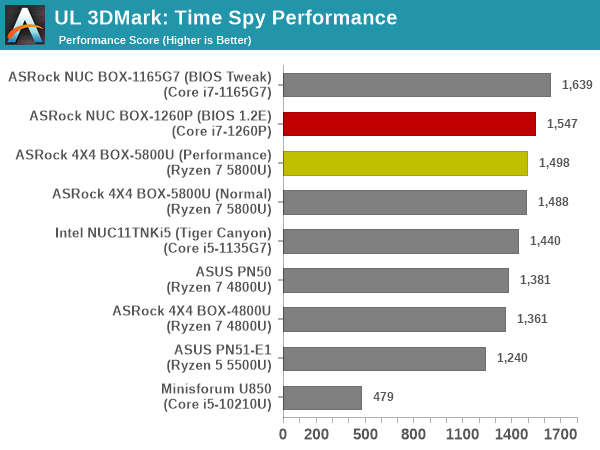
The Cezanne iGPU is able to put up a much better fight in Time Spy, and delivers performance that is almost equivalent to the Intel Iris Xe Graphics in this workload. The TGL-U system with the higher power budget continues to remain on top.
3DMark Wild Life
The Wild Life workload was initially introduced as a cross-platform GPU benchmark in 2020. It renders at a 2560 x 1440 resolution using Vulkan 1.1 APIs on Windows. It is a relatively short-running test, reflective of mobile GPU usage. In mid-2021, UL released the Wild Life Extreme workload that was a more demanding version that renders at 3840 x 2160 and runs for a much longer duration reflective of typical desktop gaming usage.
| UL 3DMark – Wild Life Workloads | |||
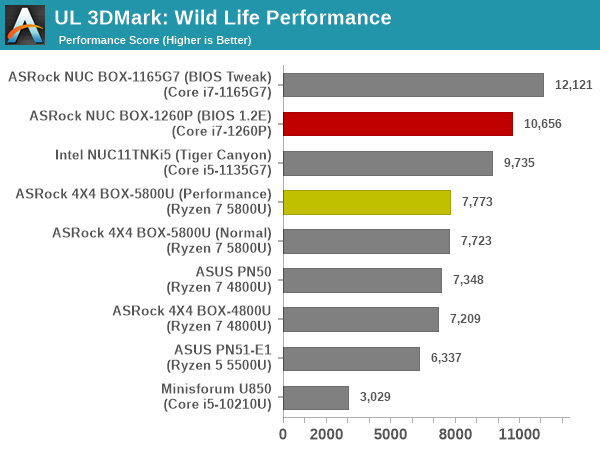
This workload sees the Ryzen iGPU slip down again, with the leaderboard seeing the TGL-U system followed by Alder Lake-P. This is primarily dictated by the power budget.
3DMark Night Raid
The Night Raid workload is a DirectX 12 benchmark test. It is less demanding than Time Spy, and is optimized for integrated graphics. The graph below presents the overall score in this workload for different system configurations.
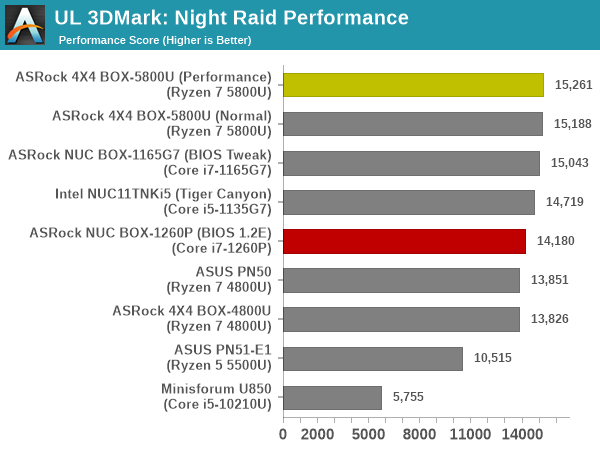
The Ryzen iGPU fares much better in this workload, and comes out on top despite the NUC BOX-1165G7 and the NUC BOX-1260P having higher power budgets.
Overall, the iGPU in the Alder Lake-P system has a slight edge over the one in Cezanne, but there are certain specific workloads where the Cezanne configuration can flex its muscles to come out on top.
One of the key drivers of advancments in computing systems is multi-tasking. On mobile devices, this is quite lightweight – cases such as background email checks while the user is playing a mobile game are quite common. Towards optimizing user experience in those types of scenarios, mobile SoC manufacturers started integrating heterogenous CPU cores – some with high performance for demanding workloads, while others were frugal in terms of both power consumption / die area and performance. This trend is now slowly making its way into the desktop PC space.
Multi-tasking in typical PC usage is much more demanding compared to phones and tablets. Desktop OSes allow users to launch and utilize a large number of demanding programs simultaneously. Responsiveness is dictated largely by the OS scheduler allowing different tasks to move to the background. Intel’s Alder Lake processors work closely with the Windows 11 thread scheduler to optimize performance in these cases. Keeping these aspects in mind, the evaluation of multi-tasking performance is an interesting subject to tackle.
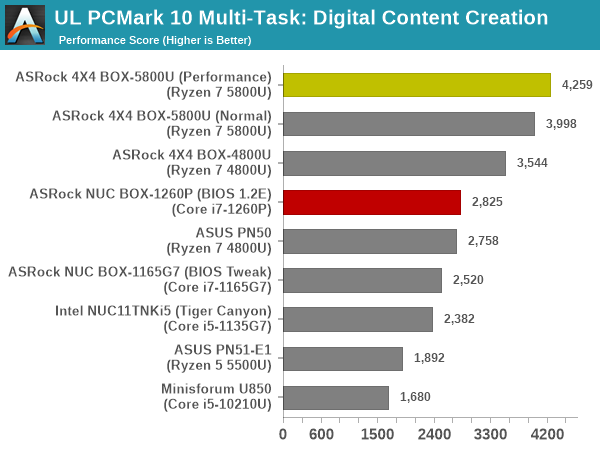
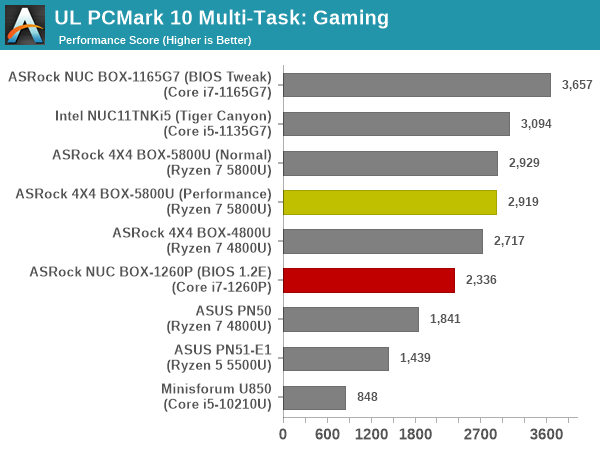
We have augmented our systems benchmarking suite to quantitatively analyze the multi-tasking performance of various platforms. The evaluation involves triggering a VLC transcoding task to transform 1716 3840×1714 frames encoded as a 24fps AVC video (Blender Project’s ‘Tears of Steel’ 4K version) into a 1080p HEVC version in a loop. VLC internally uses the x265 encoder, and the settings are configured to allow the CPU usage to be saturated across all cores. The transcoding rate is monitored continuously. One complete transcoding pass is allowed to complete before starting the first multi-tasking workload – the PCMark 10 Extended bench suite. A comparative view of the PCMark 10 scores for various scenarios is presented in the graphs below. Also available for concurrent viewing are scores in the normal case where the benchmark was processed without any concurrent load, and a graph presenting the loss in performance.
| UL PCMark 10 Load Testing – Digital Content Creation Scores | |||
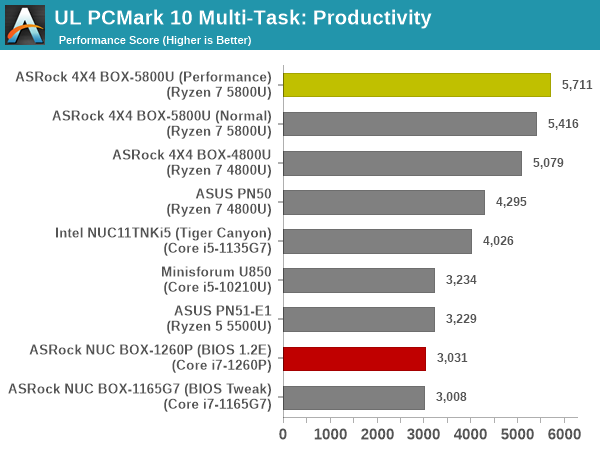
| UL PCMark 10 Load Testing – Productivity Scores | |||
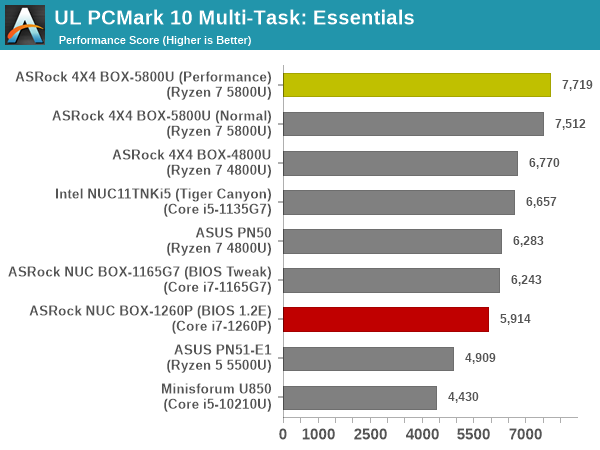
| UL PCMark 10 Load Testing – Essentials Scores | |||
| UL PCMark 10 Load Testing – Gaming Scores | |||
| UL PCMark 10 Load Testing – Overall Scores | |||
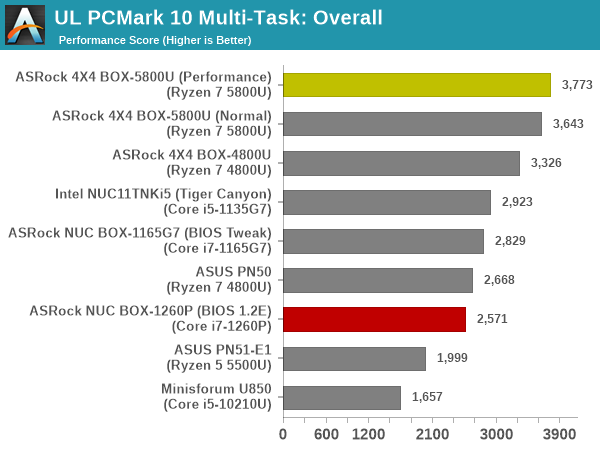
The Alder Lake system has an inauspicious beginning, falling way behind in a set of tests it is supposedly tuned for. Based on our experience with the system, it is a combination of having lesser number of performance cores compared to Cezanne, and a BIOS that has not been tuned carefully yet.
Following the completion of the PCMark 10 benchmark, a short delay is introduced prior to the processing of Principled Technologies WebXPRT4 on MS Edge. Similar to the PCMark 10 results presentation, the graph below show the scores recorded with the transcoding load active. Available for comparison are the dedicated CPU power scores and a measure of the performance loss.
| Principled Technologies WebXPRT4 Load Testing Scores (MS Edge) | |||
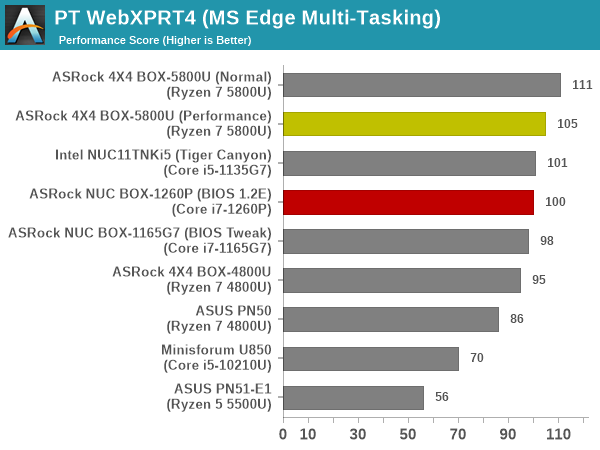
The performance of Alder Lake-P is slightly better here, but still not what we saw in other Alder Lake reviews.
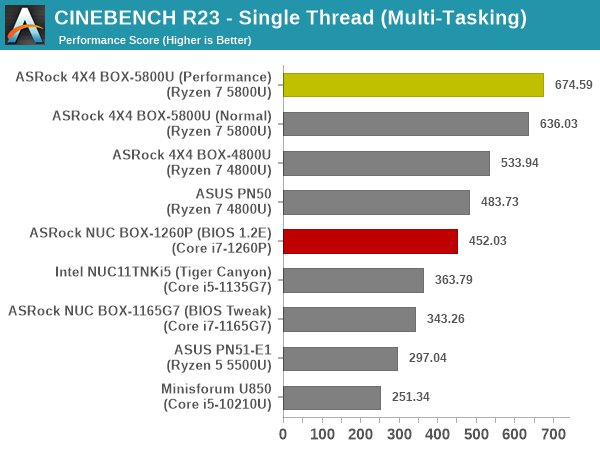
The final workload tested as part of the multitasking evaluation routine is CINEBENCH R23.
| 3D Rendering – CINEBENCH R23 Load Testing – Single Thread Score | |||
| 3D Rendering – CINEBENCH R23 Load Testing – Multiple Thread Score | |||
This is another dismal outing for the NUC BOX-1260P, with even the 1165G7 model having lesser performance loss.
After the completion of all the workloads, we let the transcoding routine run to completion. The monitored transcoding rate throughout the above evaluation routine (in terms of frames per second) for select systems are tabulated below.
| VLC Transcoding Rate (Multi-Tasking Test) – Frames per Second | |||||
| Enc. Pass #1 | PCMark 10 | WebXPRT4 | Cinebench | Enc. Pass #2 | |
| ASRock NUC BOX-1260P (Core i7-1260P ; BIOS 1.2E) |
1.2859 | 1.1608 | 1.1178 | 1.2515 | 1.2855 |
| ASRock 4X4 BOX-5800U (Ryzen 7 5800U ; Performance Mode) |
1.7057 | 1.5656 | 1.5053 | 1.7232 | 1.7086 |
| ASRock 4X4 BOX-5800U (Ryzen 7 5800U ; Normal Mode) |
1.6200 | 1.4950 | 1.4103 | 1.5672 | 1.6708 |
| ASRock 4X4 BOX-4800U (Ryzen 7 4800U) |
1.6366 | 1.5167 | 1.4080 | 1.5505 | 1.6073 |
| Intel NUC11TNBi5 (Akasa Newton TN) (Core i5-1135G7) |
0.8662 | 0.7773 | 0.7275 | 0.7773 | 0.8722 |
| ASRock NUC BOX-1165G7 (Core i7-1165G7) |
0.8409 | 0.8004 | 0.7230 | 0.7534 | 0.8854 |
The transcoding rates in different systems drop down with simultaneous loading, as expected. While the gap is least for the Alder Lake-P system, it comes at the cost of excessive performance loss in the concurrent workloads.
The HTPC-related sections in previous SFF PC reviews covered a range of aspects. Display refresh rate stability (particularly, the ability to drive 23.976 Hz for stutter-free playback of cinema content), OTT streaming efficiency (YouTube and Netflix), and local media playback performance and efficiency evaluation were some of them. While such a detailed study may still make sense for dedicated HTPC reviews, we have decided to pare down the evaluated aspects for system reviews. Workloads were processed on the NUC BOX-1260P and the 4X4 BOX-5800U (Normal Mode) for the results in this section.
YouTube Streaming Efficiency
4K video streaming has become ubiquitous enough for its support to be a necessity even for secondary HTPCs. HDR has also become affordable. Both systems under consideration today can display HDR content in HDR. Keeping these aspects in mind, we have chosen Mystery Box’s Peru 8K HDR 60FPS video as our test sample moving forward. On PCs running Windows, it is recommended that HDR streaming videos be viewed using the Microsoft Edge browser after putting the desktop in HDR mode.
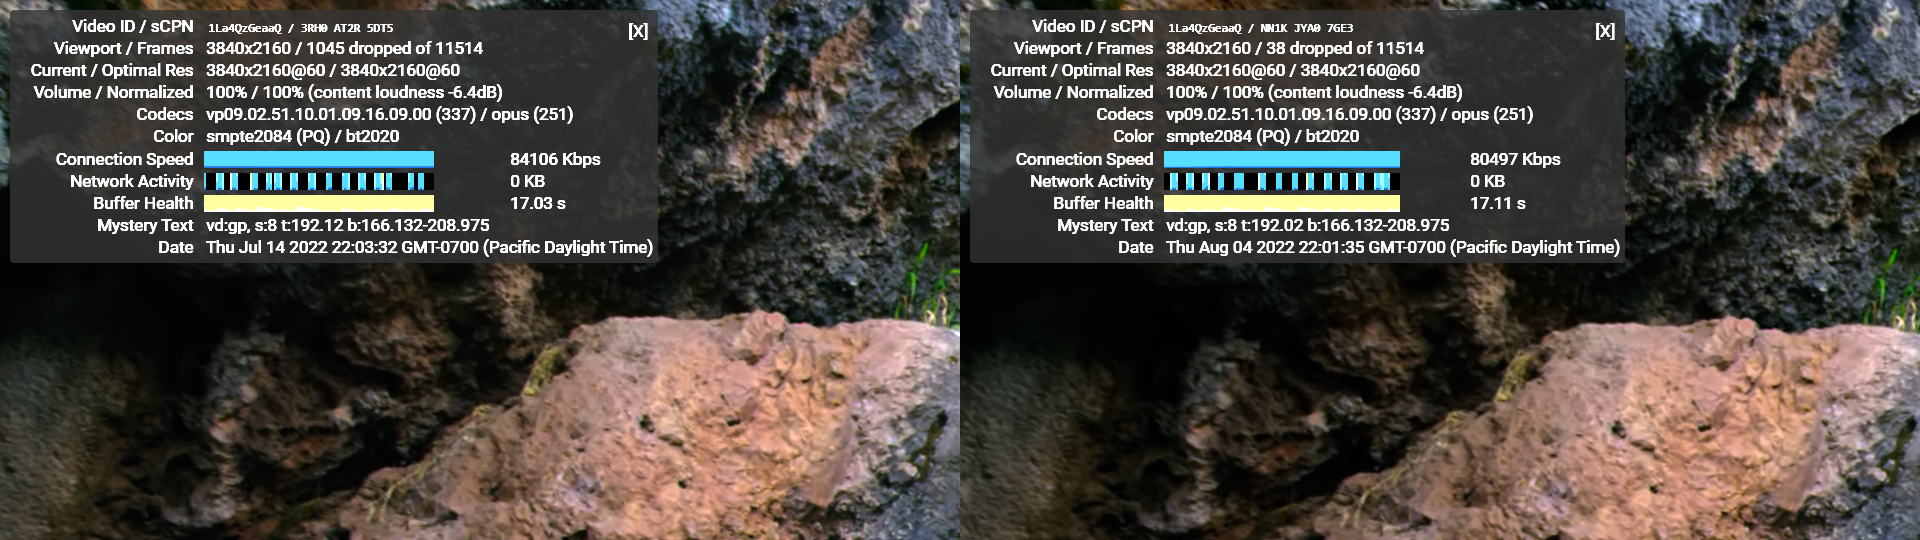
YouTube Streaming Statistics
ASRock Industrial 4X4 BOX-5800U (L) and ASRock Industrial NUC BOX-1260P (R)
The integrated GPUs in both systems support hardware decoding for VP9 Profile 2. Taking advantage of this feature, MS Edge automatically fetches the 4Kp60 VP9 Profile 2 encode from the YouTube servers. However, the playback quality was markedly different – while the Alder Lake system played back the clip almost perfectly (the few dropped frames were during resolution changes / triggering of overlays), the Cezanne system had evident stuttering as a result of almost 10% of the frames getting dropped.
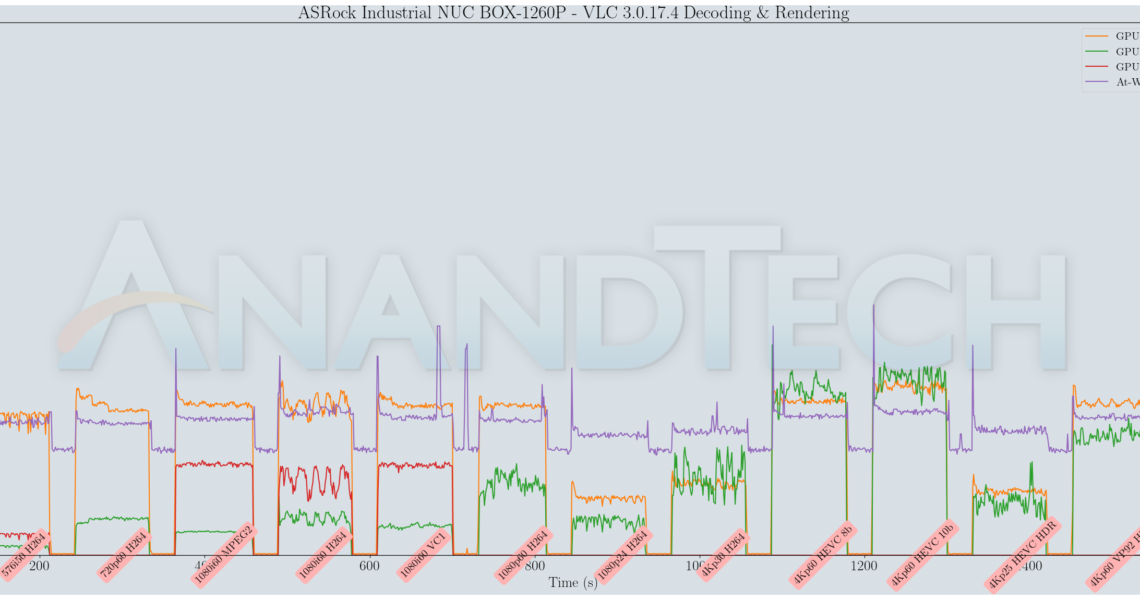
The decoding efficiency (GPU usage and at-wall power consumption against time) for the YouTube playback session is graphed below for both systems.
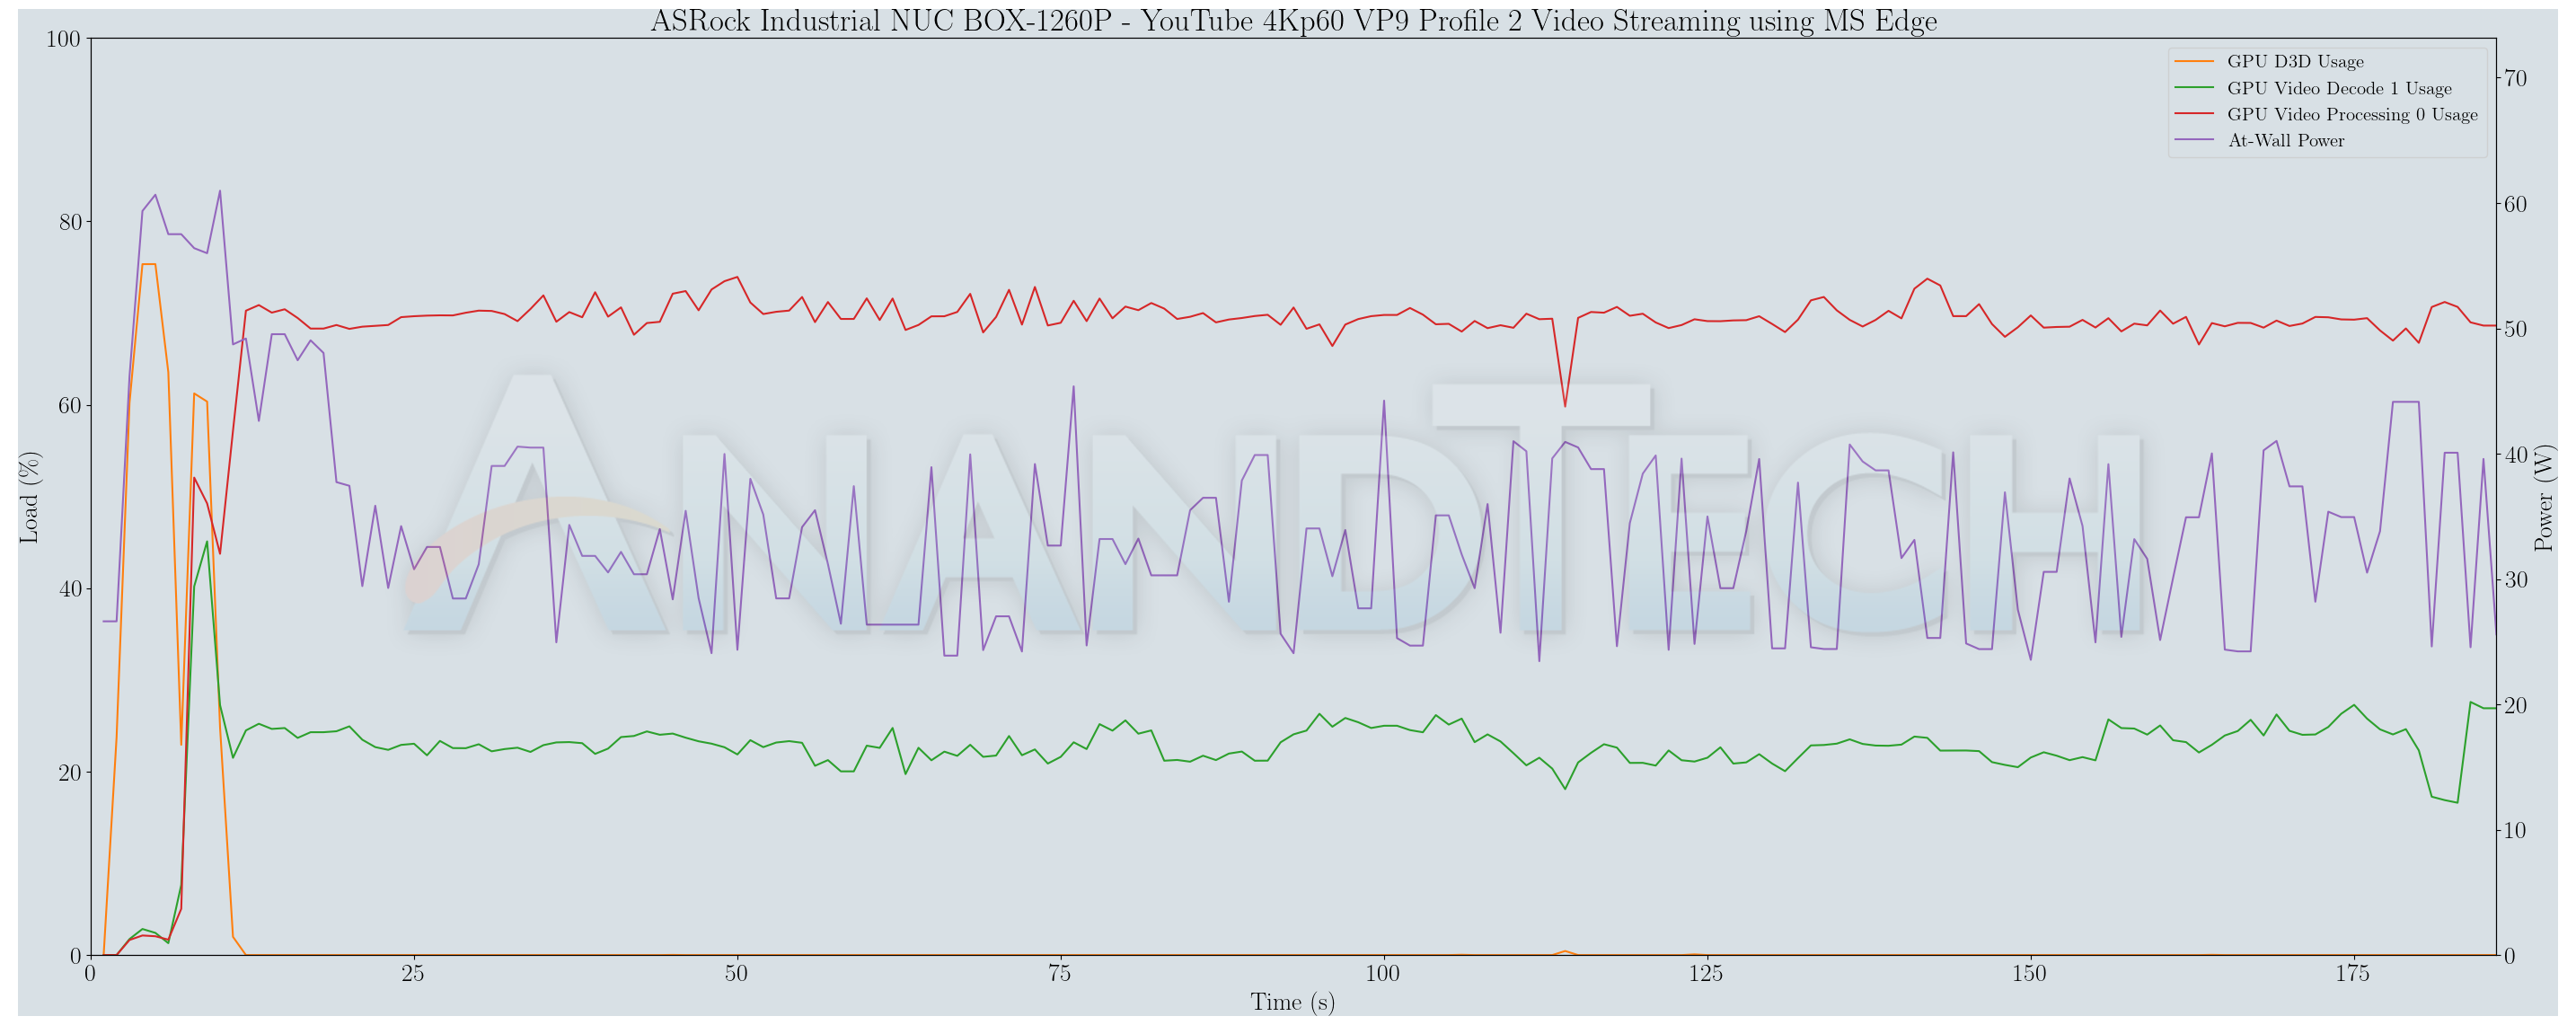
YouTube Streaming Decoding Efficiency – ASRock Industrial NUC BOX-1260P
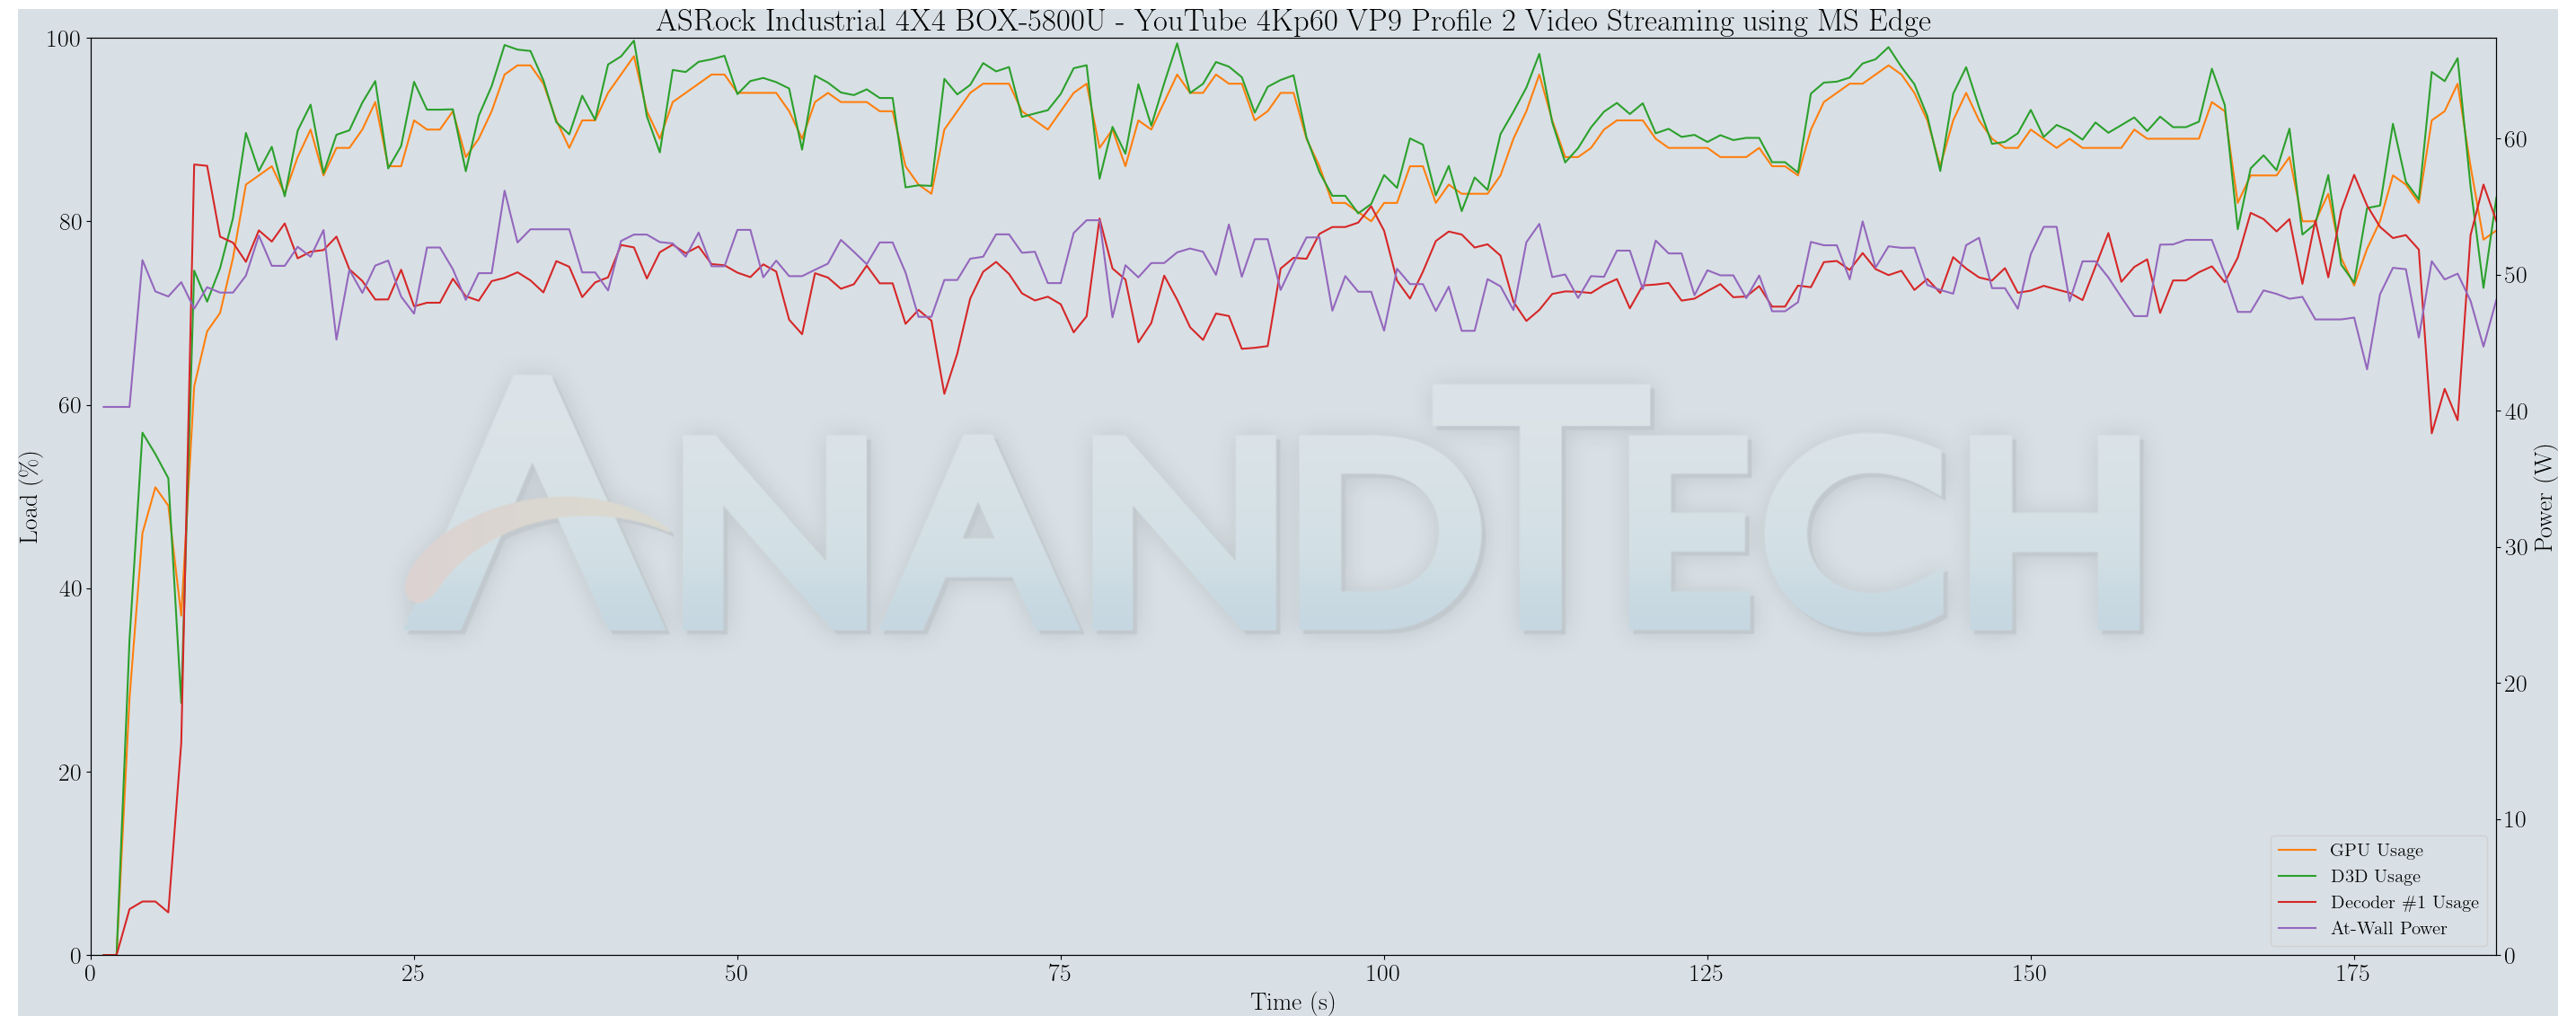 YouTube Streaming Decoding Efficiency – ASRock Industrial 4X4 BOX-5800U
The reason for the dropped frames seems to be in the excessive D3D usage of the Cezanne GPU. The decoder load is also quite high at 80% and the at-wall numbers are close to 50W. In contrast, the NUC BOX-1260P consumes around 32W for the same playback while dropping barely any frames. The load on the decoder is around 25% with the video processor logic in the GPU kept active around 70%. Overall, the hardware acceleration offered by Alder Lake-P is very effective, while the Radeon iGPU struggles here despite claiming hardware decoding support for VP9 Profile 2.
Hardware-Accelerated Encoding and Decoding
The transcoding benchmarks in the systems performance section presented results from evaluating the QuickSync encoder within Handbrake’s framework. The iGPU in the NUC BOX-1260P support hardware encode for AVC, JPEG, HEVC (8b and 10b, 4:2:0 and 4:4:4), and VP9 (8b and 10b, 4:2:0 and 4:4:4). The capabilities of the decoder engine are brought out by DXVAChecker.
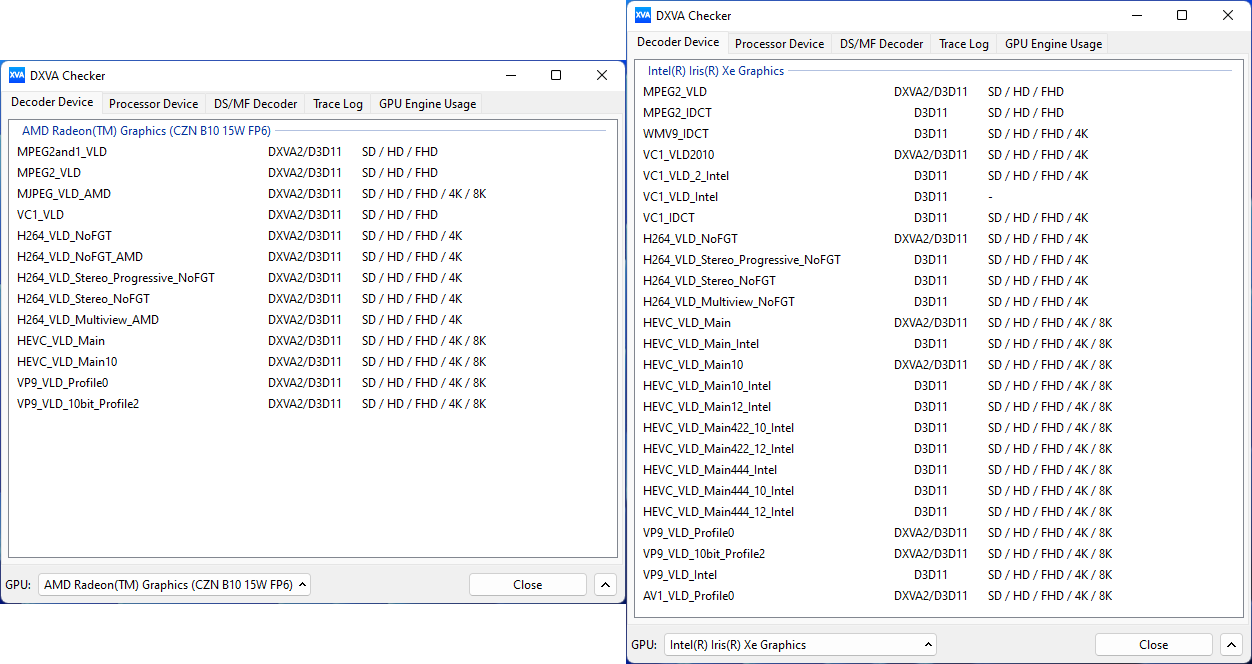
Video Decoding Hardware Acceleration
ASRock Industrial 4X4 BOX-5800U (L) and ASRock Industrial NUC BOX-1260P (R)
While MJPEG decode acceleration is available in Cezanne, Alder Lake-P does not offer it. In any case, most MJPEG streams are low-resolution and low-frame rate, which can be easily handled via software. The decoding capabilities of the Iris Xe Graphics are more comprehensive than Cezanne’s.
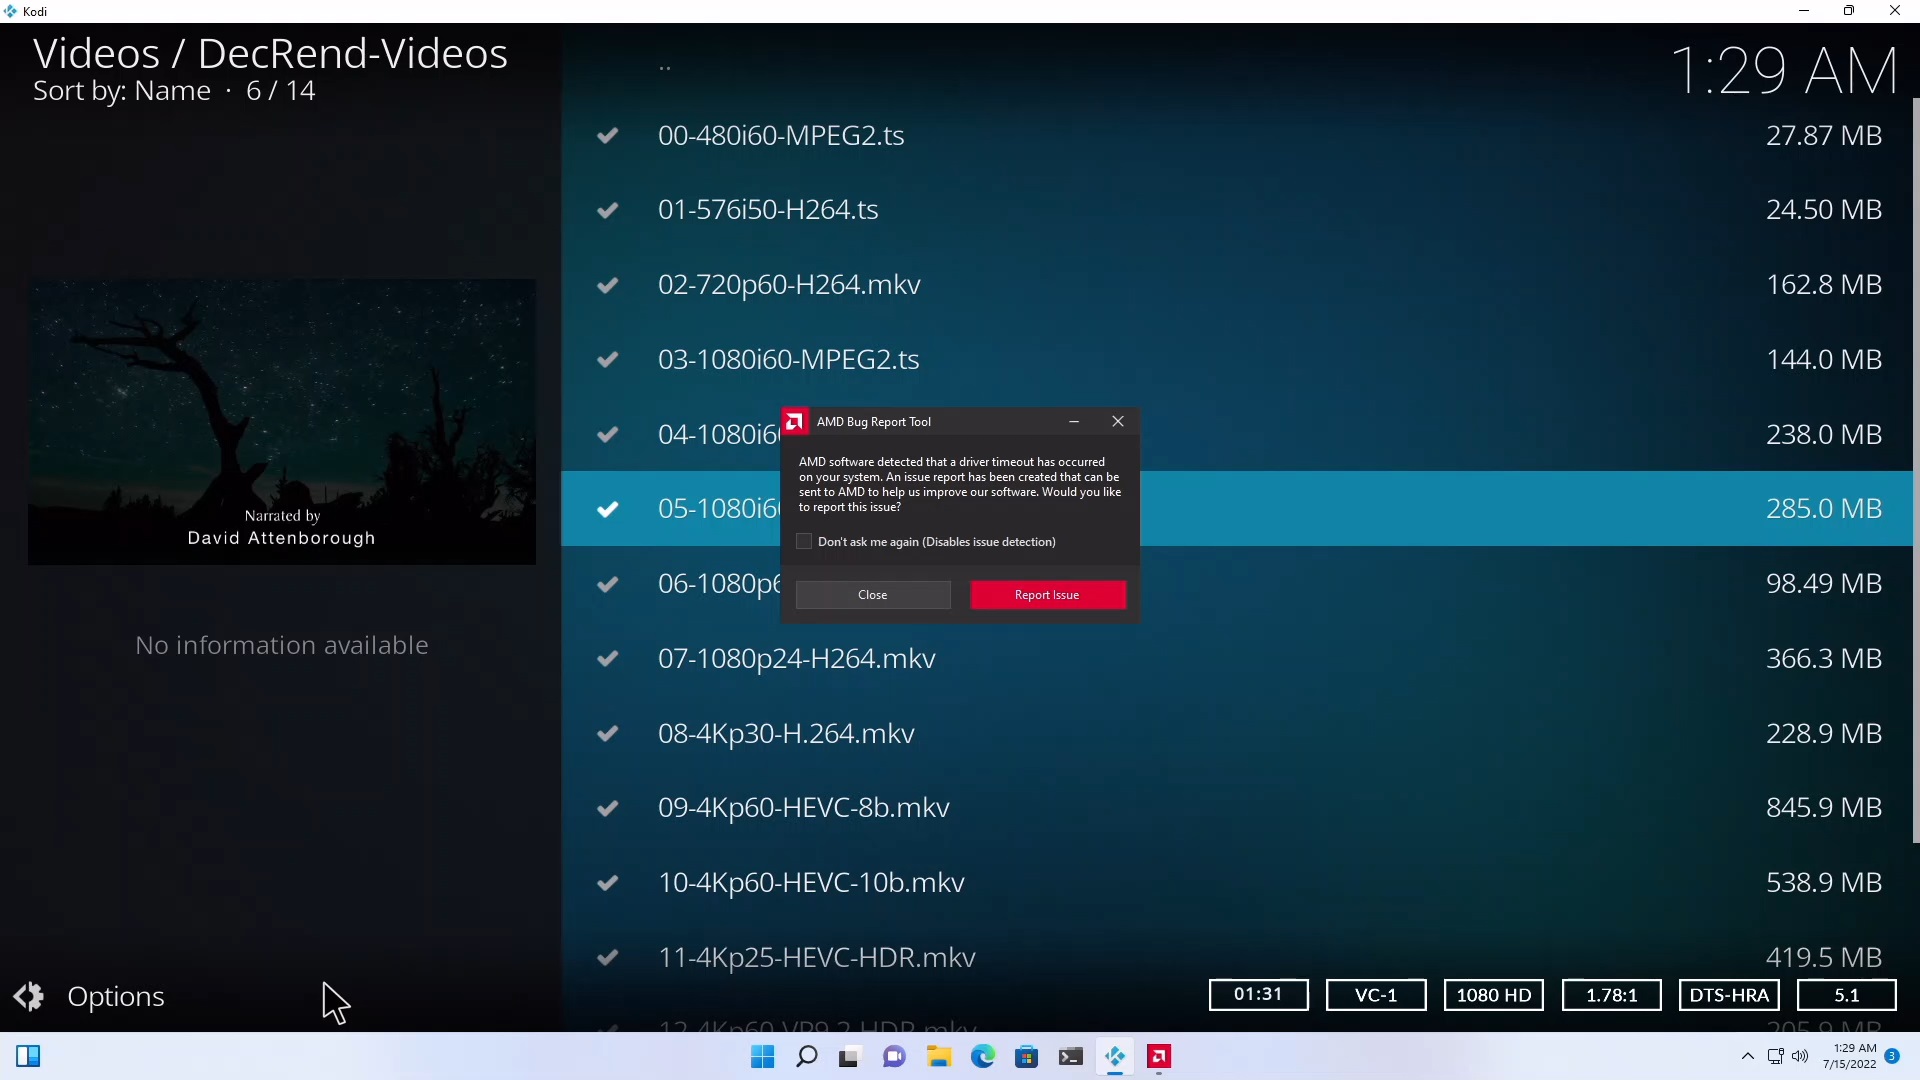
Local Media Playback
Evaluation of local media playback and video processing is done by playing back files encompassing a range of relevant codecs, containers, resolutions, and frame rates. A note of the efficiency is also made by tracking GPU usage and power consumption of the system at the wall. Users have their own preference for the playback software / decoder / renderer, and our aim is to have numbers representative of commonly encountered scenarios. Considering the target market for UCFF systems like the ASRock Industrial NUC BOX and 4X4 BOX series, we played back the test streams using the following install-and-forget combinations:
- VLC 3.0.17.4
- Kodi 19.4
The fourteen test streams (each of 90s duration) were played back from the local disk with an interval of 30 seconds in-between. Various metrics including GPU usage and at-wall power consumption were recorded during the course of this playback.
All our playback tests were done with the desktop HDR setting turned on. It is possible for certain system configurations to automatically turn on/off the HDR capabilities prior to the playback of a HDR video, but, we didn’t take advantage of that in our testing.
VLC and Kodi
VLC is the playback software of choice for the average PC user who doesn’t need a ten-foot UI. Its install-and-play simplicity has made it extremely popular. Over the years, the software has gained the ability to take advantage of various hardware acceleration options. Kodi, on the other hand, has a ten-foot UI making it the perfect open-source software for dedicated HTPCs. Support for add-ons make it very extensible and capable of customization. We played back our test files using the default VLC and Kodi configurations, and recorded the following metrics.
| ASRock Industrial NUC BOX-1260P Video Playback Efficiency – VLC and Kodi | |||
| ASRock Industrial 4X4 BOX-5800U Video Playback Efficiency – VLC and Kodi | |||
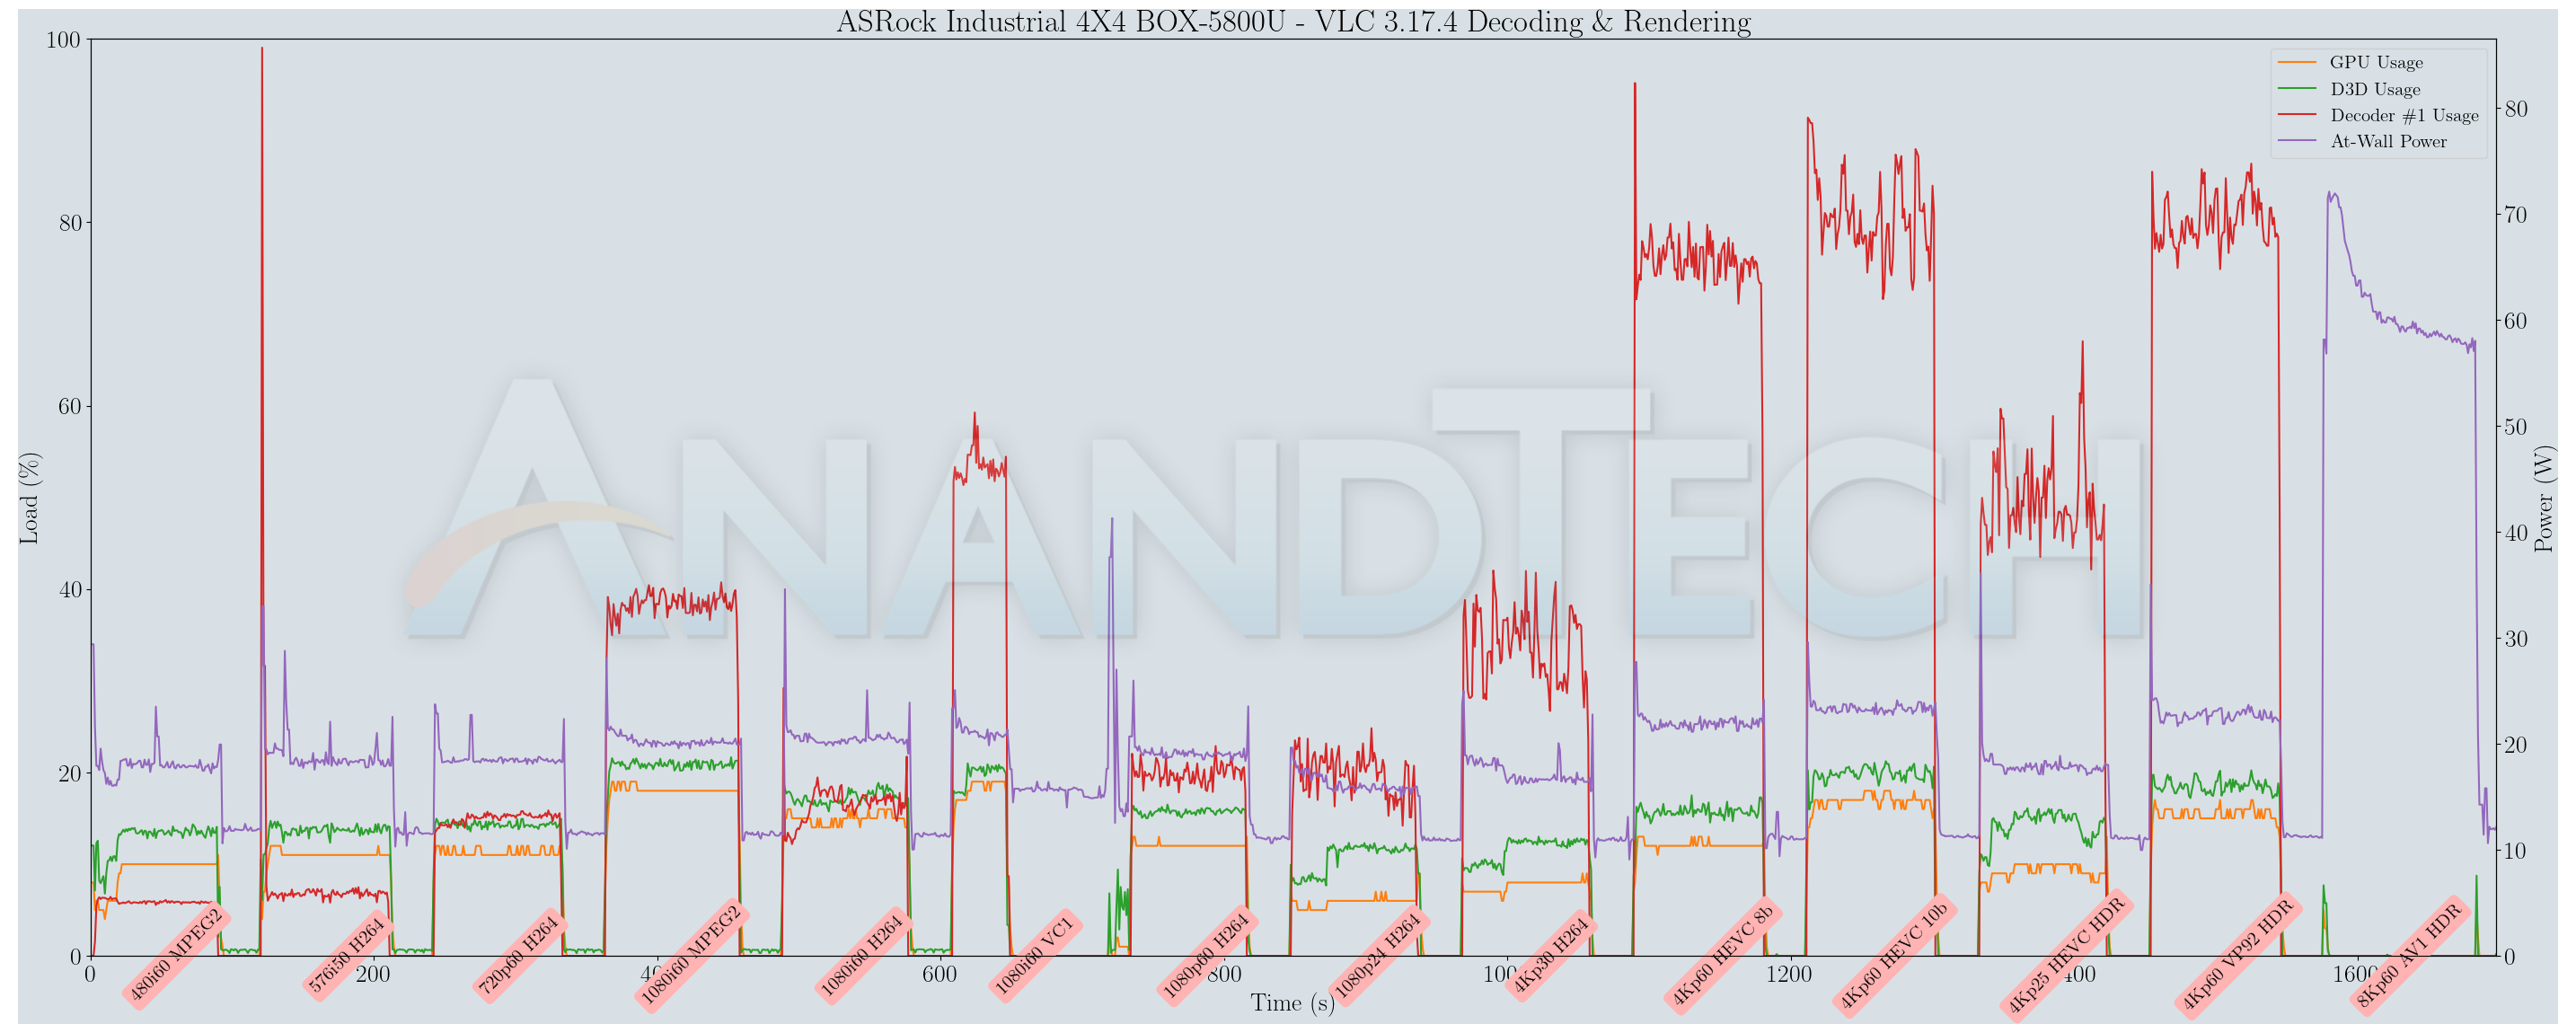
Both players in both systems had great trouble handling the 8Kp60 AV1 clip, due to the absence of hardware acceleration. In addition to consuming lots of power, the playback was just a sequence of frames updated every few seconds. Other than that, all other codecs played without missing a frame, with hardware acceleration activated for low-power playback in the NUC BOX-1260P. For the 4X4 BOX-5800U, some of the high frame-rate / high-resolution files encountered minor stuttering (seen when the decoder usage spiked upwards of 80% in the above graph) in VLC, but managed better playback in Kodi. The interlaced VC-1 clip presented some challenges, with the driver crashing mid-way through the playback in both VLC and Kodi. However, under certain Kodi configurations (in terms of full-sceren / windowed / window size), the playback would sometimes be successful. VLC would consistently crash.
While AMD needs to work on its drivers, the issue with the NUC BOX-1260P for AV1 decoding is one of software. Once Kodi and VLC get updates to take advantage of the hardware-accelerated AV1 decoding support in the newer Intel processors, the system should be able to play back the AV1 clip without issues.
Overall, the NUC BOX-1260P can be recommended for media playback of all varieties. The 4X4 BOX-5800U works well for most common codecs, but playback – either local or via network streaming – could sometimes be a hit or a miss depending on the codec, resolution, and browser.
The power consumption at the wall was measured with a 4K display being driven through the HDMI port of the system. In the graph below, we compare the idle and load power of the ASRock Industrial NUC BOX-1260P and 4X4 BOX-5800U with other systems evaluated before. For load power consumption, we ran the AIDA64 System Stability Test with various stress components, as well as our custom stress test with Prime95 / Furmark, and noted the peak as well as idling power consumption at the wall.
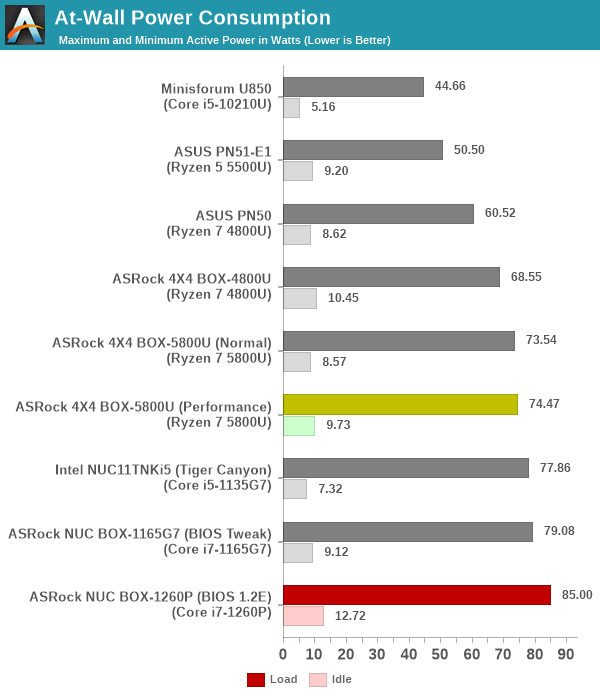
The numbers are consistent with the TDP and suggested PL1 / PL2 values for the processors in the systems, and do not come as any surprise. With a 64W PL2, the NUC BOX-1260P has the highest load power consumption. The choice of components (such as a Gen 4 SSD) also contribute to the higher idle power numbers. The Cezanne system is not that far behind, with a peak of around 75W despite a much lower PL2. It is likely that the Ryzen 7 5800U treats the configured power range as only a suggestion, and tries to go much higher (as high as 54W) as long as thermal headroom is available.
Stress Testing
Our thermal stress routine is a combination of Prime95, Furmark, and Finalwire’s AIDA64 System Stability Test. The following 9-step sequence is followed, starting with the system at idle:
- Start with the Prime95 stress test configured for maximum power consumption
- After 30 minutes, add Furmark GPU stress workload
- After 30 minutes, terminate the Prime95 workload
- After 30 minutes, terminate the Furmark workload and let the system idle
- After 30 minutes of idling, start the AIDA64 System Stress Test (SST) with CPU, caches, and RAM activated
- After 30 minutes, terminate the previous AIDA64 SST and start a new one with the GPU, CPU, caches, and RAM activated
- After 30 minutes, terminate the previous AIDA64 SST and start a new one with only the GPU activated
- After 30 minutes, terminate the previous AIDA64 SST and start a new one with the CPU, GPU, caches, RAM, and SSD activated
- After 30 minutes, terminate the AIDA64 SST and let the system idle for 30 minutes
Traditionally, this test used to record the clock frequencies – however, with the increasing number of cores in modern processors and fine-grained clock control, frequency information makes the graphs cluttered and doesn’t contribute much to understanding the thermal performance of the system. The focus is now on the power consumption and temperature profiles to determine if throttling is in play.
Our first look is at the NUC BOX-1260P. The power consumption and temperature plots against time are presented below.
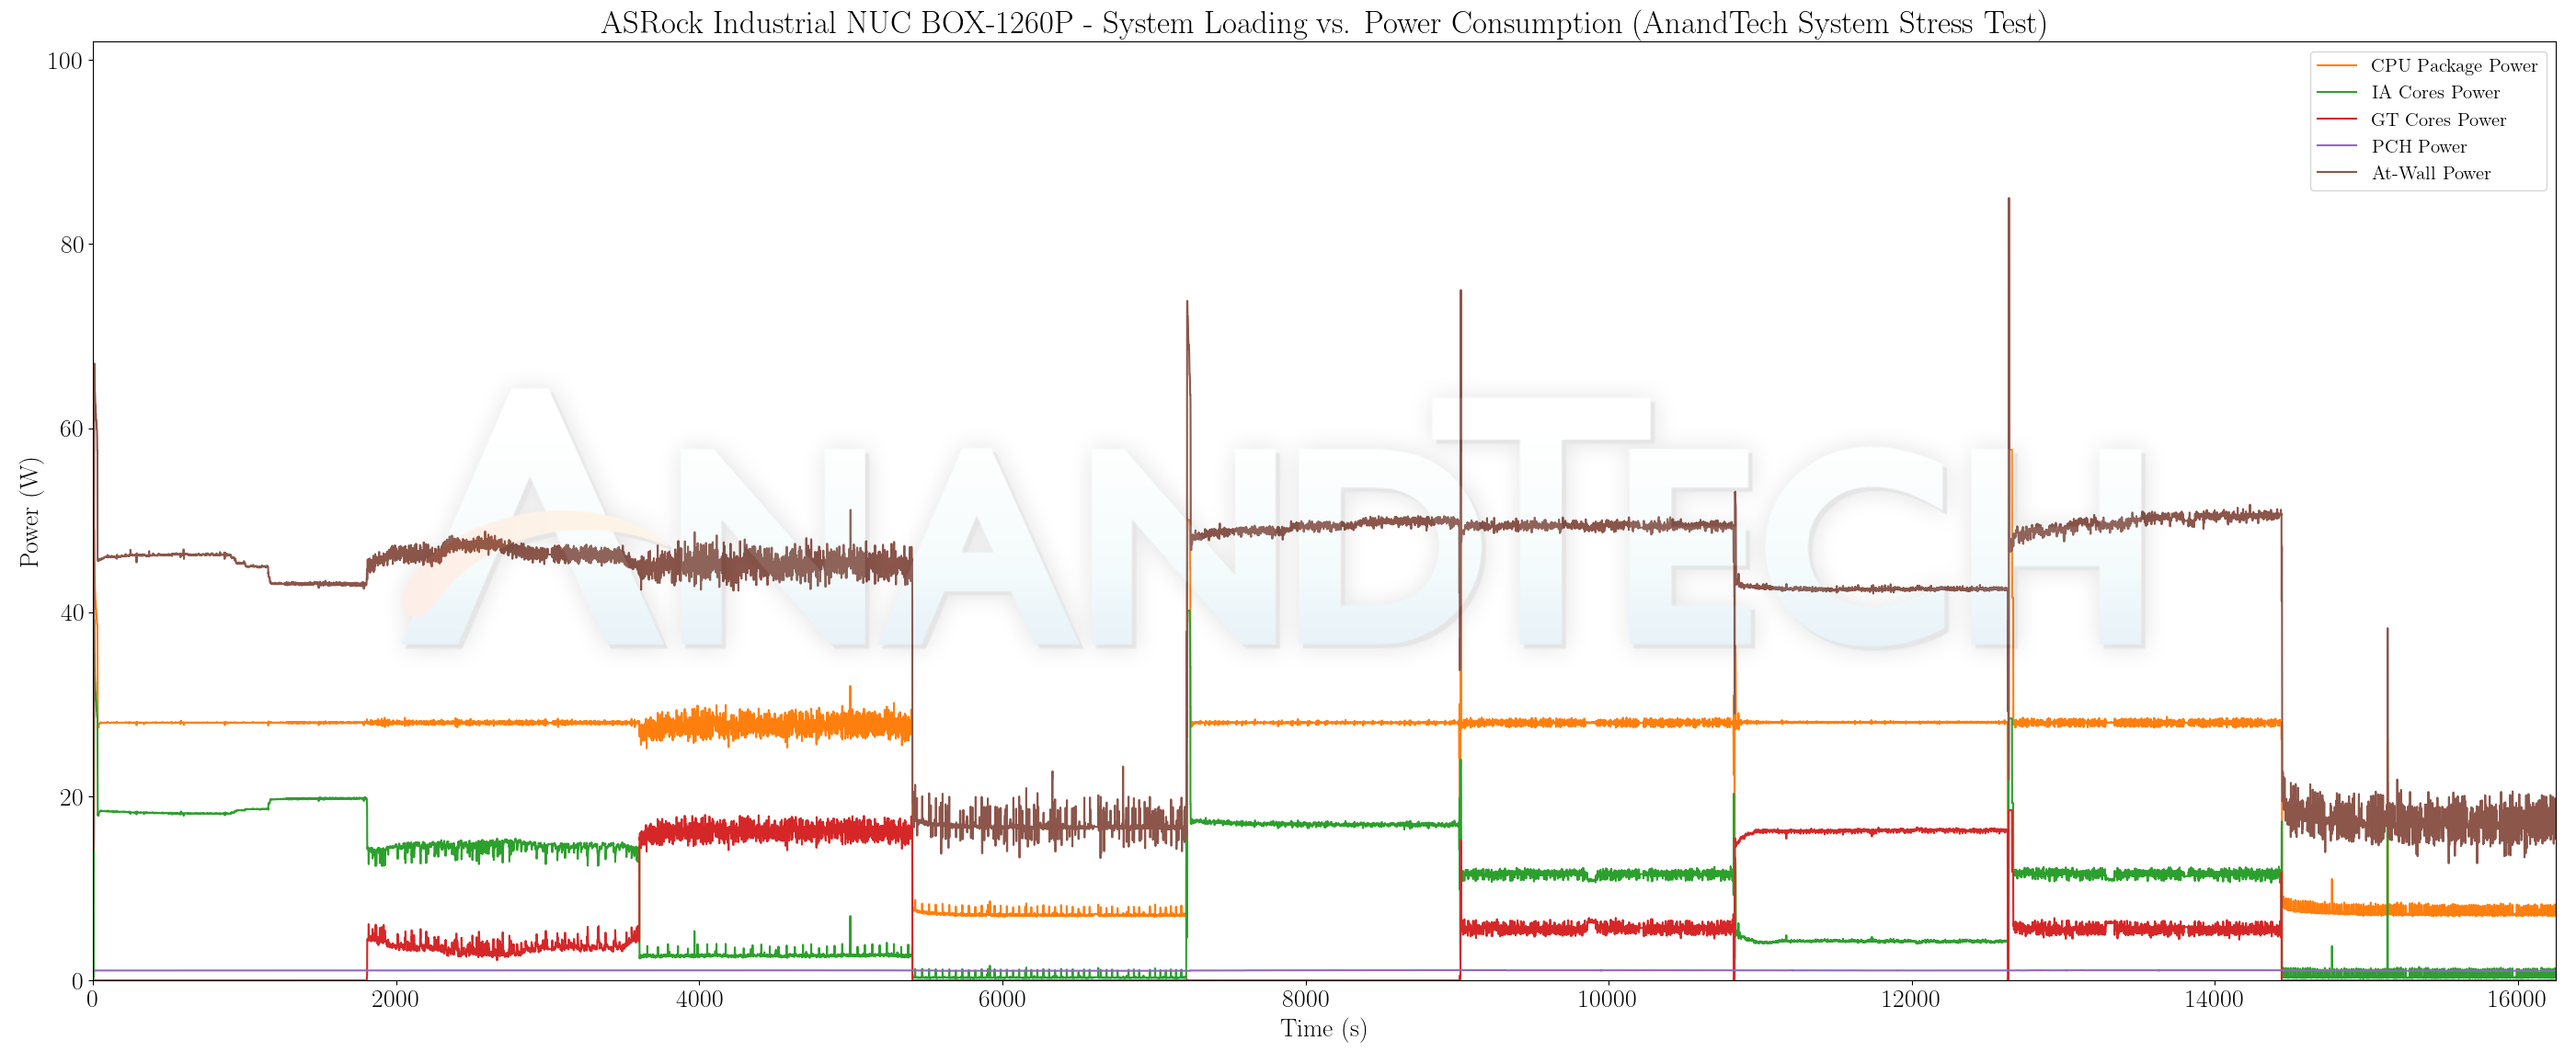
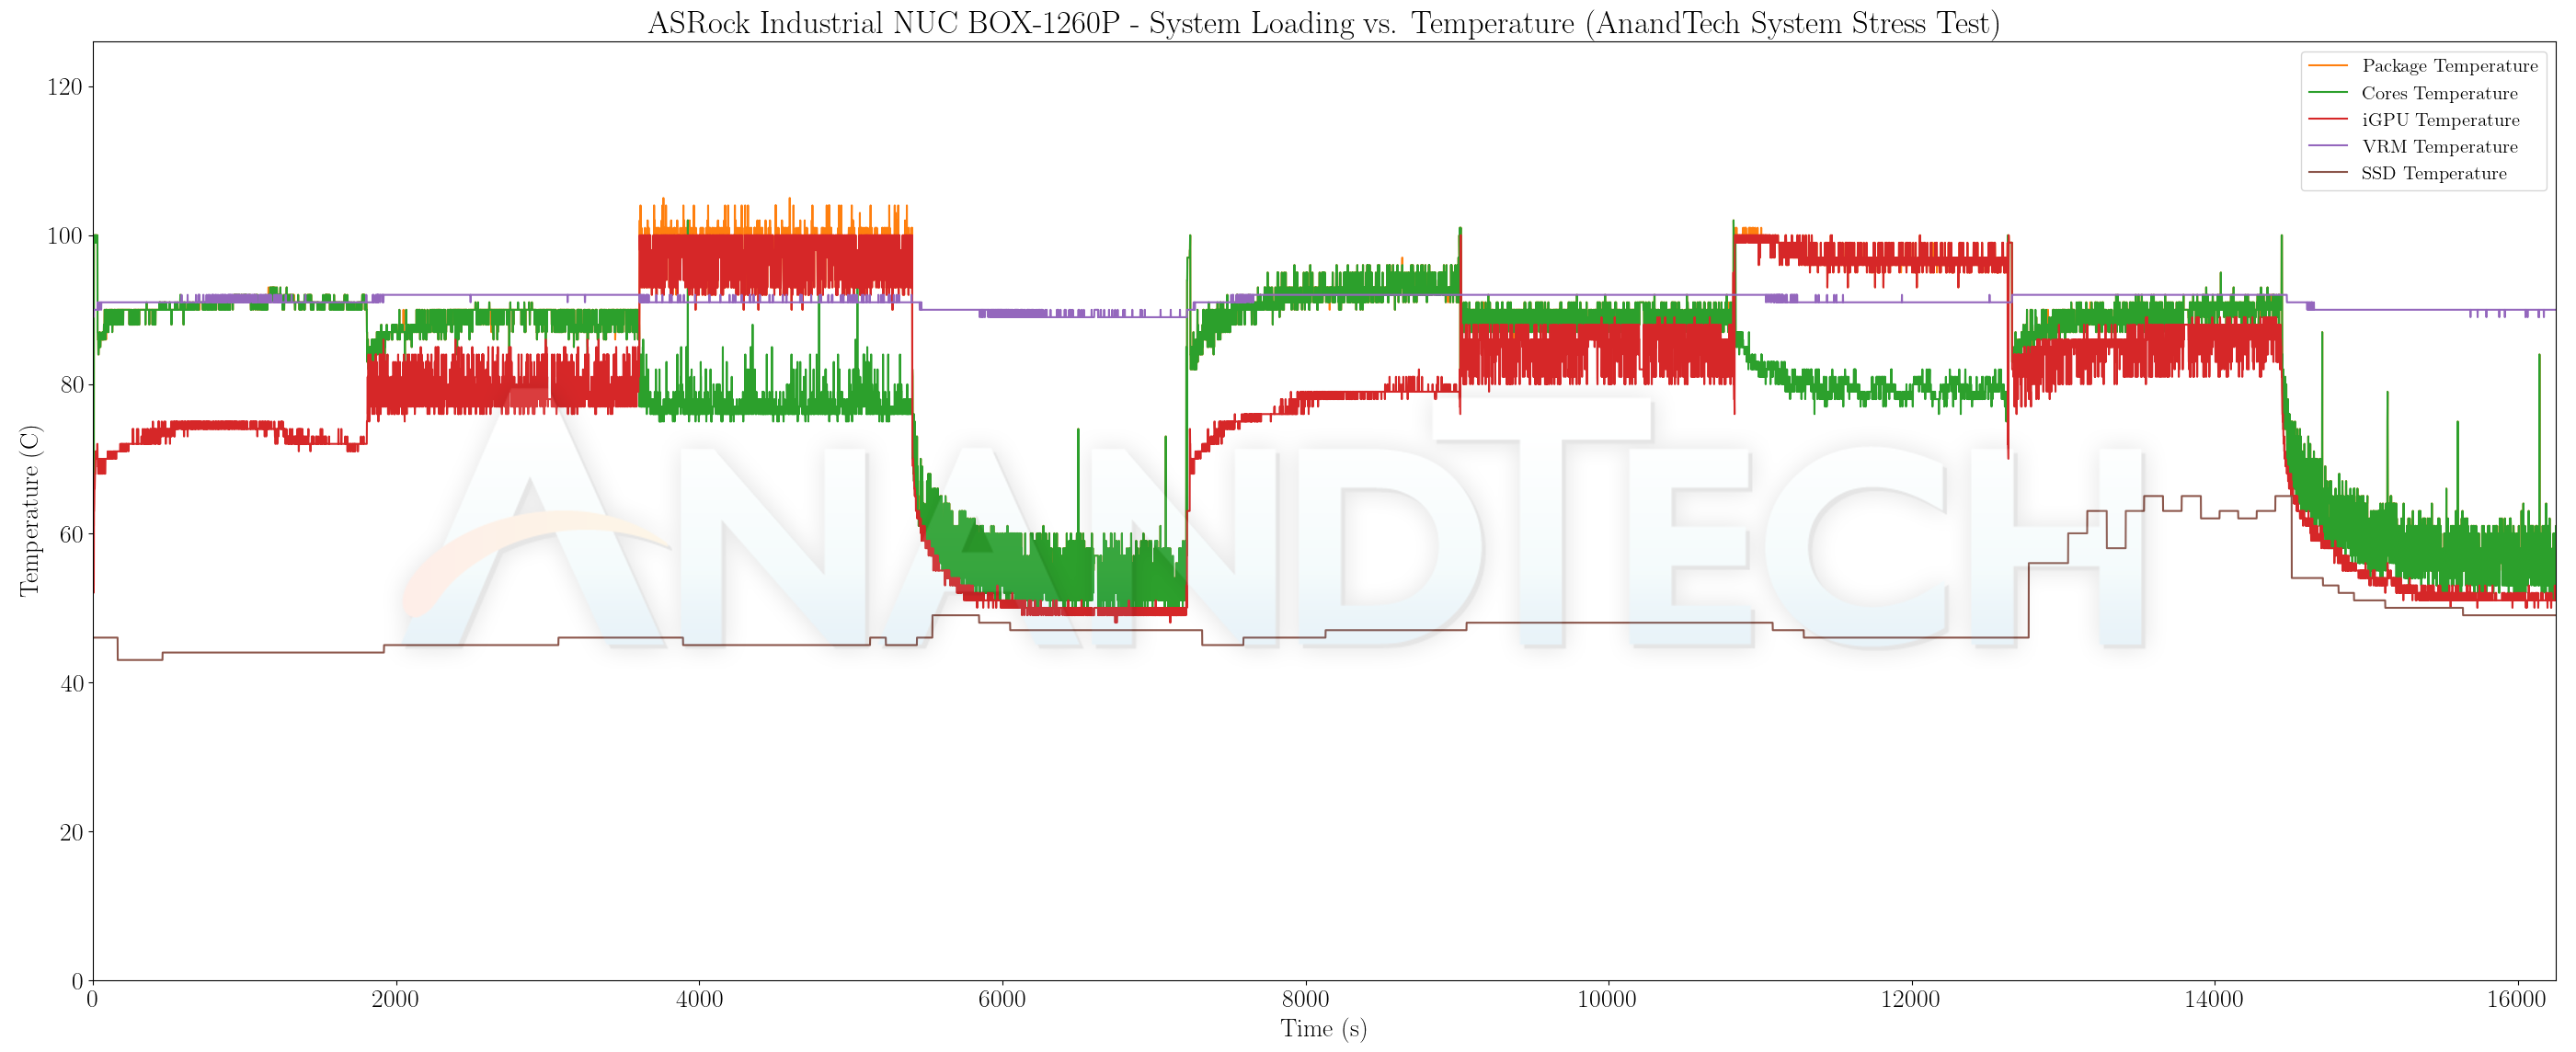
The system is able to easly handle CPU-only and CPU+GPU loading. However, GPU-only loading ramps up the temperature close to the junction (105C), with the package power having to throttle slightly to keep the temperature in check. This was not seen in AIDA64’s system stress test components.
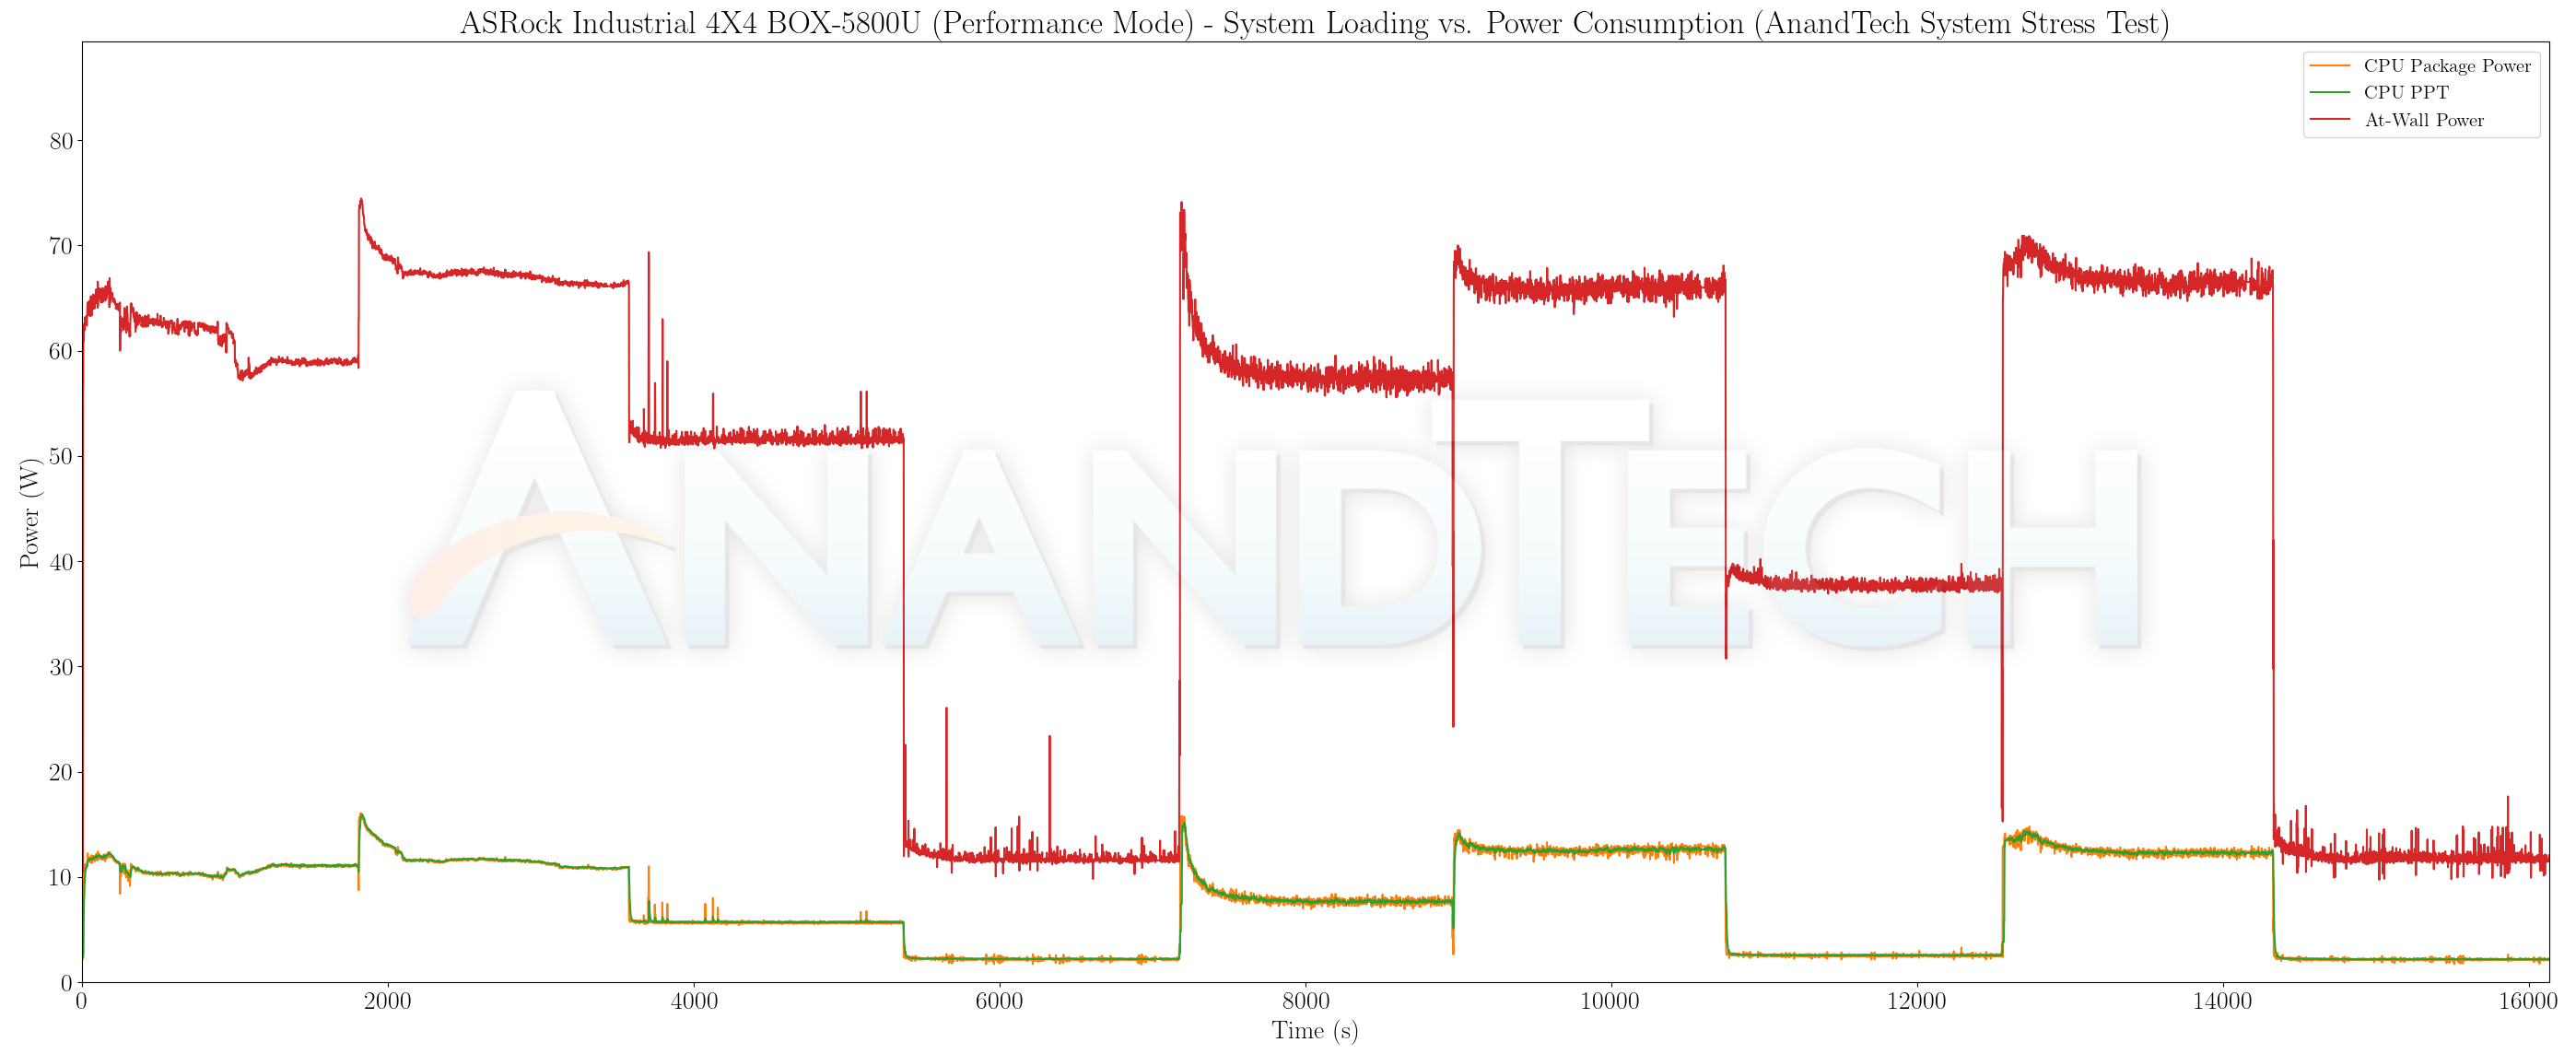
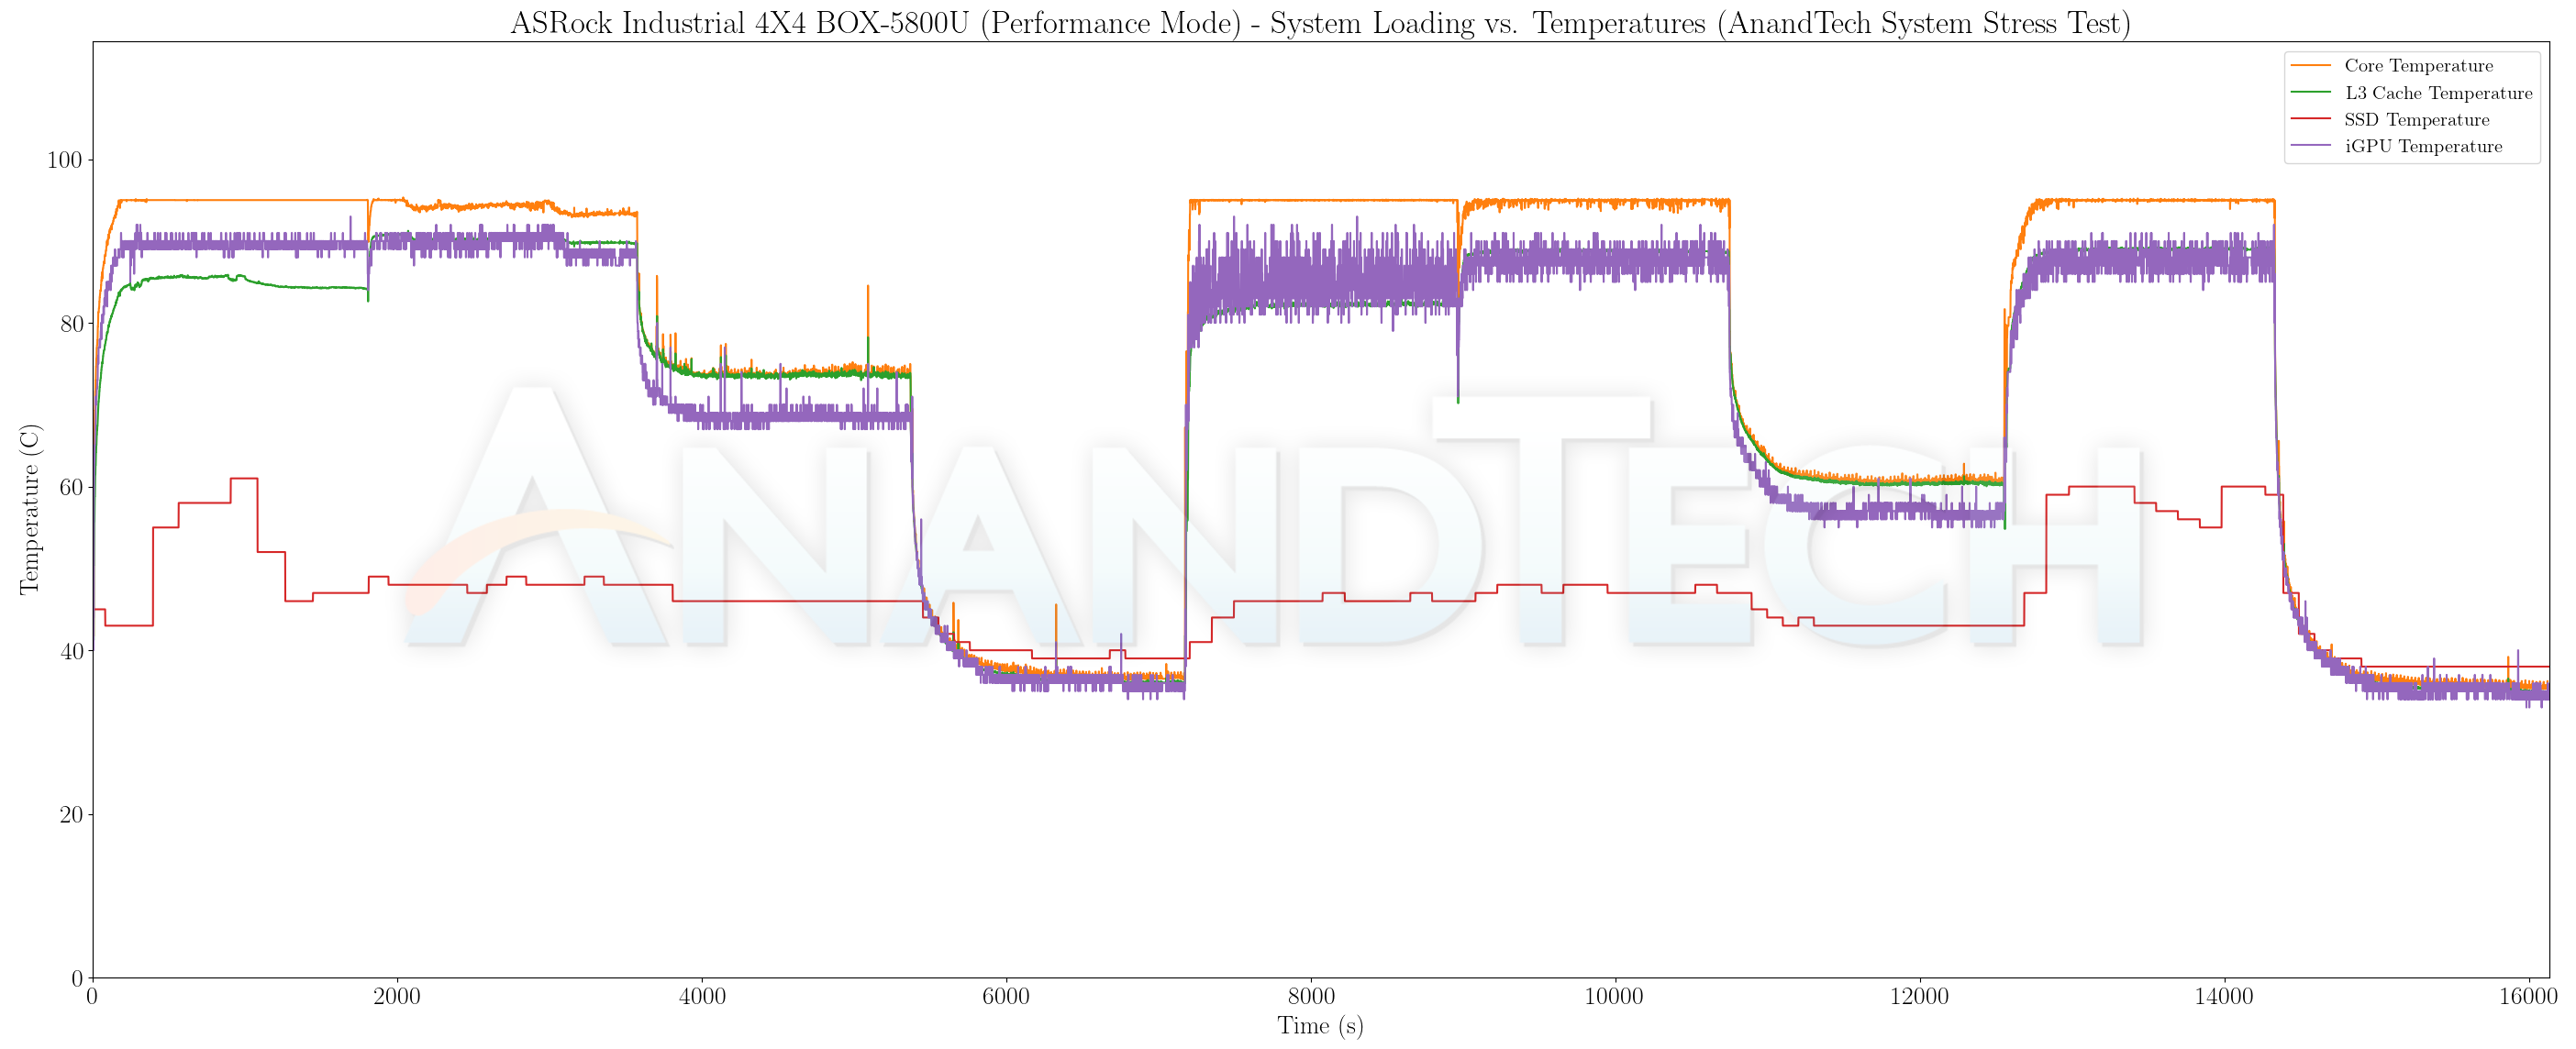
Moving on to the 4X4 BOX-5800U, we first look at the temperature and power consumption plots for the system configured with the default BIOS options (Normal mode).
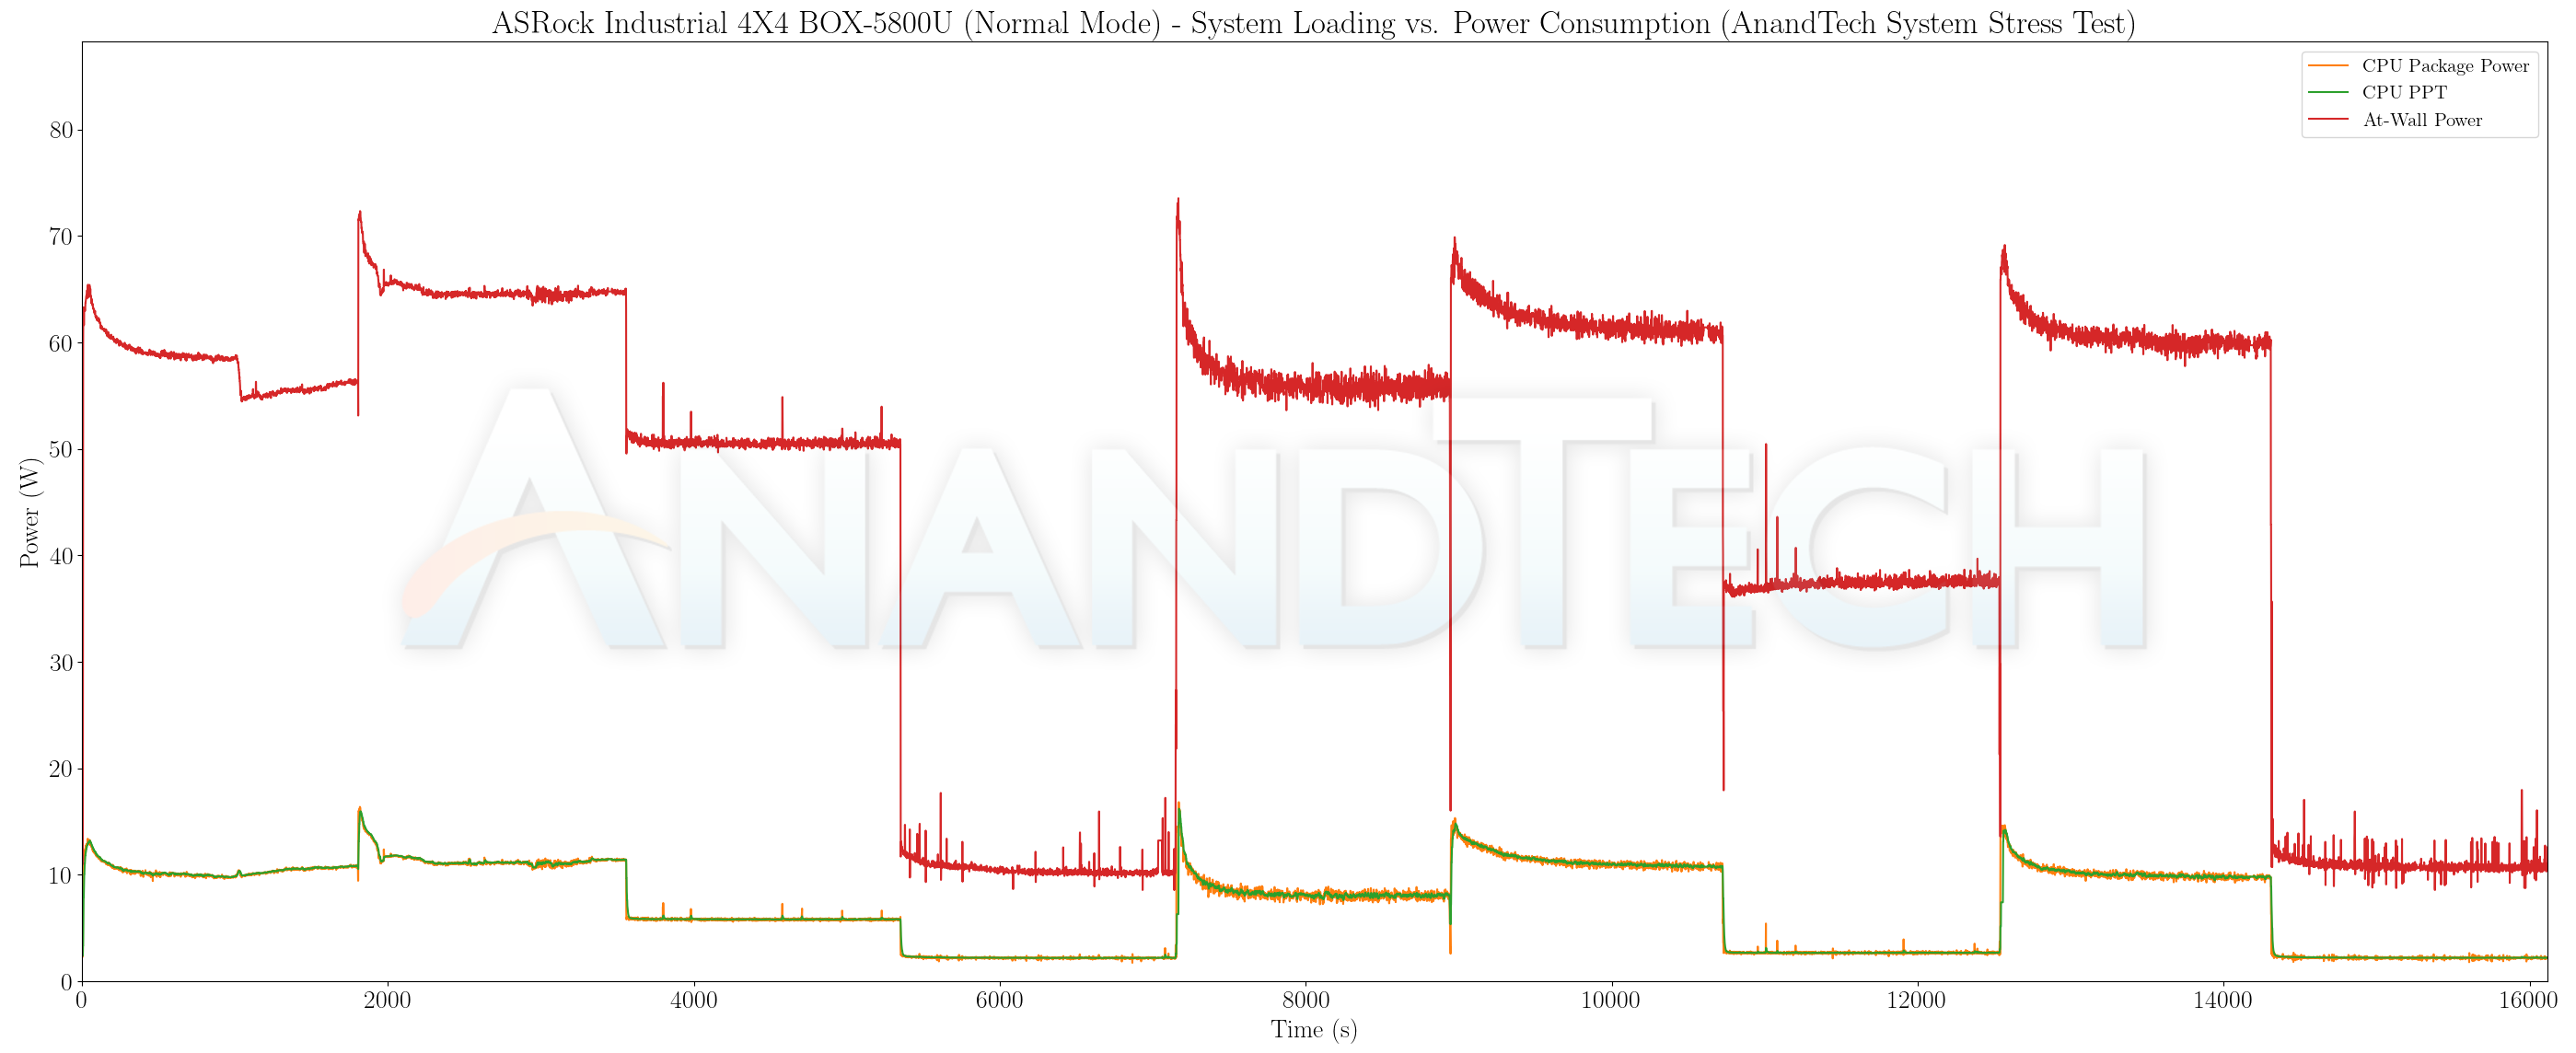
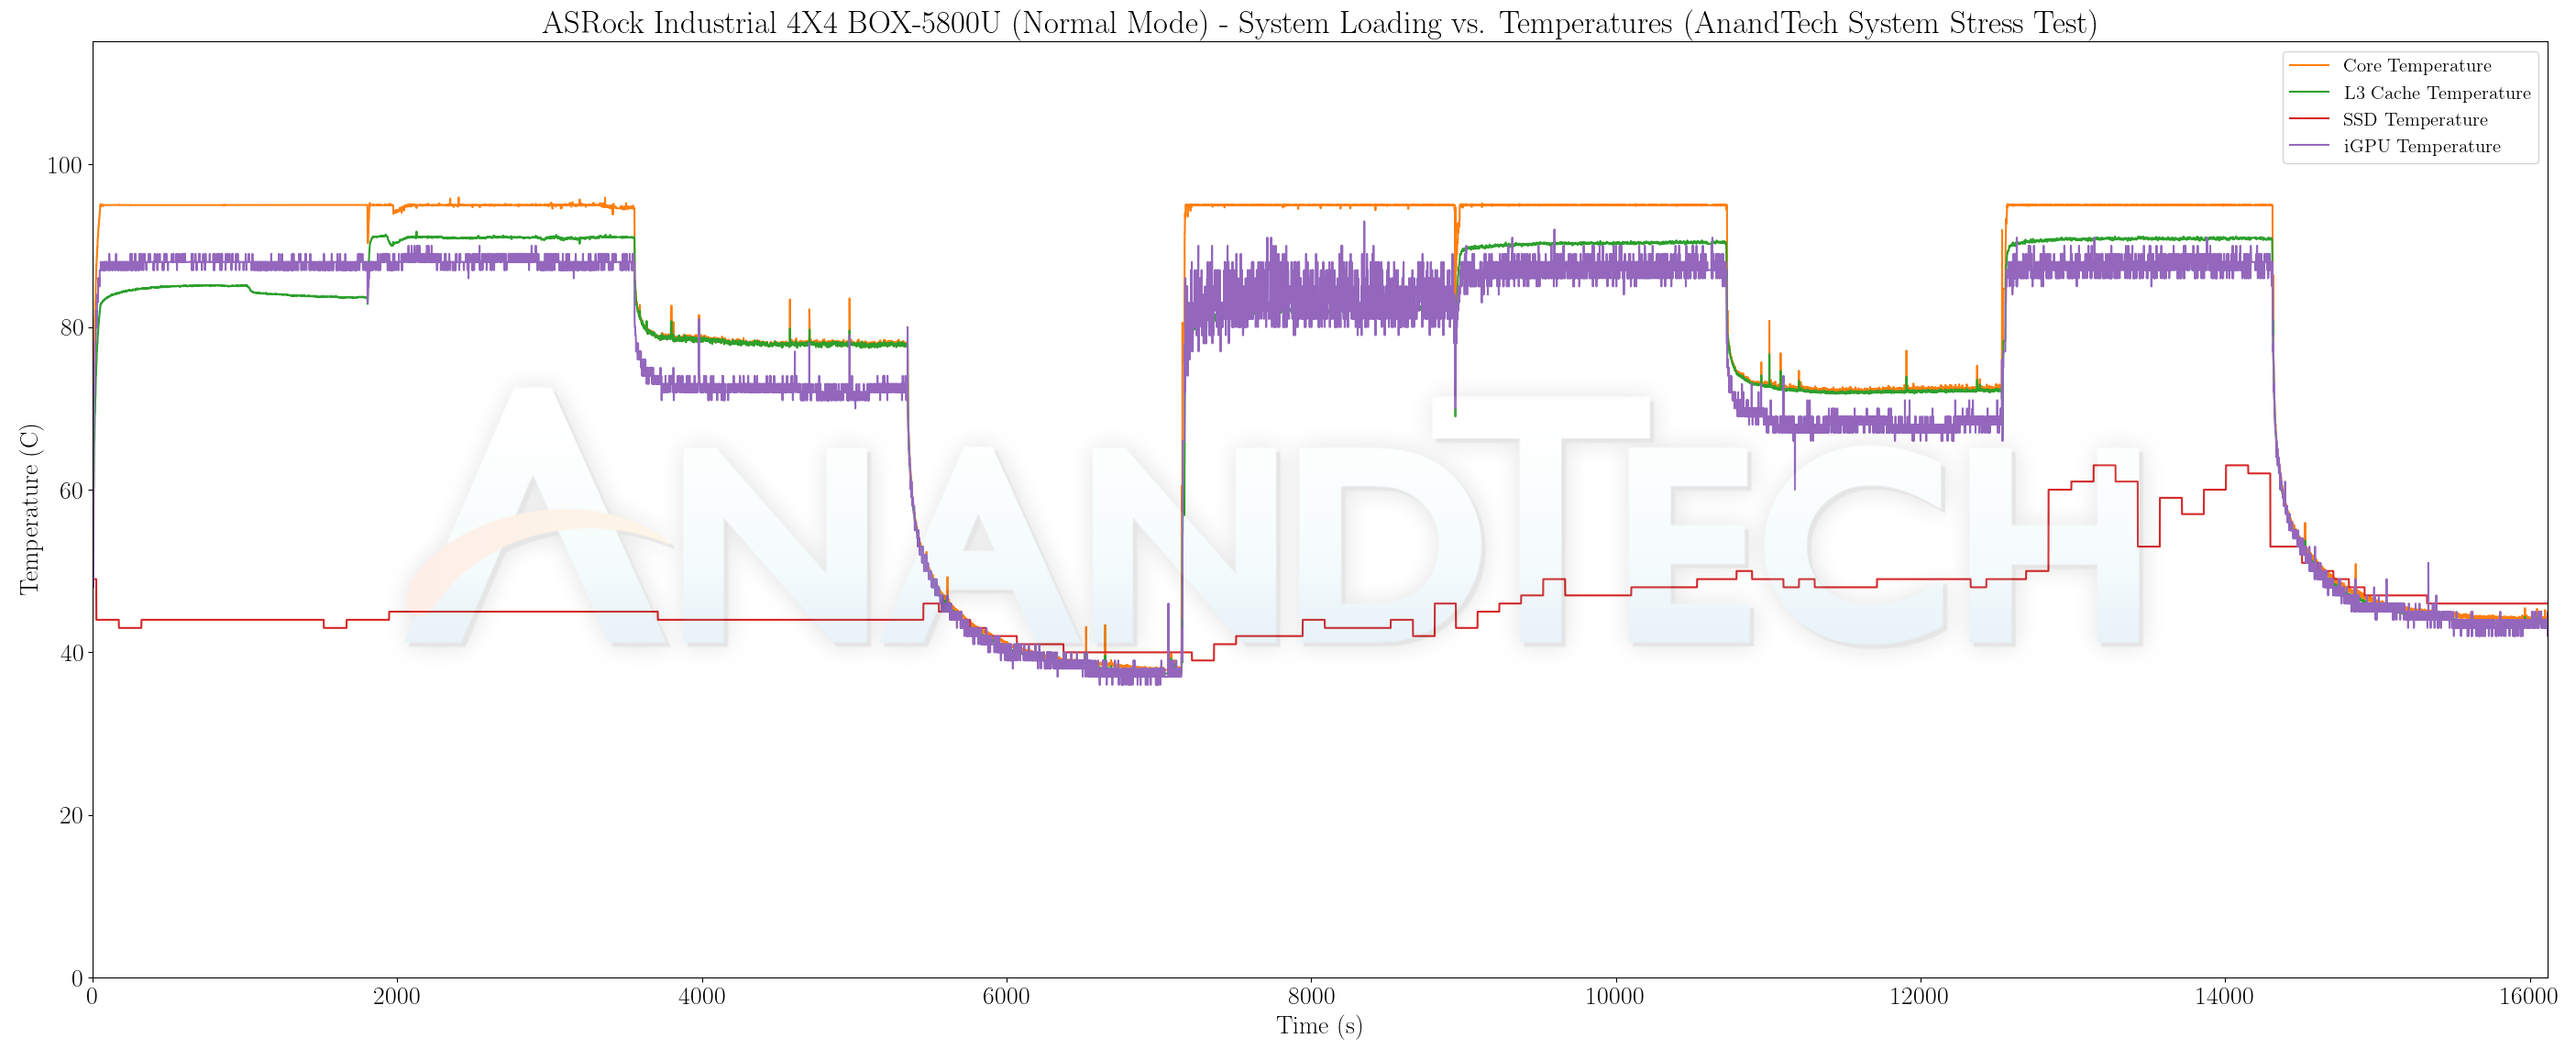
The CPU package power tracking (PPT) and package power consumption numbers reported by HWiNFO seem highly unreliable in the context of the independently recorded at-wall power consumption. We make some inferences based on the temperatures and the at-wall power numbers. It is clear that the system ‘throttles’ as soon as the package temperature hits 95C. The GPU-only loading scenario is not as stressful as it was for the Alder Lake-P system. It appears that the system is able to sustain 65W at the wall when both CPU and GPU are loaded, while keeping the temperature of the package around 95C.
Finally, we see the behavior of the same parameters when the same stress sequence is applied with the CPU operating mode set to ‘Performance’ in the BIOS.
The performance mode appears to set the sustainable at-wall power consumption number around 68W. The cooling solution is good enough for the configured PL1 / PL2 values, but it can’t keep up with the 54W maximum target TDP of the Ryzen 7 5800U for a long time.
Networking and storage are aspects that may be of vital importance in specific PC use-cases. On the wired front, ASRock Industrial has equipped both systems with dual LAN ports, expanding the market appeal and application scenarios. While both LAN ports are 2.5G in the NUC BOX-1260P, the 4X4 BOX-5800U has a gigabit LAN port and a 2.5G port. With vPro and DASH support, the second LAN port can be configured even for out-of-band management if necessary. On the wireless front, both systems are on the leading edge, with WLAN cards supporting Wi-Fi 6E and enabling communication via the unhindered 6 GHz band (assuming the availability of a Wi-Fi 6E router). One of the interesting shifts from the 4X4 BOX-4000 series is the change in the WLAN card make – from Intel’s AX200 to the Mediatek MT7922 (co-branded with AMD as RZ616). Being a new WLAN card, we made it a point to utilize the system with only Wi-Fi communication for networking duties for a couple of days. The Mediatek chipset worked without hitches in my evaluation setup, though there are some threads online regarding driver issues related to the system waking up from sleep.
On the storage side, ASRock Industrial supports the installation of a 2.5″ drive as well as a M.2 2260 / 2280 SSD. However, installation of a 2.5″ drive may negatively impact airflow and cooling for the installed M.2 SSD – so, the company advises against using the 2.5″ drive capability despite its availability. We configured the systems with Gen 3 / Gen 4 SSDs that are tuned towards low power (the Patriot P300 is a DRAM-less SSD, while the ADATA XPG Gammix S50 Lite trades peak performance for power efficiency despite being a PCIe Gen 4 x4 drive. From a benchmarking perspective, we provide results from the WPCstorage test of SPECworkstation 3.1. This benchmark replays access traces from various programs used in different verticals and compares the score against the one obtained with a 2017 SanDisk 512GB SATA SSD in the SPECworkstation 3.1 reference system.
| SPECworkstation 3.1.0 – WPCstorage SPEC Ratio Scores | |||
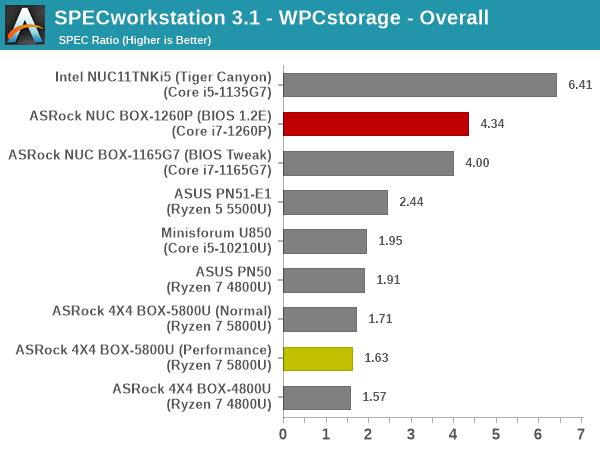
The graphs above present results for different verticals, as grouped by SPECworkstation 3.1. The storage workload consists of 60 subtests. Access traces from CFD solvers and programs such as Catia, Creo, and Soidworks come under ‘Product Development’. Storage access traces from the NAMD and LAMMPS molecular dynamics simulator are under the ‘Life Sciences’ category. ‘General Operations’ includes access traces from 7-Zip and Mozilla programs. The ‘Energy’ category replays traces from the energy-02 SPECviewperf workload. The ‘Media and Entertainment’ vertical includes Handbrake, Maya, and 3dsmax. Given that the comparison is between a wide range of SSDs in the systems – including both Gen 3 and Gen 4 NVMe, as well as SATA in the reference system, the relative numbers for most workloads are not surprising. The Samsung SSD 980 PRO in the Tiger Canyon NUC is ahead by a significant margin, followed by the ADATA XPG S50 Lite Gen 4 NVMe SSD (same one used in both the NUC BOX-1260P and BOX-1165G7). The DRAM-less Gen 3 Patriot P300 comes towards the end of the pack.
Closing Thoughts
At the end of our review process for the ASRock Industrial NUC BOX-1260P and the 4X4 BOX-5800U, we have insights into the key knobs that control system performance. These include, but are not restricted to, the PL1 and PL2 values and burst durations, the C-state settings, and ‘render standby’ settings. We also found that altering these settings always involve trade-offs in system performance, idling power numbers, and energy consumption for a given workload. It is also possible that settings helpful for a certain class of workloads might be detrimental to another set. In this context, we find that vendors need to carefully figure out the trade-offs and arrive at a set of settings that prove effective for the system’s target market. ASRock Industrial’s settings in the NUC BOX-1260P seemed to be tweaked for industrial and IoT applications, resulting in some strange performance regressions against previous generation NUCs and other UCFF systems. Overall, even with the current performance, we believe that ASRock Industrial and / or end-users have plenty of scope for optimizing the BIOS configuration further – particularly in the context of Thread Director not working as expected in our multi-tasking test.
In contrast, the Cezanne system – the 4X4 BOX-5800U – completed our standard evaluation process quite smoothly. We would have liked the Performance mode to be default, but with the added ability to fine-tune the fan curves – that is something for ASRock Industrial to attempt in the future. The performance numbers overall were close to what AMD promised when launching the processor family last year – a perceptible increase in performance over Renoir within the same power envelop.
Our thermal stress tests showed that both processors can get really hot when subject to extreme loading – the throttling and temperature profiles make it appear that ASRock Industrial and/or the processors themselves are stretching the limits of what can be comfortably handled by the cooling solution, given the form-factor limitations. It might be time for a slightly larger chassis that can incorporate a better cooling solution for the 4×4 boards. That could also provide scope for additional I/O options.
The evaluation process of the two systems also gave us the opportunity to closely compare the performance of Alder Lake-P and Cezanne. Due to the variation in configured power limits for both processors, it is not possible to do a scientific apples-to-apples comparison for each benchmark. However, keeping in mind that both processor operate within the same form factor and overall thermal budget in the two systems, some inferences can be made. The single-threaded performance lead enjoyed by Intel’s processors has been cut down significantly. In fact, the Cezanne-based APU handily bests what Tiger Lake-U can offer at similar power levels in single-threaded workloads. Alder Lake does have a slight edge, but the SYSmark energy consumption numbers showed that the Ryzen 7 5800U beats the Core i7-1260P easily in the performance per joule metric. It remains to be seen if Intel’s own Alder Lake NUC (Wall Street Canyon) can wrest back the lead in this metric (we have seen that ASRock Industrial has plenty of work to do with BIOS optimization).
Given that AMD has pretty much caught up with Intel in terms of performance while delivering additional energy efficiency, is it finally time to make a blanket recommendation for the Cezanne-based 4X4 BOX-5800U over the new and shiny Alder Lake-based NUC BOX-1260P? It is highly likely that Cezanne would be the more efficient choice for most workloads considered standalone. However, typical PC usage is a mix of workloads with different user interactions – and that is where AMD’s driver stability comes into the picture. Within the 3D performance constraints imposed by the integrated nature of the GPUs, Intel actually has the performance edge and arguably more stable drivers. The other aspect that AMD still needs to address is the I/O. The 4X4 BOX-580U comes with 3x 10Gbps and 2x 480 Mbps USB ports for peripherals. In contrast, the NUC BOX-1260P in the same form-factor delivers 4x 10Gbps and 1x 32Gbps (40Gbps if video bandwidth is also considered) ports for external I/O. The internal storage lanes are Gen 4 (compared to Gen 3 for the AMD system), and more PCIe lanes are available for on-board peripherals. The Ryzen platforms in the SFF / UCFF space are in dire need of USB4 ports with PCIe tunneling (say, using ASMedia’s ASM4242) to compete against the native Thunderbolt 4 ports available in Alder Lake systems.
On the pricing front, the NUC BOX-1260P can be purchased for US $650 (barebones), while the 4X4 BOX-4800U is only slightly cheaper at US $630 (barebones). The $20 premium is worth it, given the availability of a Thunderbolt 4 port and aditional high-speed I/O. The AMD-based 4X4 BOX-5800U can be a good fit when the workloads are primarily CPU-centric and energy efficiency is of vital importance – not things we would have even dreamed of concluding a few years back.