
The increasing popularity of small form-factor (SFF) PCs has allowed a number of second and third tier vendors to market their wares. While the trend was kickstarted by the Intel NUC in the early 2010s, recent years have seen various Asian companies such as Beelink, Chuwi, GEEKOM, MinisForum, etc. focus solely on these types of systems. Beelink has been slowly gaining popularity over the last five years or so with their wide range of products using the latest processors from Intel and AMD.
The high-performance UCFF / SFF PC market had been cornered by Intel processors for many years. Even after its resurgence with the Zen microarchitecture, AMD opted to focus on the high-performance desktop and server markets first. The mobile products based on each microarchitecture generation often launched with a delay of many quarters, but the gap has slowly been whittled down. Desktop Zen 4 Raphael launched in mid Q3 2022, while the mobile-focused Phoenix lineup launched in early Q1 2023. Over the last few years, we have seen vendors finally getting to introduce UCFF and SFF PCs based on mobile Zen silicon with a delay after the launch of corresponding notebooks. With Zen 4-based Phoenix, we are finally seeing mini-PCs and laptops almost launching simultaneously.
Beelink became one of the first vendors to launch an AMD Phoenix (Zen 4 CPU + RDNA3 iGPU in a power envelop suitable for notebooks) mini-PC lineup when they announced the GTR7 product line. The company sent over their entry-level version – the GTR7 7840HS – to put through our evaluation routine for small form-factor systems. Beelink is touting the use of vapor chamber-based cooling, allowing the Ryzen 7 7840HS to be configured with a 65W TDP (compared to the 35W-54W cTDP specified by AMD). The company also includes active cooling support for the RAM and a dedicated thermal solution for the SSDs. The GTR7 also provides many connectivity options – including five Type-A ports, and three Type-C ones (of which two are USB4 40 Gbps with full PCIe tunneling support). The system can support four simultaneous displays and also includes two 2.5 Gbps LAN ports. To top it all, the system also includes a fingerprint scanner on the top panel, and a secure power cable connector (magnetic) – all of this in a 6.61in x 4.72in x 1.92in package that is not much larger than a NUC.
The specifications and feature set of the GTR7 7840HS appears impressive, but initial reviews were not too kind. While there were some issues related to the GPU drivers and overheating in our initial testing (that resulted in the review getting delayed), we are happy to report that the latest drivers from AMD coupled with a new bottom panel (with perforations aligning with the system fan) completely resolved the roadblocks we faced. As a result, we are able to present this detailed review exploring the performance profile and value proposition of the Beelink GTR7 7840HS.
The majority of desktop deployments in the 2000s were unwieldy and in some cases, over-powered, for their use-cases. The advent of powerful processors in the early 2010s enabled mobile CPUs in ultra-compact and small form-factor systems to replace some of these bulky desktops. The rapid growth in this segment has created a number of companies focusing on UCFF and SFF desktop systems.
Most electronic products are brought to market with help from OEMs and ODMs. For example, early NUC systems were designed by Intel and sold under their brand name, but the actual manufacturing was done by Elitegroup Computing Systems (ECS) with the latter acting as the ODM (Original Design Manufacturer). On the other hand, Original Equipment Manufacturers (OEMs) design and manufacture the products, but allow other companies with marketing reach and distribution channels to present them under their own brand name. In some cases, OEMs create their own brands. Beelink is a private label brand of Shenzhen AZW Technology Co., Ltd.. The company manufactures both Intel and AMD-based systems.
Beelink has a relatively long history of marketing mini-PCs based on mobile Ryzen SoCs. Starting with the GTR based on the Ryzen 3000H series in late 2020, the company iterated quickly to release the GTR4 (Ryzen 4000H), GTR5 (Ryzen 5000H), and more recently, the GTR6 (Ryzen 6000HX) in November 2022. Now, the company has started to ship the GTR7 lineup based on the AMD Ryzen 7040HS Phoenix silicon. All the GTR systems came in a similar cuboidal form-factor. The company also created a lineup of Ryzen-based UCFF systems under the SER tag, but our focus in this piece is on the GTR line.
Beelink’s package components for the GTR7 7840HS include a VESA / wall mounting kit, user manual, a 120W (19V @ 6.32A) DC adapter, and two HDMI cables. The system is offered in a variety of colors, and our sample was dark green.
The mounting kit is not entirely VESA-compliant, but it can hang off two screws on the back of a VESA-compliant monitor (Beelink prefers to refer to it as a wall-mounting kit). The power adapter seems to be based on Gallium Nitride (GaN) technology, given its physical footprint and output wattage. It is nice to finally see mini-PC vendors realize the user-friendliness of compact power adapters. Short of accepting USB-C PD inputs, this is probably the best that can be done. While we received the EU version of the adapter in our review sample, we believe it is localized to the country of sale. The other end of the adapter is unfortunately a proprietary magnetic clamp that fastens firmly to the base of the main unit.
The main unit itself has a well-ventilated chassis. The perforations on the top allow the radiator fan placed to get rid of the heat from the vapor chamber to draw in cold air and direct it towards the heat dissipating radiator fins. The rear of the chassis has openings for the air exhaust through these fins, and the I/O ports are arranged below that.
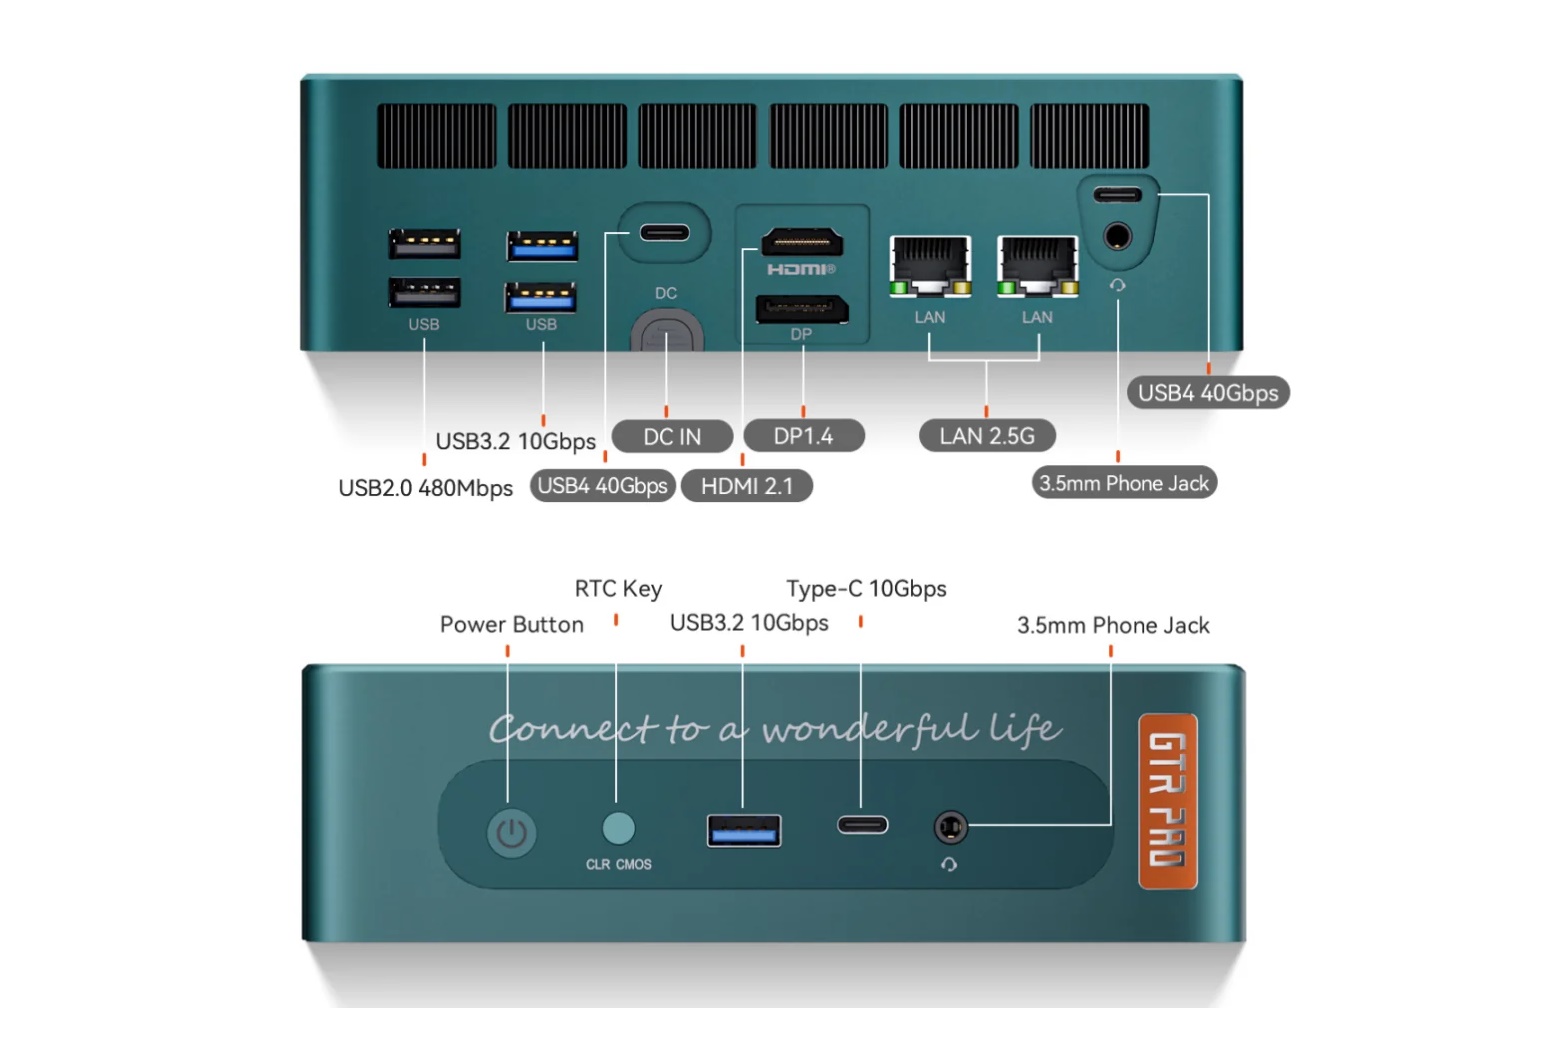
One of the interesting aspects of the I/O ports is the presence of an audio jack in both front and rear panels. Beelink has designed this in such a way that the connection of a headset of speakers to the rear jack automatically disables the front one. Both audio jacks are serviced by the same Realtek ALC897 audio codec.
The underside of the chassis is slightly raised and fastened to the main chassis with four screws. Our initial sample had a completely solid rectangular slab for this underside, but the company later sent out a replacement underside which included perforations directly under the fan placed in the internal shroud. A detailed description along with pictures is available in the section dealing with the thermals.
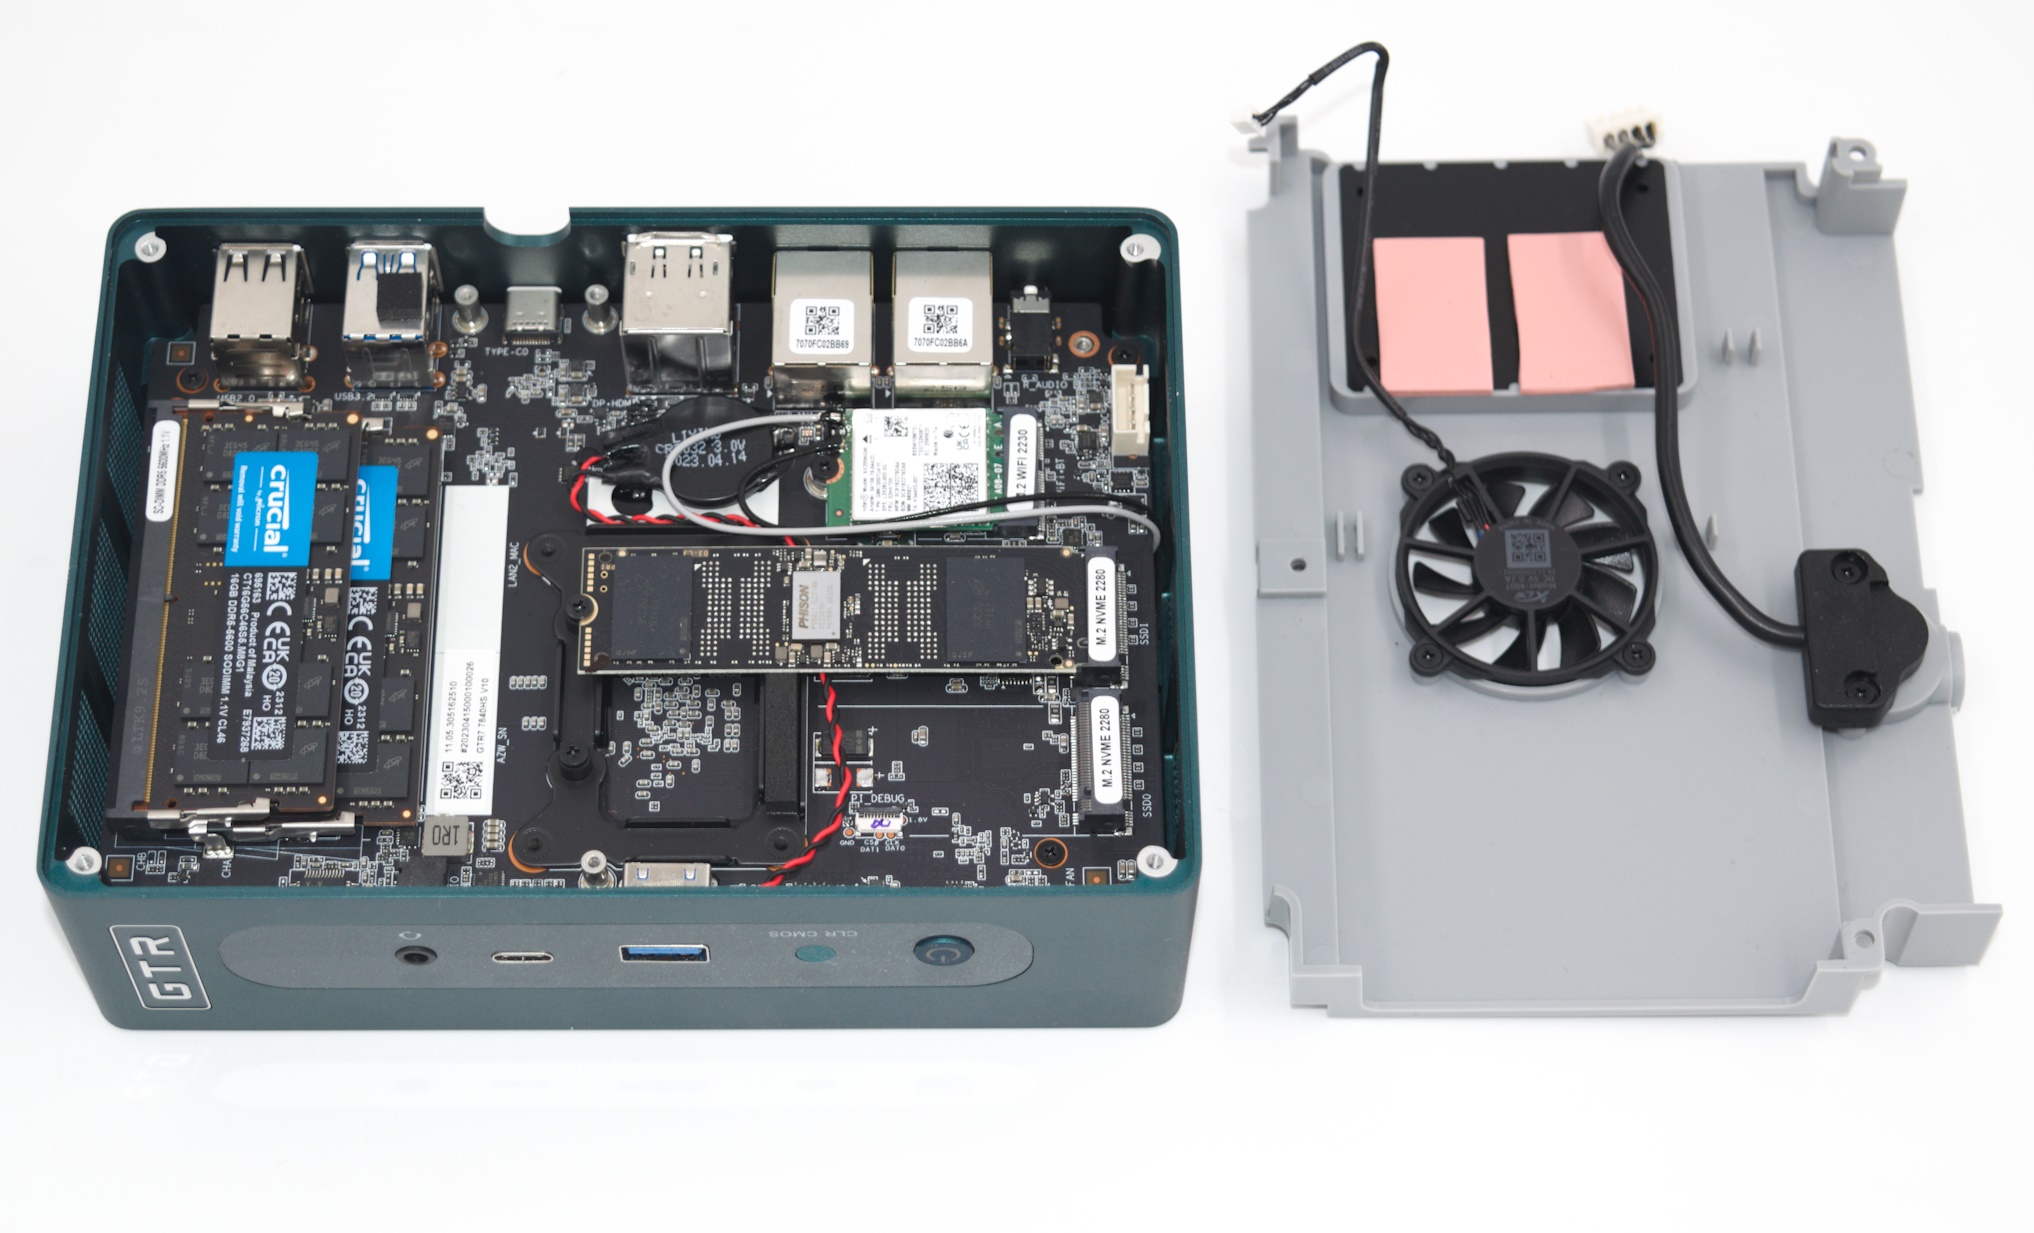
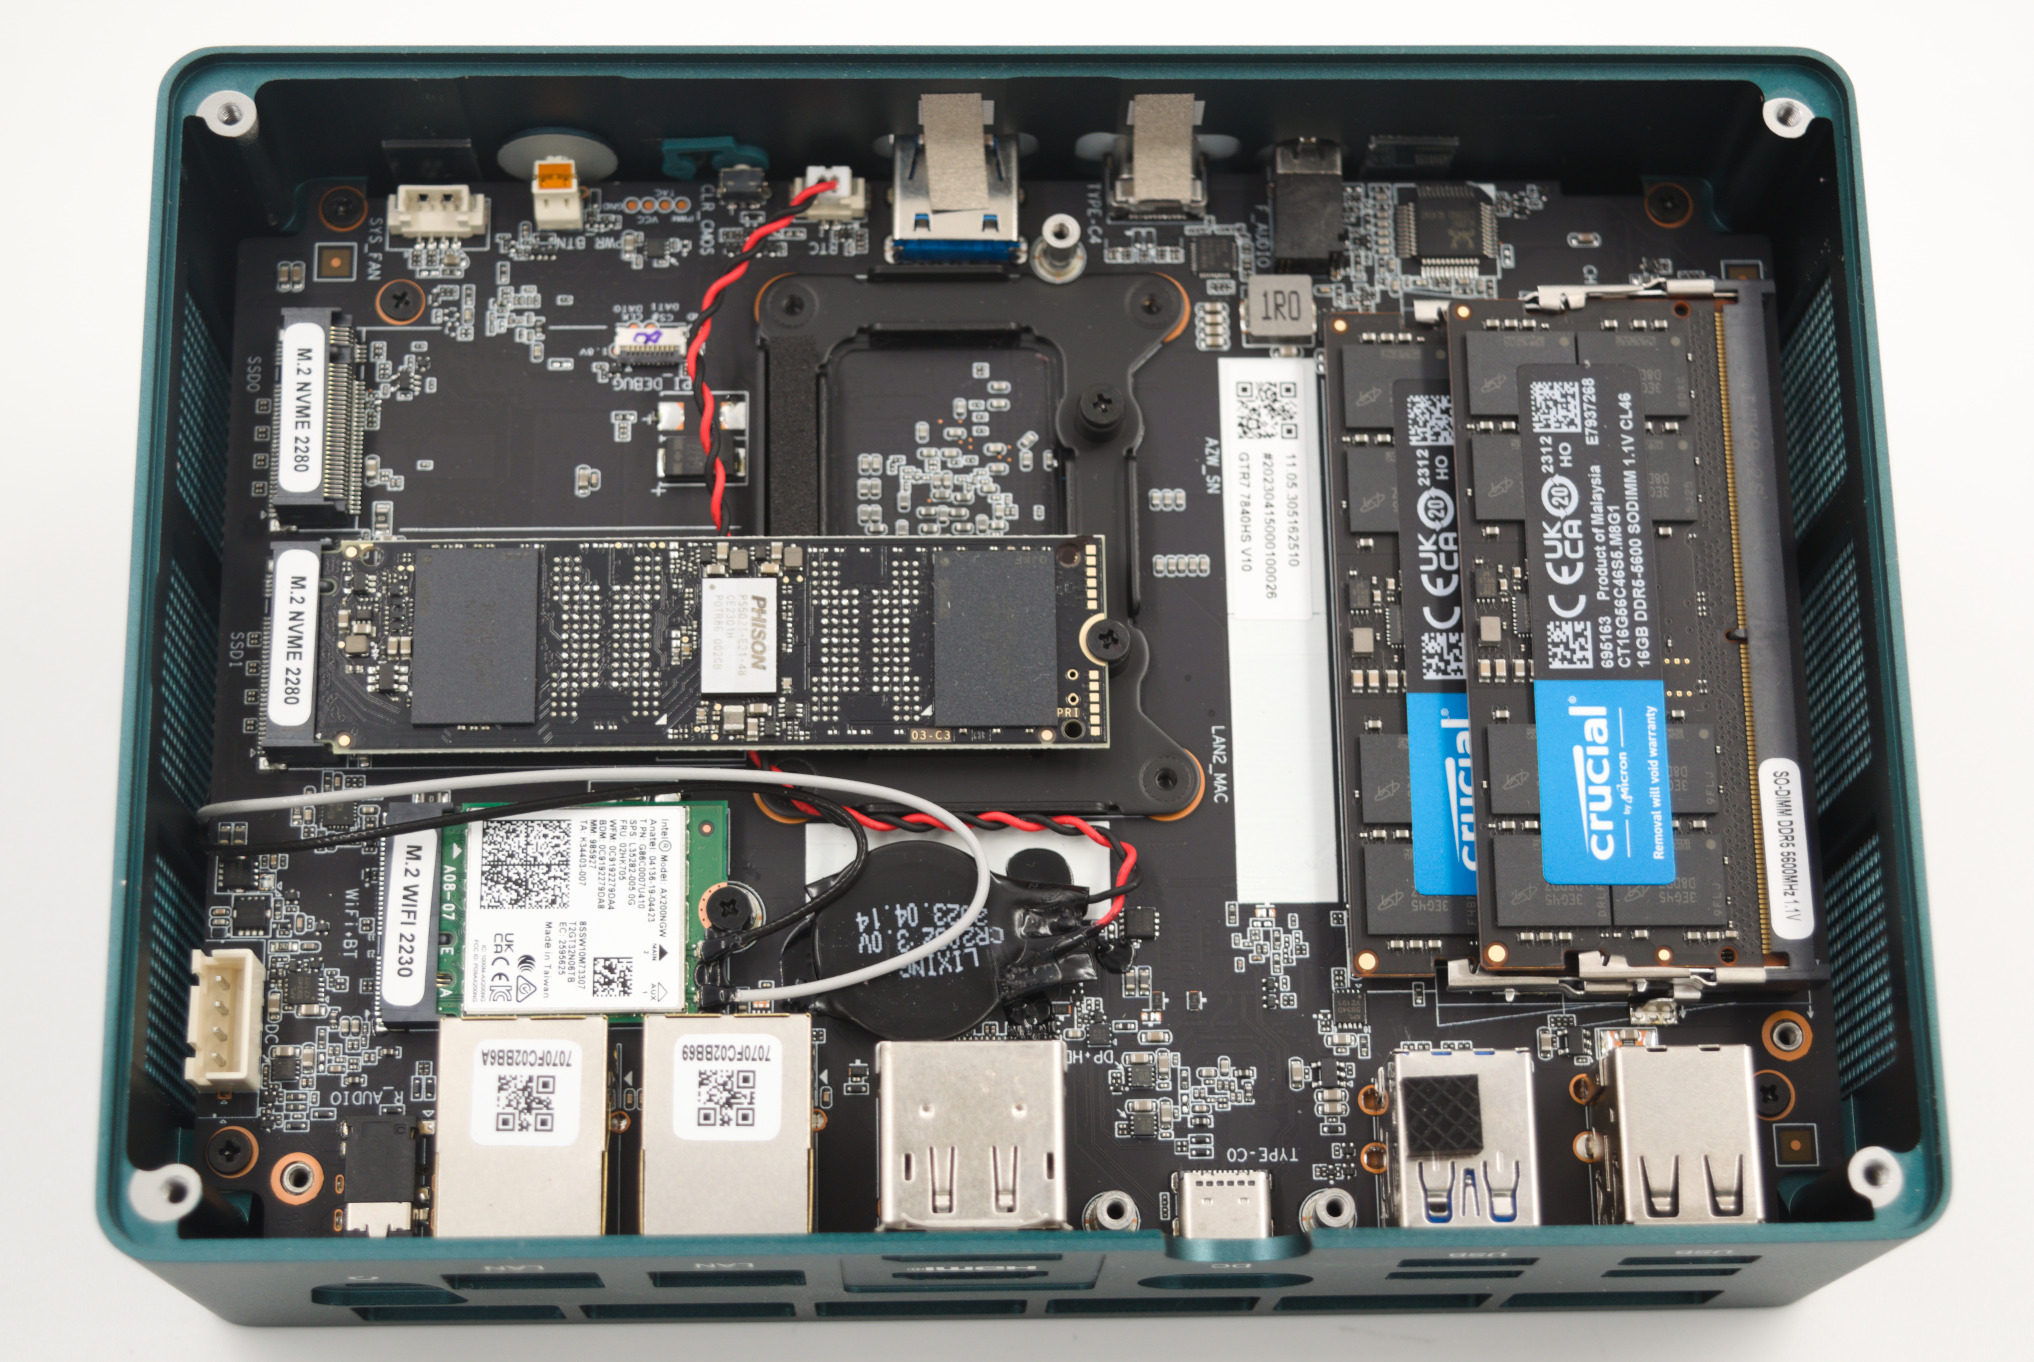
The shroud is fastened to the main board using three screws, and they need to be removed in order to access the two M.2 2280 SSD slots and the DDR5 SODIMM slots.
Beelink sells systems ready out-of-the-box, i.e, with RAM and SSD pre-installed, and loaded up with Windows 11 Professional. Our review sample was equipped with 2x Crucial CT16G56C46S5 DDR5-5600 SODIMMs and a Crucial P3 Plus Gen4 x4 M.2 2280 NVMe SSD. The full specifications of the review sample (as tested) are summarized in the table below. The Ryzen 7 7840HS has a configurable TDP (cTDP) ranging from 35W to 54W. As we shall see in our detailed investigation into the thermal characteristics in a later section, the high-end vapor chamber-based thermal solution allows the operation of the Phoenix SoC in a 65W cTDP mode.
| Beelink GTR7 Specifications (as tested) |
|
| Processor | AMD Ryzen 7 7840HS Zen 4 (Phoenix) 8C/16T, 3.8 – 5.1 GHz TSMC 4nm, 16MB L3, 35-54W Target TDP : 65W |
| Memory | Crucial CT16G56C46S5.M8G1 DDR5-5600 SODIMM 46-45-45-90 @ 5600 MHz 2×16 GB |
| Graphics | AMD Radeon 780M (RDNA3 / Phoenix) – Integrated (12 CUs @ 2.7 GHz) |
| Disk Drive(s) | Crucial P3 Plus CT1000P3PSSD8 (1 TB; M.2 2280 PCIe 4.0 x4 NVMe;) (Micron 176L 3D QLC (N48R); Phison E21T Controller) |
| Networking | 2x 2.5 GbE RJ-45 (Intel I225-V) Intel Wi-Fi 6 AX200 (2×2 802.11ax – 2.4 Gbps) |
| Audio | Realtek ALC897 (3.5mm Audio Jacks in Front and Rear) Digital Audio with bitstreaming support over HDMI, Display Port, and Type-C |
| Video | 1x HDMI 2.1 (4Kp120) 1x Display Port 2.1 (4Kp120) 2x Display Port 2.1 over USB4 Type-C (4Kp120) |
| Miscellaneous I/O Ports | 1x USB 3.2 Gen 2 Type-A (Front) 1x USB 3.2 Gen 2 Type-C (Front) 2x USB4 Type-C (Rear) 2x USB 3.2 Gen 2 Type-A (Rear) 2x USB 2.0 Type-A (Rear) |
| Operating System | Windows 11 Enterprise (22000.2245) |
| Pricing | (Street Pricing on Aug 19th, 2023) US $709 (as configured, with OS) |
| Full Specifications | Beelink GTR7 7840HS Specifications |
The next section details the the various BIOS options and follows it up with a detailed platform analysis.
Our review sample of the Beelink GTR7 7840HS came with all necessary components pre-installed – including the OS. Prior to setting up the OS on first boot, we took some time to look into the BIOS interface. While the interface is fairly basic (navigable only via keyboard), a lot of options are exposed for end users to play around with. The video below presents an overview of the BIOS interface.
The main screen provides a quick overview of the system configuration with the memory capacity and speed being the most important from a system configuration viewpoint. The BIOS version is also available in this screen. The system is equipped with both firmware and discrete TPMs, with the firmware TPM enabled by default. Various TPM aspects can be configured in the ‘Advanced > TPM/DTPM Computing’ sub-section. ACPI settings in the same section allows for configuration of hibernation and suspend states.
The UMA Frame buffer size (VRAM) is set to 4GB by default under ‘AMD CBS > NBIO Common Options > GFX Configuration’, but it can be as high as 16GB (with 32GB of DRAM installed). Other iGPU configurations such as GPU host cache settings can also be configured in this sub-section. Other northbridge options such as audio output paths and PCIe loopback mode can also be configured in this section. AMD CBS also allows configuration of behavior on AC power loss and restoration, and various system management unit options such as thermal and power parameters (sustained power limit, package power tracking, skin-temperature aware power management, etc.). Beelink sets all power numbers under SmartShift control to 65000 (mW) by default. The other configuration sub-sections under AMD CBS also allows control over aspects like CPU virtualization support, resizable BAR, SR-IOV, and PCIe hot-plug support, USB hardware parameters like timeouts, NVMe device tests, UEFI network stack configuration for the I225-V LAN controllers, etc.
USB ports can be selectively locked from ‘Chipset > South Bridge > SB USB Configuration’. The ‘North Bridge’ subsection is informative in nature and provides the size and speed of the memory modules attached. The BIOS password and secure boot state can be modified in the ‘Security’ section. This section also includes the TCG Pyrite 2.0 configuration for the NVMe SSD (if it is supported by the installed drive). The ‘Boot’ section allows configuration of the NumLock state during the boot process, and the fast boot setting. The boot order for various boot devices can also be set up. The ‘Save & Exit’ section allows users to either save and reset, or reset without saving, override all settings with the factory defaults, or save a particular configuration as user defaults. Most importantly, it also includes a boot override that allows the selection of a particular boot device for the next boot alone.
The block diagram below presents the overall high-speed I/O distribution.
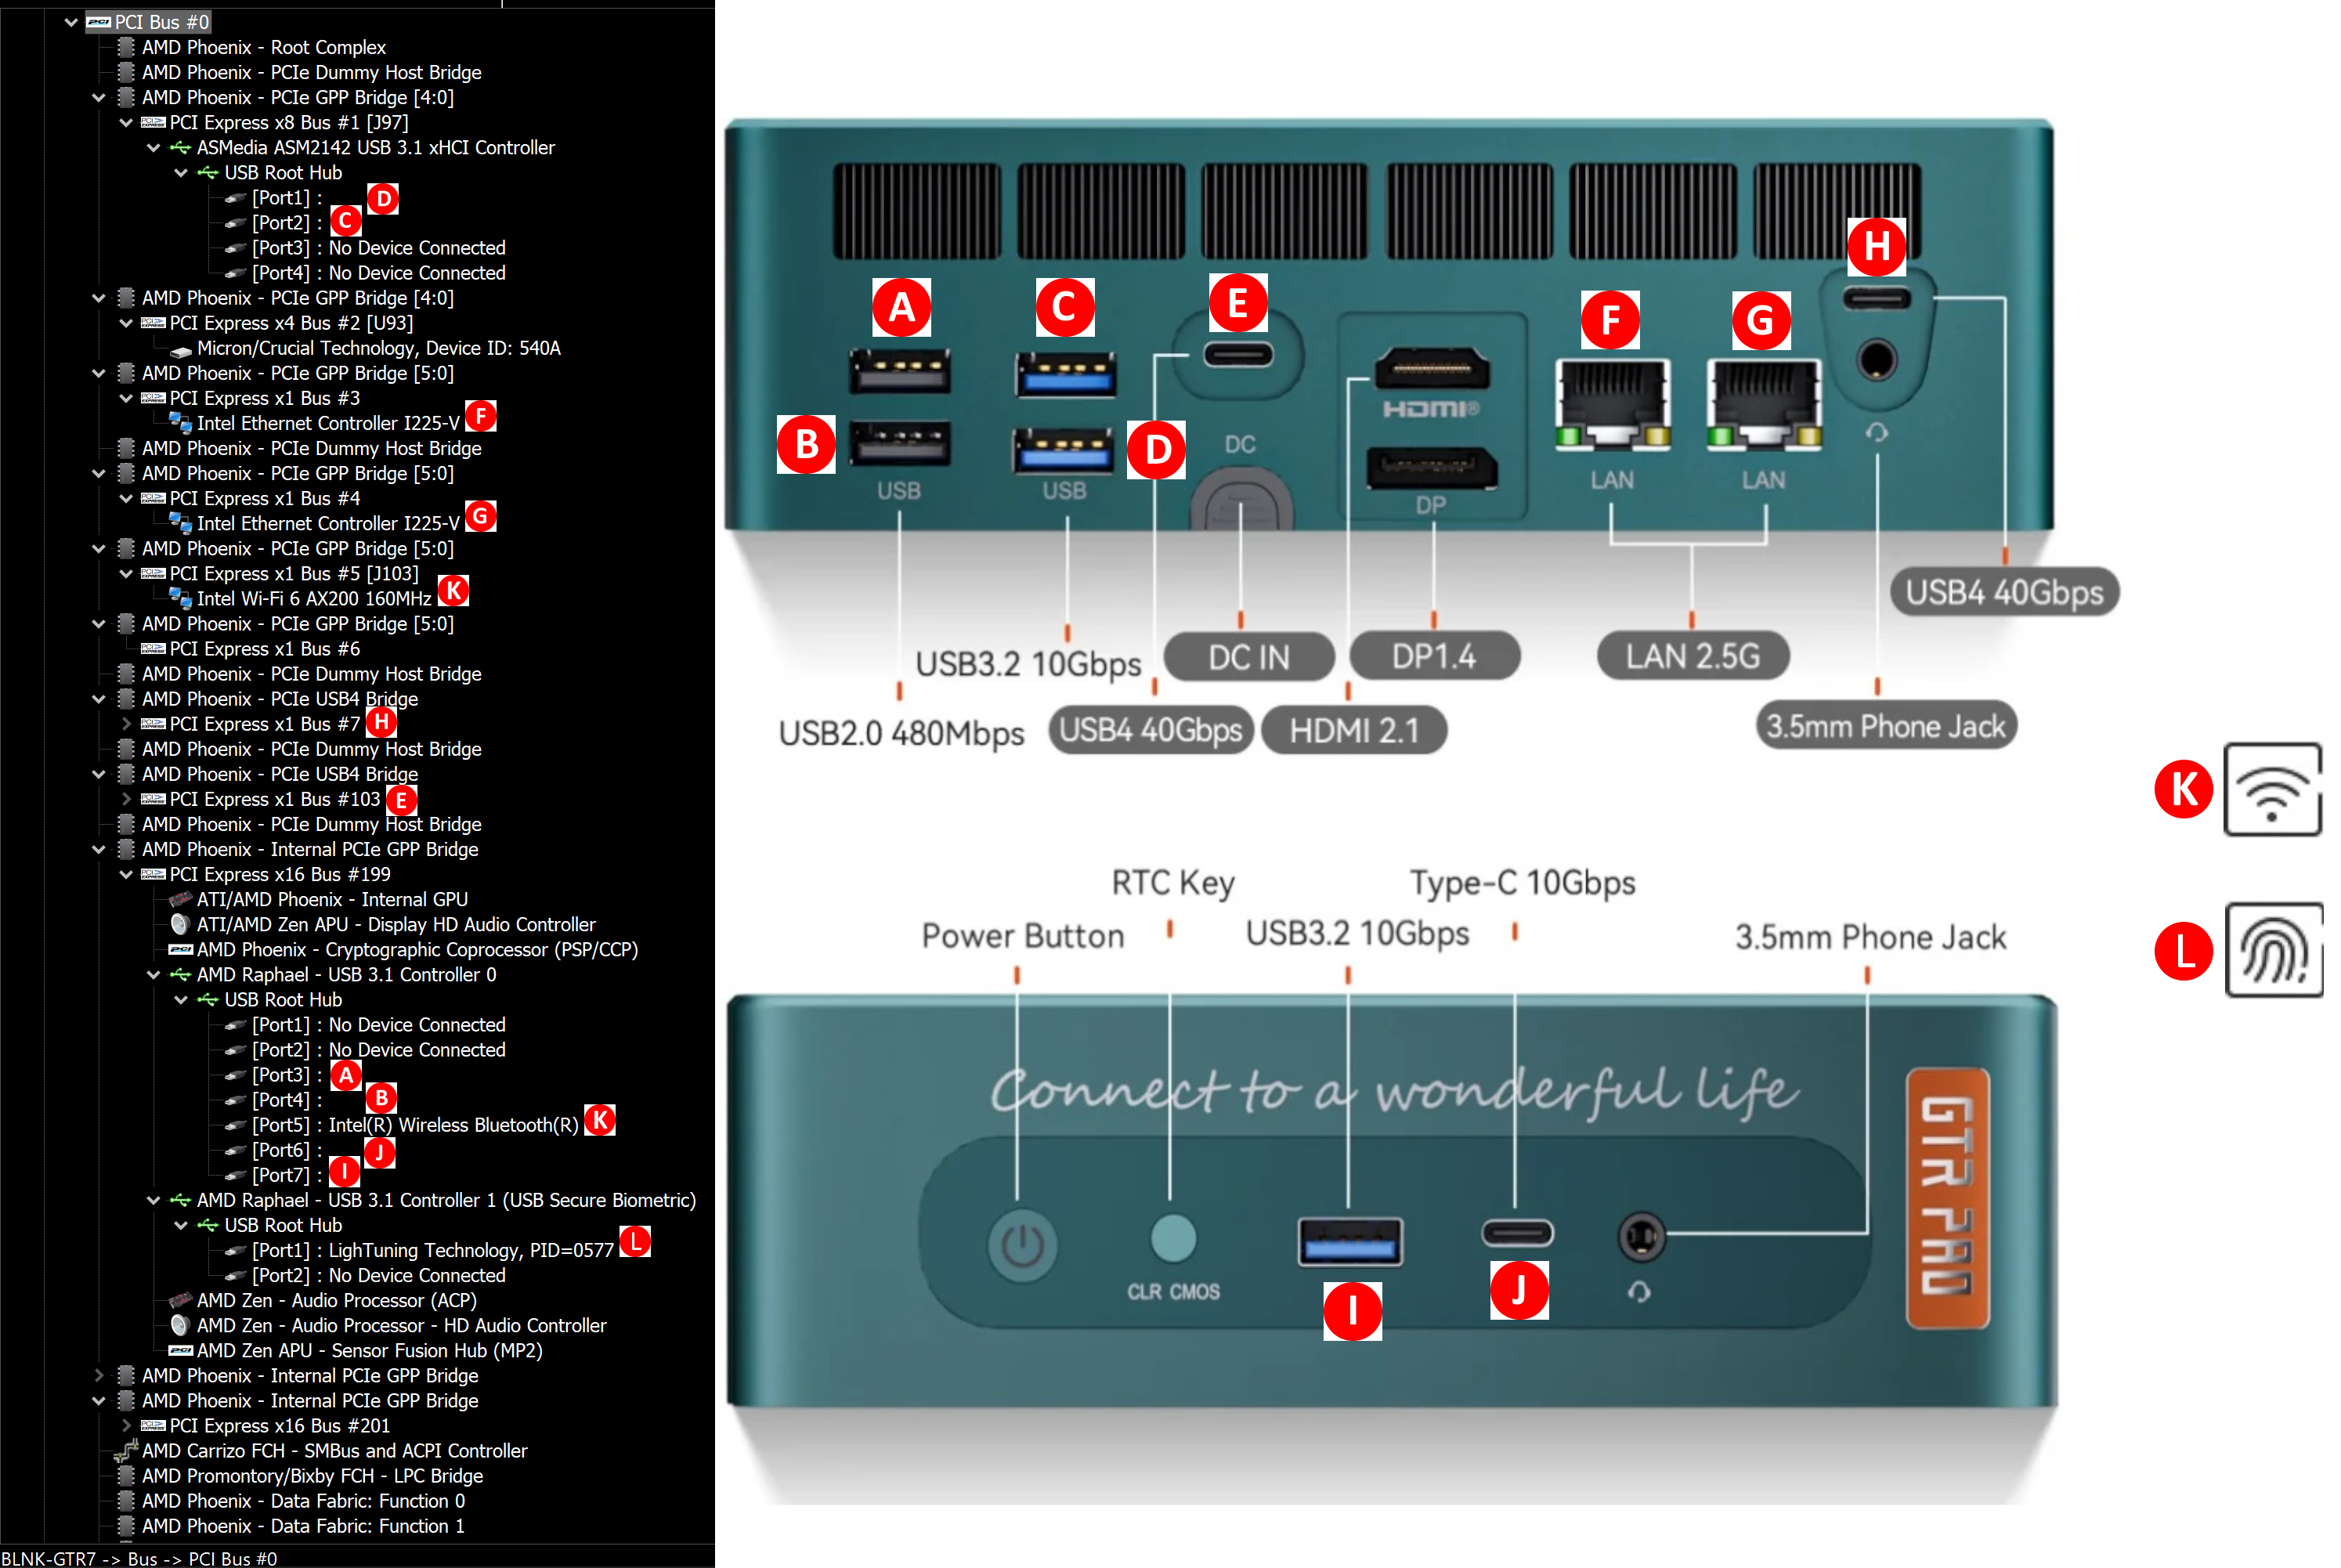
Except for the two rear USB 3.2 Gen 2 (10 Gbps) Type-A ports enabled by an ASMedia ASM3142 controller chip (detected as ASM2142 in the kernel), all the other USB ports (including the two USB4 ports denoted as PCIe USB4 Bridge in the diagram above) are natively from the controller hub on the Phoenix die. There are twenty usable PCIe Gen4 lanes, and the break-up is as below:
- PCIe 3.0 x2: ASMedia ASM3142
- PCIe 4.0 x4: M.2 2280 SSD Slot #0
- PCIe 4.0 x4: M.2 2280 SSD Slot #1
- PCIe 2.0 x1: Intel I225-V #0
- PCIe 2.0 x1: Intel I225-V #1
- PCIe 2.0 x1: Intel AX200 Wi-Fi 6
While the USB4 ports support PCIe tunneling with full Thunderbolt 3 compatibility (including external GPU enclosures), they do not have support for USB 3.2 Gen 2×2 (20 Gbps) clients. Those operate at 10 Gbps speeds in both USB4 ports of the GTR7 7840HS.
In today’s review, we compare the Beelink GTR7 against a host of other systems configured with similarly high TDPs. Since the GTR7 claims to operate at 65W, we also included the ASRock DeskMeet B660 in the mix – even though it is configured with a 65W budget for the CPU alone, and the discrete GPU having its own envelop.
| Comparative PC Configurations | ||
| Aspect | Beelink GTR7 | |
| CPU | AMD Ryzen 7 7840HS Zen 4 (Phoenix) 8C/16T, 3.8 – 5.1 GHz TSMC 4nm, 16MB L3, 35-54W Target TDP : 65W |
AMD Ryzen 7 7840HS Zen 4 (Phoenix) 8C/16T, 3.8 – 5.1 GHz TSMC 4nm, 16MB L3, 35-54W Target TDP : 65W |
| GPU | AMD Radeon 780M (RDNA3 / Phoenix) – Integrated (12 CUs @ 2.7 GHz) |
AMD Radeon 780M (RDNA3 / Phoenix) – Integrated (12 CUs @ 2.7 GHz) |
| RAM | Crucial CT16G56C46S5.M8G1 DDR5-5600 SODIMM 46-45-45-90 @ 5600 MHz 2×16 GB |
Crucial CT16G56C46S5.M8G1 DDR5-5600 SODIMM 46-45-45-90 @ 5600 MHz 2×16 GB |
| Storage | Crucial P3 Plus CT1000P3PSSD8 (1 TB; M.2 2280 PCIe 4.0 x4 NVMe;) (Micron 176L 3D QLC (N48R); Phison E21T Controller) |
Crucial P3 Plus CT1000P3PSSD8 (1 TB; M.2 2280 PCIe 4.0 x4 NVMe;) (Micron 176L 3D QLC (N48R); Phison E21T Controller) |
| Wi-Fi | 2x 2.5 GbE RJ-45 (Intel I225-V) Intel Wi-Fi 6 AX200 (2×2 802.11ax – 2.4 Gbps) |
2x 2.5 GbE RJ-45 (Intel I225-V) Intel Wi-Fi 6 AX200 (2×2 802.11ax – 2.4 Gbps) |
| Price (in USD, when built) | (Street Pricing on Aug 19th, 2023) US $709 (as configured, with OS) |
(Street Pricing on Aug 19th, 2023) US $709 (as configured, with OS) |
Benchmarks were processed afresh on all of the above systems with the latest BIOS for each. The next few sections will deal with comparative benchmarks for the above systems.
Our 2022 Q4 update to the test suite for Windows 11-based systems carries over some of the standard benchmarks we have been using over the last several years. While UL’s PCMark makes the list, we have opted to temporarily suspend reporting of BAPCo’s SYSmark scores (pending fixture of the energy consumption aspect). Instead, BAPCO’s CrossMark multi-platform benchmarking tool has been added to the set along with UL’s Procyon suite. While CrossMark employs idle time compression and processes all workloads in an opaque manner, UL’s Procyon processes real-world workloads with user interactions (like BAPCo’s SYSmark). We have augmented the UL Procyon suite benchmark with our own custom energy measurement setup.
UL PCMark 10
UL’s PCMark 10 evaluates computing systems for various usage scenarios (generic / essential tasks such as web browsing and starting up applications, productivity tasks such as editing spreadsheets and documents, gaming, and digital content creation). We benchmarked select PCs with the PCMark 10 Extended profile and recorded the scores for various scenarios. These scores are heavily influenced by the CPU and GPU in the system, though the RAM and storage device also play a part. The power plan was set to Balanced for all the PCs while processing the PCMark 10 benchmark. The scores for each contributing component / use-case environment are also graphed below.
| UL PCMark 10 – Performance Scores | |||

Discounting the DeskMeet B660, the GTR7 outscores the competition on the back of its lead in the productivity, gaming, and digital content creation workloads. The Essentials workload sees the Arena Canyon NUC enjoy a slight edge, but the sustained 65W configuration of the Ryzen 7 7840HS possesses way too much horsepower for the rest of the systems to match.
UL Procyon v2.1.544
PCMark 10 utilizes open-source software such as Libre Office and GIMP to evaluate system performance. However, many of their professional benchmark customers have been requesting evaluation with commonly-used commercial software such as Microsoft Office and Adobe applications. In order to serve their needs, UL introduced the Procyon benchmark in late 2020. There are five benchmark categories currently – Office Productivity, AI Inference, Battery Life, Photo Editing, and Video Editing. AI Inference benchmarks are available only for Android devices, while the battery life benchmark is applicable to Windows devices such as notebooks and tablets. We presents results from our processing of the other three benchmarks.
| UL Procyon – Office Productivity Scores | |||

The GTR7 manages a narrow victory in the Powerpoint workload, but the NUCs based on the Core i7-1360P emerge with slightly better overall scores.

From an energy consumption viewpoint, the 4nm fabrication process for the Ryzen 7840HS seems to help the GTR7. While raw performance scores see it slightly behind the Raptor Lake-based systems, the absolute values are fairly similar. However, the GTR7 gets the job done with minimal power consumption, and as a result, lesser overall energy consumption.
Moving on to the evaluation of Adobe Photoshop and Adobe Lightroom, we find the GTR7 coming out with a slightly better score compared to the systems using the Core i7-1360P. The flow utilizes some of the iGPU functionality, and the improvements in the Radeon 780M show up here along with the higher sustained power budget. Interestingly, the photo editing workload was the one that refused to complete with GPU drivers supplied initially by Beelink, but AMD’s first public driver release for Phoenix resolved the issue.
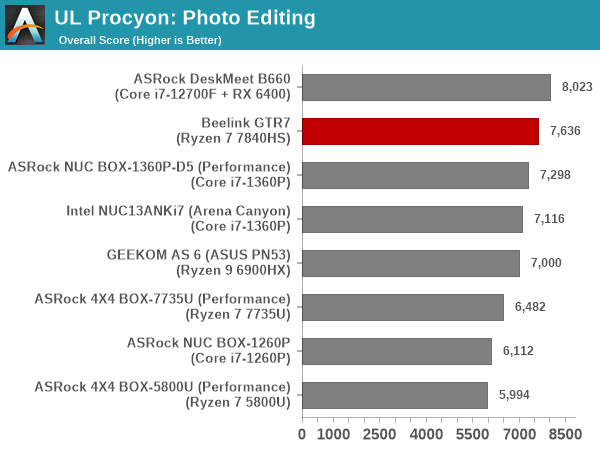
The energy efficiency of the Phoenix SoC again comes to fore here, with the GTR7 being the most energy efficient by a huge margin.

UL Procyon evaluates performance for video editing using Adobe Premier Pro.
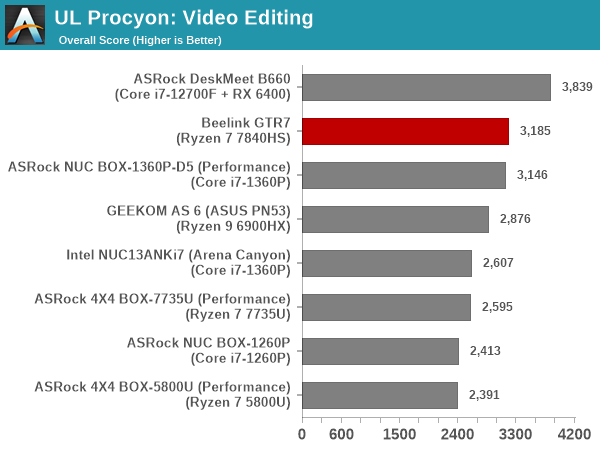
The GTR7 emerges as the best system among those not equipped with a discrete GPU. Its performance is within the realms of run-to-run variations with the souped up Core i7-1360P in ASRock Industrial’s NUC BOX-1360P/D5.
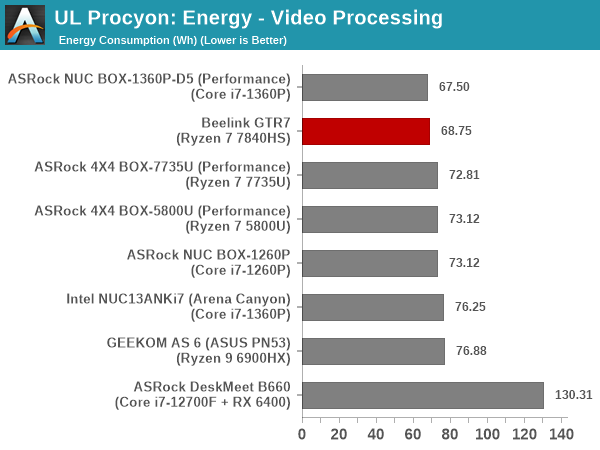
On the energy front, the ability to get the job done fast helps in placing the GTR7 in the top half of the pack. The system comes second, falling slightly behind the ASRock Industrial NUC BOX-1360P/D5 with its CPU operating mode set to ‘Performance’ in the BIOS. However, similar to the raw performance scores, the gap is quite small.
BAPCo CrossMark 1.0.1.86
BAPCo’s CrossMark aims to simplify benchmark processing while still delivering scores that roughly tally with SYSmark. The main advantage is the cross-platform nature of the tool – allowing it to be run on smartphones and tablets as well.
| BAPCo CrossMark 1.0.1.86 – Sub-Category Scores | |||

The use of idle time compression favors Intel-based systems, but that is not indicative of real-world performance. Based on these results, it would appear that scripting and automating workloads to keep the system busy all the time would probably be better on the Intel-based PCs. It is also possible that there could be BIOS tweaks and further tuning from Beelink to help the GTR7 perform better under such circumstances. Since CrossMark attempts to consolidate different workloads together without idle time intervals and play it back in a non-real-time environment, it is not entirely representative of real-world performance like PCMark 10 and UL Procyon. Therefore, tasks requiring frequent user interaction are better represented by those other benchmarks.
Standardized benchmarks such as UL’s PCMark 10 and BAPCo’s SYSmark take a holistic view of the system and process a wide range of workloads to arrive at a single score. Some systems are required to excel at specific tasks – so it is often helpful to see how a computer performs in specific scenarios such as rendering, transcoding, JavaScript execution (web browsing), etc. This section presents focused benchmark numbers for specific application scenarios.
3D Rendering – CINEBENCH R23
We use CINEBENCH R23 for 3D rendering evaluation. R23 provides two benchmark modes – single threaded and multi-threaded. Evaluation of different PC configurations in both supported modes provided us the following results.
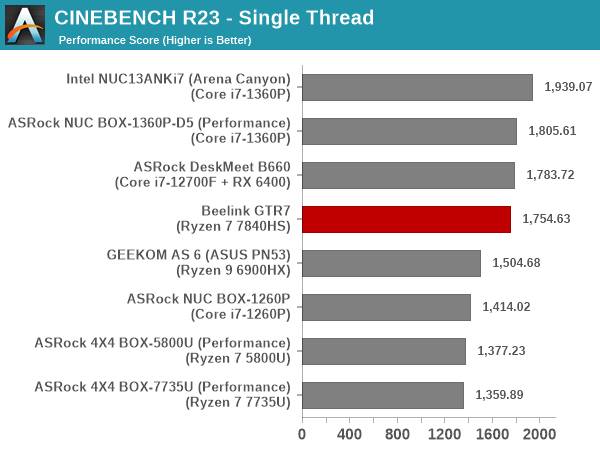
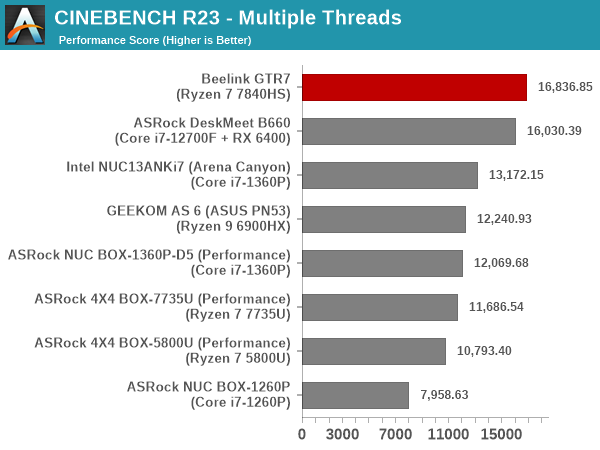
The performance in the multi-threaded case is a slam dunk for the GTR7. We see a significant improvement in the single thread scores over the Rembrandt-R systems, thanks to the higher power budget and newer microarchitecture (as well as faster RAM). However, the Raptor Lake-P NUCs seem to come away with the bragging rights for the single-threaded benchmark version.
Transcoding: Handbrake 1.5.1
Handbrake is one of the most user-friendly open source transcoding front-ends in the market. It allows users to opt for either software-based higher quality processing or hardware-based fast processing in their transcoding jobs. Our new test suite uses the ‘Tears of Steel’ 4K AVC video as input and transcodes it with a quality setting of 19 to create a 720p AVC stream and a 1080p HEVC stream.
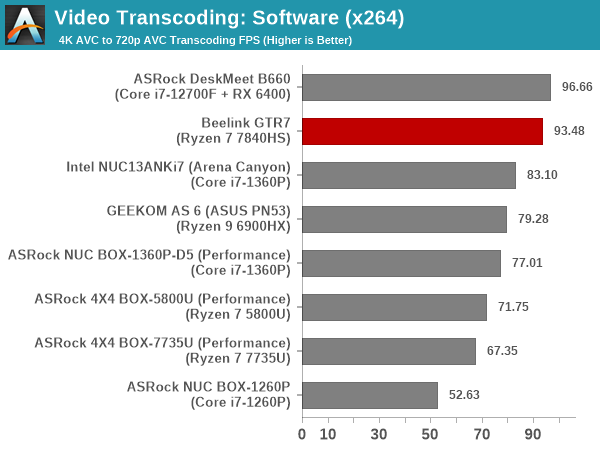
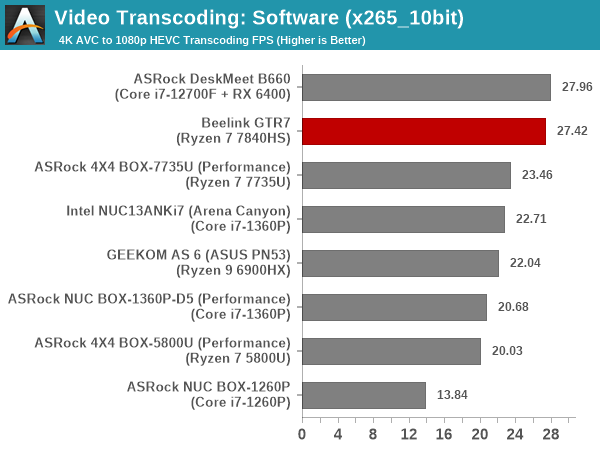
The presence of eight high-performance cores in the GTR7 gives it a very good advantage for this multi-threaded benchmark. Higher power budget translates to higher performance given that most of the systems have the same core counts. The GTR7 has a well-defined lead over other UCFF systems, and is neck-to-neck against the Alder Lake SFF PC with a dedicated 65W budget for the CPU alone.
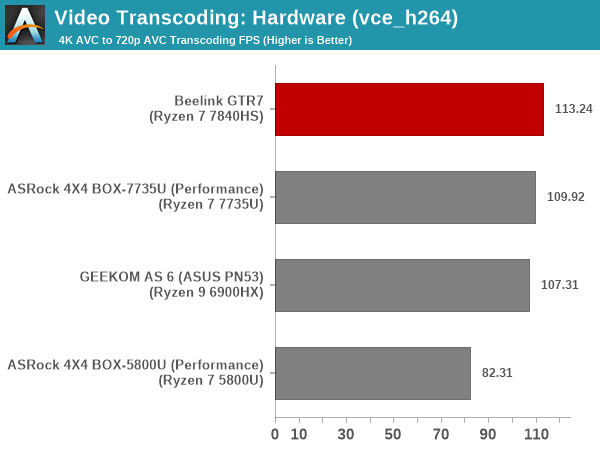
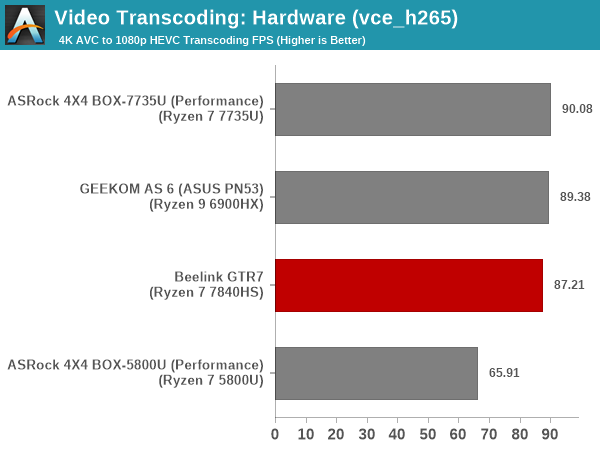
Hardware transcoding is available in the form of the VCE feature in the GPU. Intel systems have QuickSync, but a direct comparison is not advisable given that the encoding quality may differ. So, the comparison in the above graphs is restricted to AMD systems. The FPS is a function of the GPU clock rate and is directly tied to the available power budget. However, we do not find much difference in the transcoding rates between the Rembrandt-R and Phoenix systems.
Archiving: 7-Zip 21.7
The 7-Zip benchmark is carried over from our previous test suite with an update to the latest version of the open source compression / decompression software.
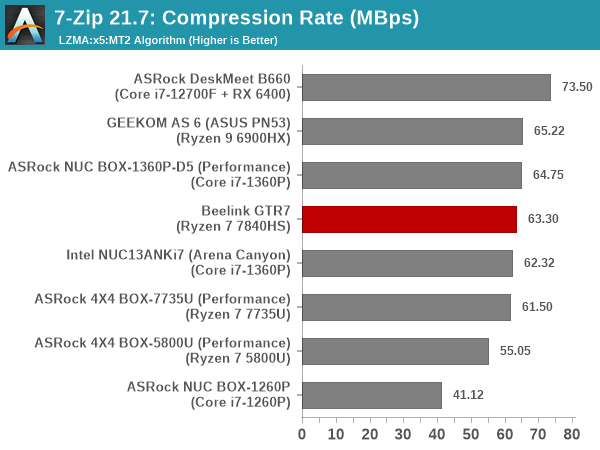
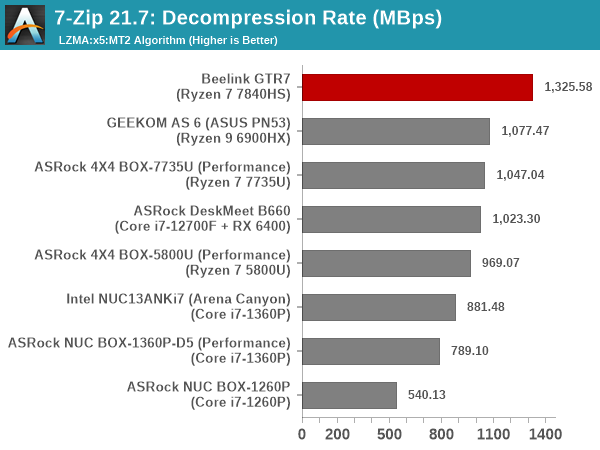
While there is not much separating the different UCFF systems in terms of compression rates, decompression is a completely different story with the 65W Phoenix system enjoying close to a 25% advantage over the 35W Rembrandt-R systems.
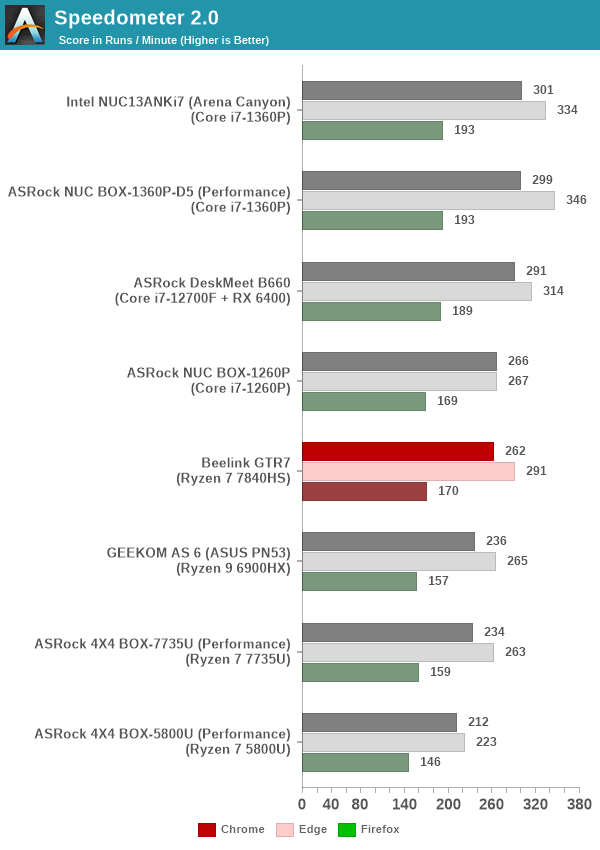
Web Browsing: JetStream, Speedometer, and Principled Technologies WebXPRT4
Web browser-based workloads have emerged as a major component of the typical home and business PC usage scenarios. For headless systems, many applications based on JavaScript are becoming relevant too. In order to evaluate systems for their JavaScript execution efficiency, we are carrying over the browser-focused benchmarks from the WebKit developers used in our notebook reviews. Hosted at BrowserBench, JetStream 2.0 benchmarks JavaScript and WebAssembly performance, while Speedometer measures web application responsiveness.
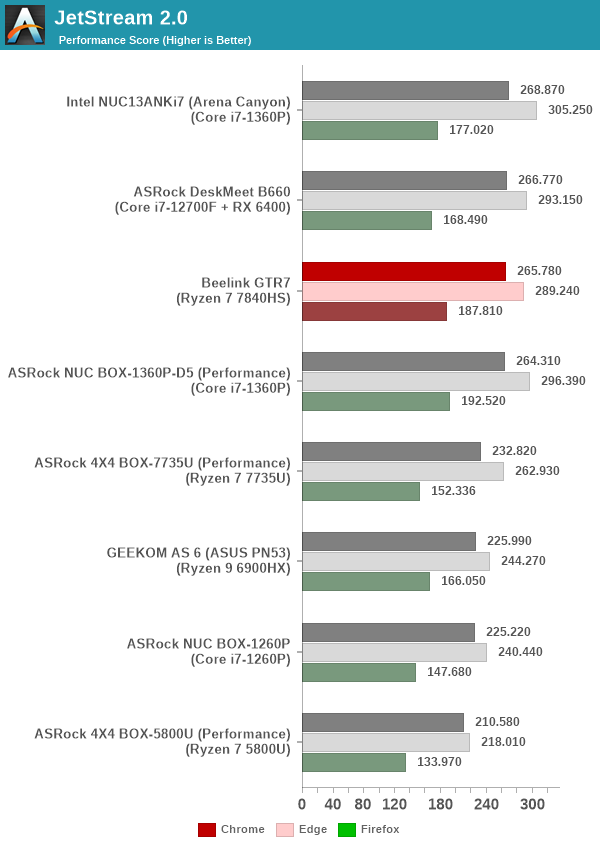
Raptor Lake-P seems to enjoy a slight advantage in single-threaded performance, and that gives the NUCs based on them an edge across all considered browsers in the JetStream 2.0 workload. The GTR7 slots in the upper half of the pack, with an improvement over the 35W Rembrandt-R systems. The same behavior is seen in the Speedometer 2.0 benchmark also.
From a real-life workload perspective, we also process WebXPRT4 from Principled Technologies. WebXPRT4 benchmarks the performance of some popular JavaScript libraries that are widely used in websites.
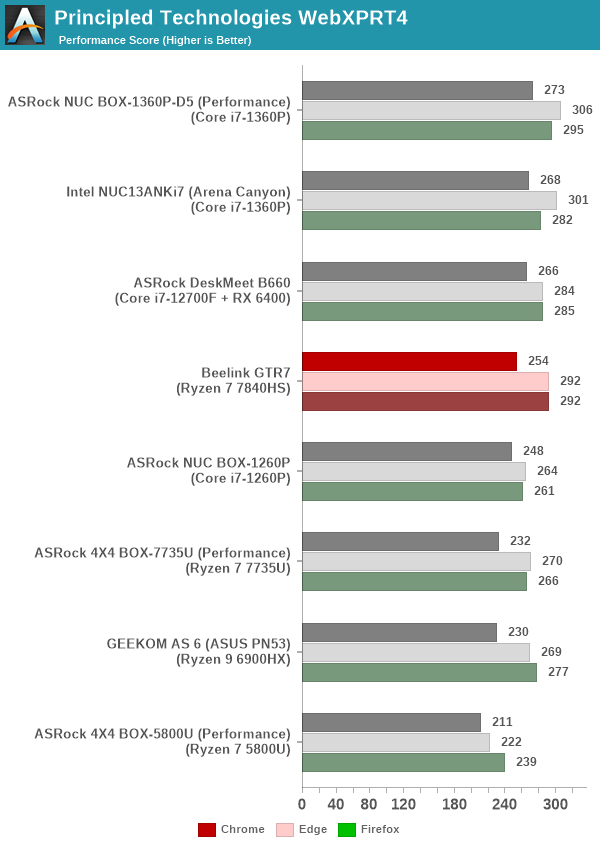
The GTR7 performs much better in this case, almost tying the ASRock Industrial NUC BOX-1360P/D5 in performance across multiple browsers. The higher power budget gives the GTR7 an edge over the considered Rembrandt-R systems. Overall, JavaScript performance seems to be primarily impacted by single-threaded performance.
Application Startup: GIMP 2.10.30
A new addition to our systems test suite is AppTimer – a benchmark that loads up a program and determines how long it takes for it to accept user inputs. We use GIMP 2.10.30 with a 50MB multi-layered xcf file as input. What we test here is the first run as well as the cached run – normally on the first time a user loads the GIMP package from a fresh install, the system has to configure a few dozen files that remain optimized on subsequent opening. For our test we delete those configured optimized files in order to force a ???fresh load??? every second time the software is run.
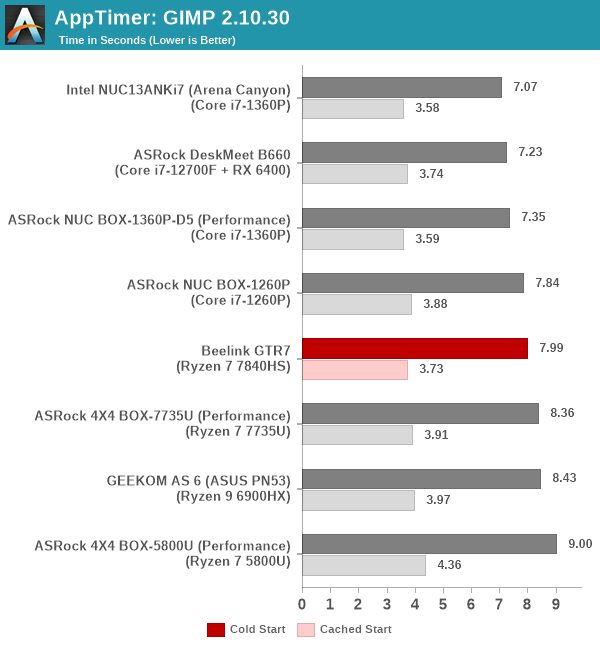
As it turns out, GIMP does optimizations for every CPU thread in the system, which requires that higher thread-count processors take a lot longer to run. So the test runs quick on systems with fewer threads, however fast cores are also needed. While the GTR7 is better than the Rembrandt-R systems on both counts, the Intel-based NUCs turn up with faster application launches under the considered conditions.
Cryptography Benchmarks
Cryptography has become an indispensable part of our interaction with computing systems. Almost all modern systems have some sort of hardware-acceleration for making cryptographic operations faster and more power efficient. In the case of IoT servers, many applications – including web server functionality and VPN – need cryptography acceleration.
BitLocker is a Windows features that encrypts entire disk volumes. While drives that offer encryption capabilities are dealt with using that feature, most legacy systems and external drives have to use the host system implementation. Windows has no direct benchmark for BitLocker. However, we cooked up a BitLocker operation sequence to determine the adeptness of the system at handling BitLocker operations. We start off with a 4.5GB RAM drive in which a 4GB VHD (virtual hard disk) is created. This VHD is then mounted, and BitLocker is enabled on the volume. Once the BitLocker encryption process gets done, BitLocker is disabled. This triggers a decryption process. The times taken to complete the encryption and decryption are recorded. This process is repeated 25 times, and the average of the last 20 iterations is graphed below.
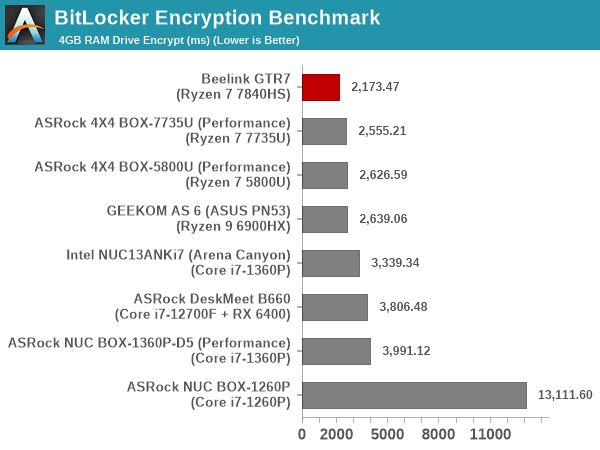
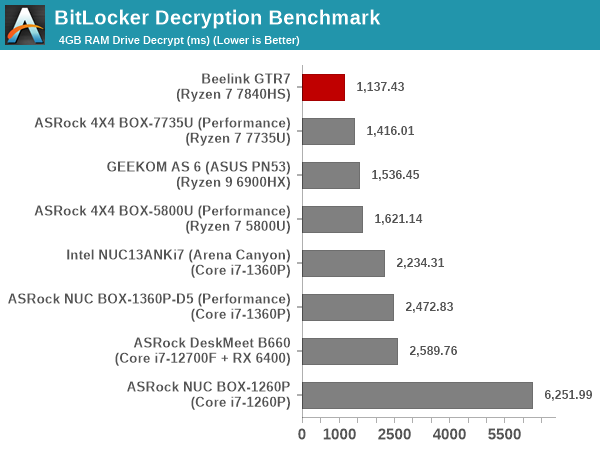
Hardware acceleration is available for the operations in all of the systems. The time taken for processing is directly dependent on the RAM speeds, available power budget, and core counts. As a result, it is no surprise that the GTR7 with DDR5-5600 RAM, 65W budget and eight high-performance cores manages to take the top spot by a comfortable margin.
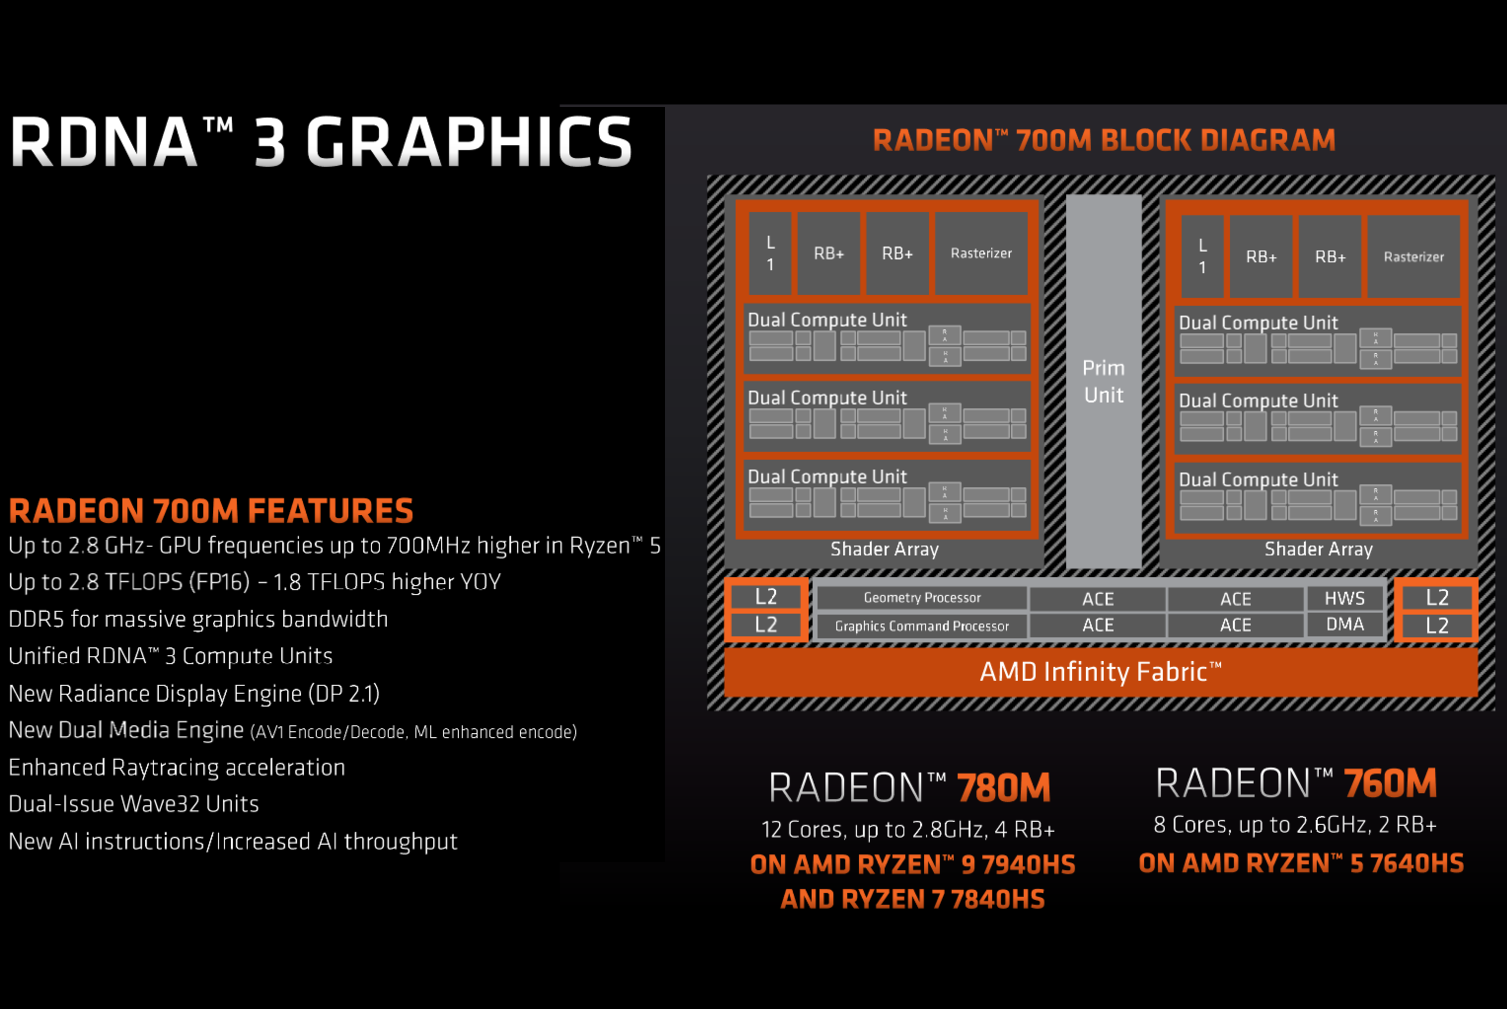
AMD’s Phoenix SoCs include an integrated GPU with a microarchitectural update over the one in the Rembrandt-R SoCs. The new RDNA3 microarchitecture is present in the Ryzen 7 7840HS in the form of the Radeon 780M. With 12 CUs and 768 shader units clocked at 2.7 GHz, AMD claims that the GPU should be capable of playing virtually any modern game at Full HD resolutions.
For full-blown desktop systems or mini-PCs targeting the gaming market, we look at gaming workloads. However, for general-purpose mini-PC models like the GEEKOM AS 6, we restrict ourselves to a series of canned benchmarks from Kishonti and Futuremark / UL. Prior to that, a look at the capabilities of the GPU via GPU-Z is warranted.
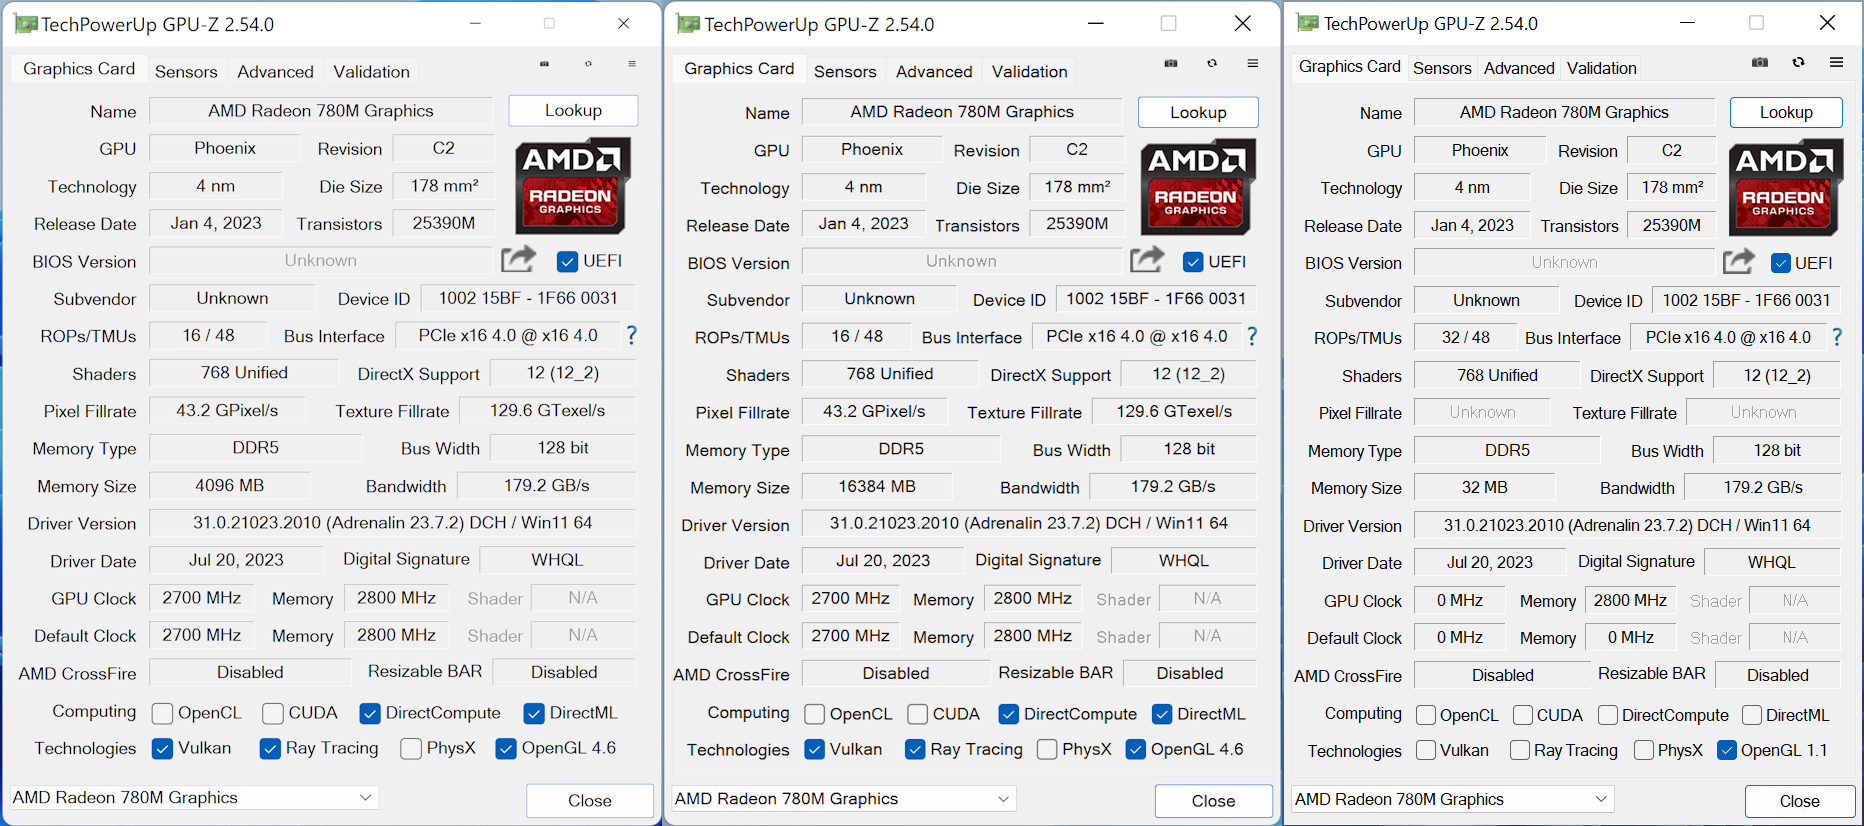
(From L to R: Default BIOS Settings, UMA Buffer Size set to 16G, UMA Buffer Size set to Auto)
Rembrandt-R’s Radeon 680M had already achieved an industry-first by integrating hardware-accelerated ray tracing, and the Radeon 780M in Phoenix builds upon that. There are some improvements in the media engine too (such as AV1 encode support), but those are not revealed in the GPU-Z screenshot. The remaining subsections below look into the performance aspects.
GFXBench
The DirectX 12-based GFXBench tests from Kishonti are cross-platform, and available all the way down to smartphones. As such, they are not very taxing for discrete GPUs and modern integrated GPUs. We processed the offscreen versions of the ‘Aztec Ruins’ benchmark.
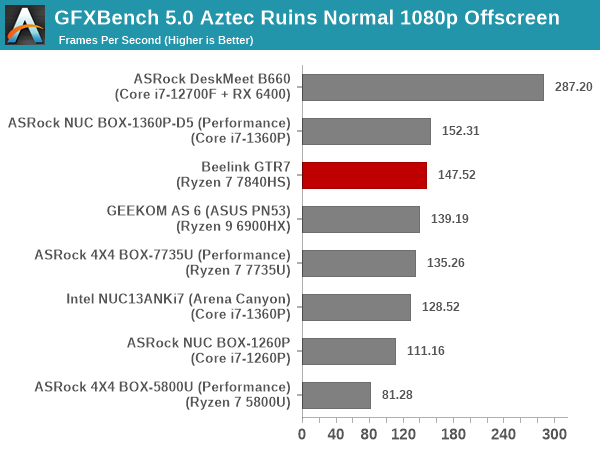
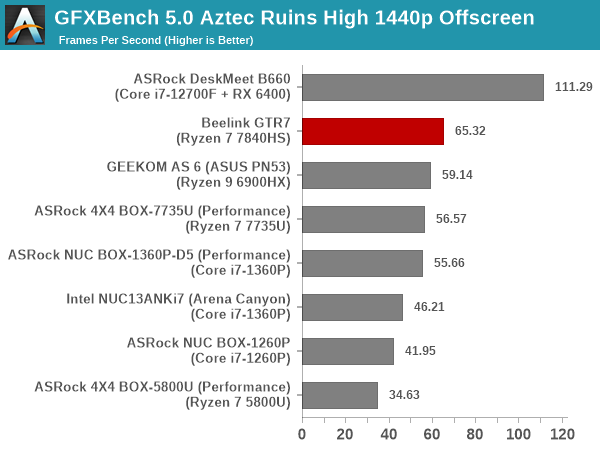
At 1080p, the souped-up ASRock Industrial Raptor Lake-P NUC has a slight edge of around 3% in the frame rate, but the AMD-based systems take back the crown at 1440p. The GTR7 has a 7% edge over the GEEKOM AS 6, which by itself has a 6% edge over the top RPL-P system.
UL 3DMark
Four different workload sets were processed in 3DMark – Fire Strike, Time Spy, Night Raid, and Wild Life.
3DMark Fire Strike
The Fire Strike benchmark has three workloads. The base version is meant for high-performance gaming PCs. It uses DirectX 11 (feature level 11) to render frames at 1920 x 1080. The Extreme version targets 1440p gaming requirements, while the Ultra version targets 4K gaming system, and renders at 3840 x 2160. The graph below presents the overall score for the Fire Strike Extreme and Fire Strike Ultra benchmark across all the systems that are being compared.
| UL 3DMark – Fire Strike Workloads | |||

Rembrandt-R already had an edge over RPL-P in these workloads, and Phoenix only cements this position further. The GTR7 shows a 25 – 30% improvement over the GEEKOM AS 6 behind it – a result of the microarchitectural improvements as well as higher power budget.
3DMark Time Spy
The Time Spy workload has two levels with different complexities. Both use DirectX 12 (feature level 11). However, the plain version targets high-performance gaming PCs with a 2560 x 1440 render resolution, while the Extreme version renders at 3840 x 2160 resolution. The graphs below present both numbers for all the systems that are being compared in this review.
| UL 3DMark – Time Spy Workloads | |||

The observations made in Fire Strike workloads hold true for Time Spy also. The advantage for GTR7 over the 42W Ryzen 7 7735U in the ASRock Industrial 4X4 BOX-7735U is around 25%.
3DMark Wild Life
The Wild Life workload was initially introduced as a cross-platform GPU benchmark in 2020. It renders at a 2560 x 1440 resolution using Vulkan 1.1 APIs on Windows. It is a relatively short-running test, reflective of mobile GPU usage. In mid-2021, UL released the Wild Life Extreme workload that was a more demanding version that renders at 3840 x 2160 and runs for a much longer duration reflective of typical desktop gaming usage.
| UL 3DMark – Wild Life Workloads | |||

3D Mark Wild Life was one of the GPU workloads where RPL-P’s iGPU had performed better than the Radeon 680M in the Rembrandt-R systems. The GTR7’s Radeon 780M wrests the crown from the ASRock Industrial NUC BOX-1360P/D5, showing a 7% increase in performance at 1440p and 17% increase at 2160p. This is doubtless due to the improved microarchitecture and higher power budget.
3DMark Night Raid
The Night Raid workload is a DirectX 12 benchmark test. It is less demanding than Time Spy, and is optimized for integrated graphics. The graph below presents the overall score in this workload for different system configurations.
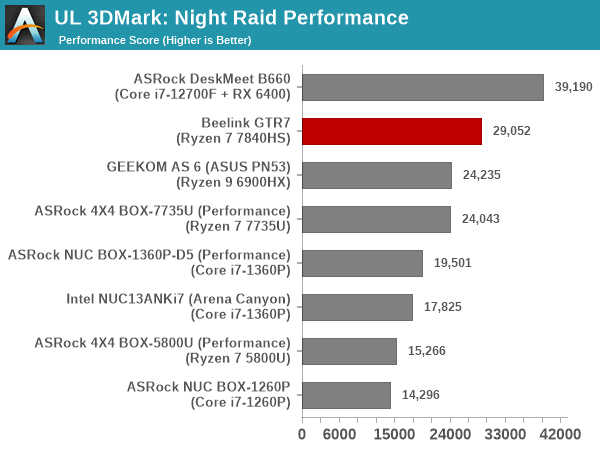
The GTR7 is comfortable on top when systems with iGPUs are considered, with a 20% advantage over the GEEKOM AS 6 (which has a 20% advantage over the best that RPL-P has to offer).
3DMark Port Royal
UL introduced the Port Royal ray-tracing benchmark as a DLC for 3DMark in early 2019. The scores serve as an indicator of how the system handles ray-tracing effects in real-time.
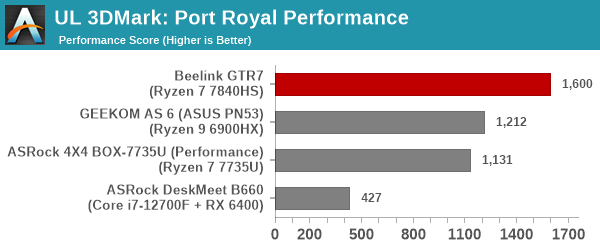
The GTR7 has a 30%+ advantage over the GEEKOM AS 6, thanks to improvements in the ray tracing engine, as well as faster iGPU clocks.
SFF PCs traditionally do not lend themselves to workstation duties. However, a recent trend towards miniaturized workstations has been observed. While the Raptor Canyon NUC is primarily marketed towards gamers, its capabilities encouraged us to benchmark the system for both content creation workloads as well as professional applications. Towards this, we processed two SPEC benchmarks geared towards workstations – SPECworkstation 3.10 and SPECviewperf 2020 v3.
SPECworkstation 3.1
The SPECworkstation 3.1 benchmark measures workstation performance based on a number of professional applications. It includes more than 140 tests based on 30 different workloads that exercise the CPU, graphics, I/O and memory hierarchy. These workloads fall into different categories.
- Media and Entertainment (3D animation, rendering)
- Product Development (CAD/CAM/CAE)
- Life Sciences (medical, molecular)
- Financial Services
- Energy (oil and gas)
- General Operations
- GPU Compute
Individual scores are generated for each test and a composite score for each category is calculated based on a reference machine (HP Z240 tower workstation using an Intel E3-1240 v5 CPU, an AMD Radeon Pro WX3100 GPU, 16GB of DDR4-2133, and a SanDisk 512GB SSD). Official benchmark results generated automatically by the benchmark itself are linked in the table below for the systems being compared.
| SPECworkstation 3.1 Official Results (2K) | |
| Beelink GTR7 | Run Summary |
| ASRock DeskMeet B660 | Run Summary |
| GEEKOM AS 6 (ASUS PN53) | Run Summary |
| ASRock NUC BOX-1260P | Run Summary |
| ASRock NUC BOX-1360P-D5 (Performance) | Run Summary |
| ASRock 4X4 BOX-7735U (Performance) | Run Summary |
| ASRock 4X4 BOX-5800U (Performance) | Run Summary |
| Intel NUC13ANKi7 (Arena Canyon) | Run Summary |
Details of the tests in each category, as well as an overall comparison of the systems on a per-category basis are presented below.
Media and Entertainment
The Media and Entertainment category comprises of workloads from five distinct applications:
- The Blender workload measures system performance for content creation using the open-source Blender application. Tests include rendering of scenes of varying complexity using the OpenGL and ray-tracing renderers.
- The Handbrake workload uses the open-source Handbrake application to transcode a 4K H.264 file into a H.265 file at 4K and 2K resolutions using the CPU capabilities alone.
- The LuxRender workload benchmarks the LuxCore physically based renderer using LuxMark.
- The Maya workload uses the SPECviewperf 13 maya-05 viewset to replay traces generated using the Autodesk Maya 2017 application for 3D animation.
- The 3ds Max workload uses the SPECviewperf 13 3dsmax-06 viewset to replay traces generated by Autodesk’s 3ds Max 2016 using the default Nitrous DX11 driver. The workload represents system usage for 3D modeling tasks.
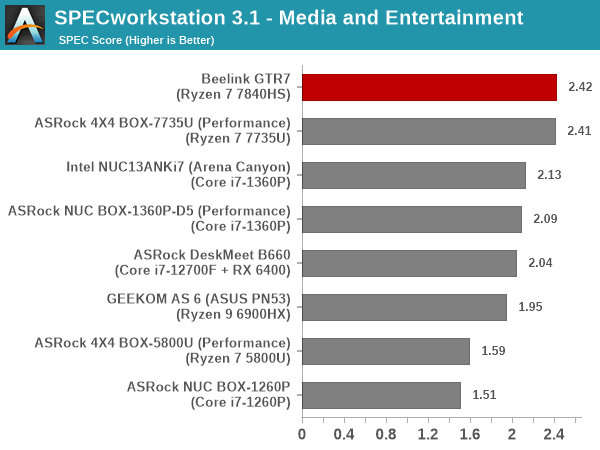
This category sees the different systems getting ordered on the basis of the configured sustained TDP. The GTR7 with its 65W TDP is at the top, followed closely behind by the 4X4 BOX-7735U with its 42W TDP, and the 40W RPL-P systems (including the Arena Canyon NUC) follow behind. The Rembrandt-R-based GEEKOM AS 6 with its 35W setting is in the middle of the pack, ahead of the previous generation systems.
Product Development
The Product Development category comprises of eight distinct workloads:
- The Rodinia (CFD) workload benchmarks a computational fluid dynamics (CFD) algorithm.
- The WPCcfd workload benchmarks another CFD algorithm involving combustion and turbulence modeling.
- The CalculiX workload uses the Calculix finite-element analysis program to model a jet engine turbine’s internal temperature.
- The Catia workload uses the catia-05 viewset from SPECviewperf 13 to replay traces generated by Dassault Systemes’ CATIA V6 R2012 3D CAD application.
- The Creo workload uses the creo-02 viewset from SPECviewperf 13 to replay traces generated by PTC’s Creo, a 3D CAD application.
- The NX workload uses the snx-03 viewset from SPECviewperf 13 to replay traces generated by the Siemens PLM NX 8.0 CAD/CAM/CAE application.
- The Solidworks workload uses the sw-04 viewset from SPECviewperf 13 to replay traces generated by Dassault Systemes’ SolidWorks 2013 SP1 CAD/CAE application.
- The Showcase workload uses the showcase-02 viewset from SPECviewperf 13 to replay traces from Autodesk???s Showcase 2013 3D visualization and presentation application
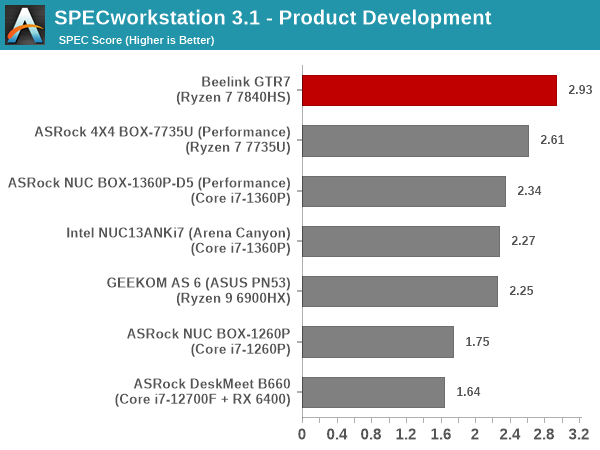
The trend observed in the Media and Entertainment category repeats here, with the GTR7 faring better than the 4X4 BOX-7735U. The performance advantage is also more noticeable and representative of the 65W – 42W gap in the TDPs.
Life Sciences
The Life Sciences category comprises of four distinct test sets:
- The LAMMPS set comprises of five tests simulating different molecular properties using the LAMMPS molecular dynamics simulator.
- The NAMD set comprises of three tests simulating different molecular interactions.
- The Rodinia (Life Sciences) set comprises of four tests – the Heartwall medical imaging algorithm, the Lavamd algorithm for calculation of particle potential and relocation in a 3D space due to mutual forces, the Hotspot algorithm to estimate processor temperature with thermal simulations, and the SRAD anisotropic diffusion algorithm for denoising.
- The Medical workload uses the medical-02 viewset from SPECviewperf 13 to determine system performance for the Tuvok rendering core in the ImageVis3D volume visualization program.
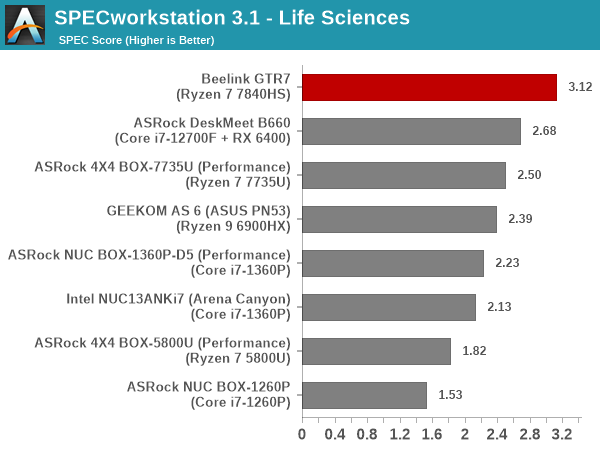
The addition of a GPU-centric component in the workload allows the Rembrandt-R-based GEEKOM AS 6 to leapfrog the RPL-P-based systems, but the 65W configuration of the GTR7 continues to enjoy a healthy lead.
Financial Services
The Financial Services workload set benchmarks the system for three popular algorithms used in the financial services industry – the Monte Carlo probability simulation for risk assessment and forecast modeling, the Black-Scholes pricing model, and the Binomial Options pricing model.
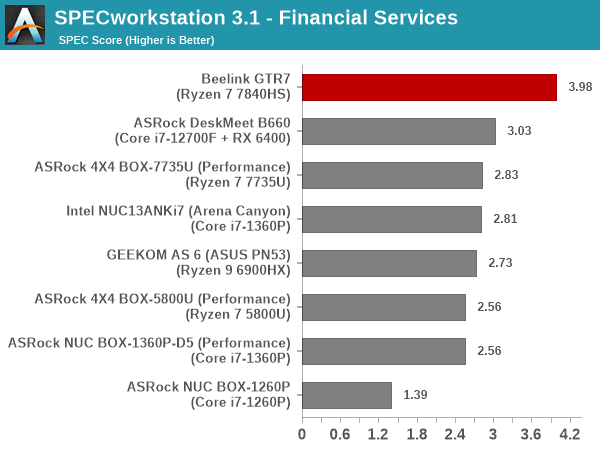
The GTR7 continues to outperform the rest of the systems in this workload set also. The comparison against the DeskMeet B660 is particularly striking. Devoting 65W to eight high-performance and four efficiency cores is not a particularly good solution compared to devoting 65W completely to eight high-performance cores – particularly when the task at hand is a single workload requiring extensive CPU power.
Energy
The Energy category comprises of workloads simulating various algorithms used in the oil and gas industry:
- The FFTW workload computes discrete Fourier transforms of large matrices.
- The Convolution workload computes the convolution of a random 100×100 filter on a 400 megapixel image.
- The SRMP workload processes the Surface-Related Multiples Prediction algorithm used in seismic data processing.
- The Kirchhoff Migration workload processes an algorithm to calculate the back propogation of a seismic wavefield.
- The Poisson workload takes advantage of the OpenMP multi-processing framework to solve the Poisson’s equation.
- The Energy workload uses the energy-02 viewset from SPECviewperf 13 to determine system performance for the open-source OPendTec seismic visualization application.
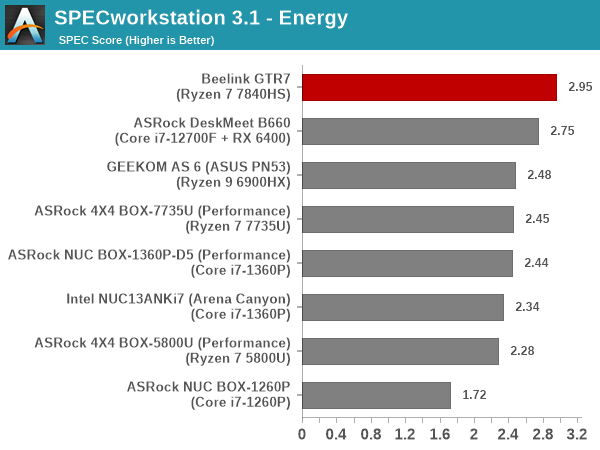
This workload also includes a GPU-centric component. The mixture of CPU-heavy and GPU-heavy operations is such that the GTR7 even outperforms the DeskMeet B660 with a low-end discrete GPU. Other systems are ordered in terms of TDP, with differences being in the realm of run-to-run variations).
General Operations
In the General Options category, the focus is on workloads from widely used applications in the workstation market:
- The 7zip workload represents compression and decompression operations using the open-source 7zip file archiver program.
- The Python workload benchmarks math operations using the numpy and scipy libraries along with other Python features.
- The Octave workload performs math operations using the Octave programming language used in scientific computing.
- The Storage workload evaluates the performance of the underlying storage device using transaction traces from multiple workstation applications.
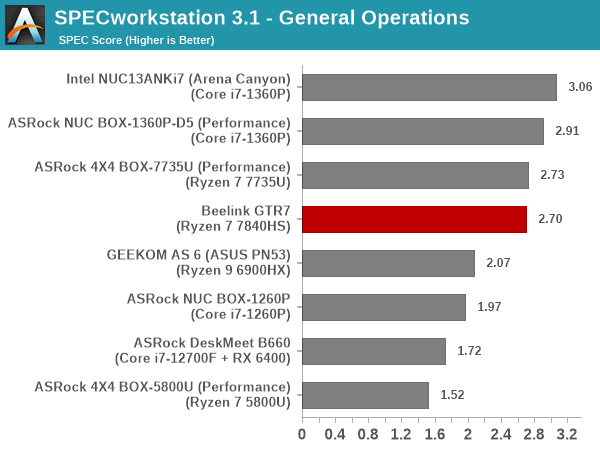
The components in this workload benefit from single-threaded performance as well as high-performance storage subsystems. The SSD used in the Arena Canyon NUC, NUC BOX-1360P/D5, and 4X4 BOX-7735U use SSDs with DRAM for the FTL. While the Crucial P3 Plus in the GTR7 doesn’t have DRAM, it is compensated by much higher CPU performance. As a result, there is a significant gulf in the scores of the other systems and the above systems, with the GTR7 belonging to the leading pack – albeit, at its bottom.
GPU Compute
In the GPU Compute category, the focus is on workloads taking advantage of the GPU compute capabilities using either OpenCL or CUDA, as applicable:
- The LuxRender benchmark is the same as the one seen in the media and entertainment category.
- The Caffe benchmark measures the performance of the Caffe deep-learning framework.
- The Folding@Home benchmark measures the performance of the system for distributed computing workloads focused on tasks such as protein folding and drug design.
We only process the OpenCL variants of the benchmark, as the CUDA version doesn’t process correctly with default driver installs.
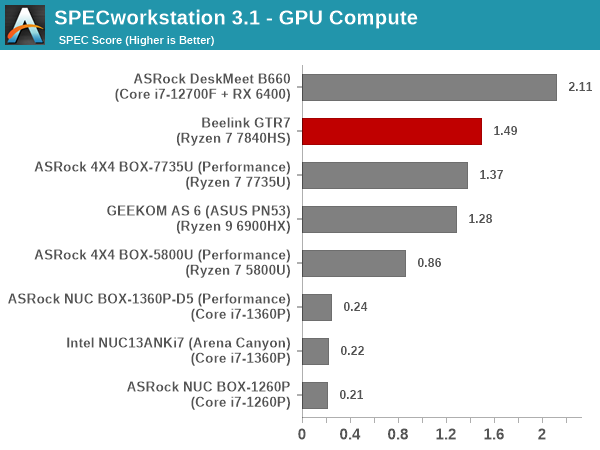
The GTR7 has the highest power budget and the latest integrated GPU microarchitecture. It is no surprise, therefore, that the system comes out on top among all the UCFF / SFF systems with iGPUs in the GPU Compute workloads.
One of the key drivers of advancements in computing systems is multi-tasking. On mobile devices, this is quite lightweight – cases such as background email checks while the user is playing a mobile game are quite common. Towards optimizing user experience in those types of scenarios, mobile SoC manufacturers started integrating heterogenous CPU cores – some with high performance for demanding workloads, while others were frugal in terms of both power consumption / die area and performance. This trend is now slowly making its way into the desktop PC space.
Multi-tasking in typical PC usage is much more demanding compared to phones and tablets. Desktop OSes allow users to launch and utilize a large number of demanding programs simultaneously. Responsiveness is dictated largely by the OS scheduler allowing different tasks to move to the background. The processor is required to work closely with the OS thread scheduler to optimize performance in these cases. Keeping these aspects in mind, the evaluation of multi-tasking performance is an interesting subject to tackle.
We have augmented our systems benchmarking suite to quantitatively analyze the multi-tasking performance of various platforms. The evaluation involves triggering a ffmpeg transcoding task to transform 1716 3840×1714 frames encoded as a 24fps AVC video (Blender Project’s ‘Tears of Steel’ 4K version) into a 1080p HEVC version in a loop. The transcoding rate is monitored continuously. One complete transcoding pass is allowed to complete before starting the first multi-tasking workload – the PCMark 10 Extended bench suite. A comparative view of the PCMark 10 scores for various scenarios is presented in the graphs below. Also available for concurrent viewing are scores in the normal case where the benchmark was processed without any concurrent load, and a graph presenting the loss in performance.
| UL PCMark 10 Load Testing – Digital Content Creation Scores | |||

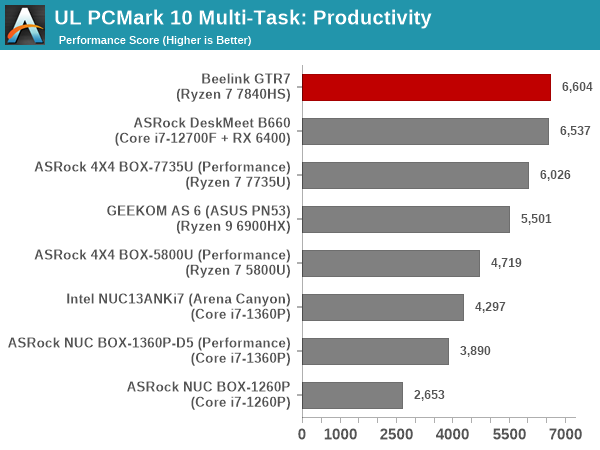
| UL PCMark 10 Load Testing – Productivity Scores | |||
| UL PCMark 10 Load Testing – Essentials Scores | |||

| UL PCMark 10 Load Testing – Gaming Scores | |||

| UL PCMark 10 Load Testing – Overall Scores | |||
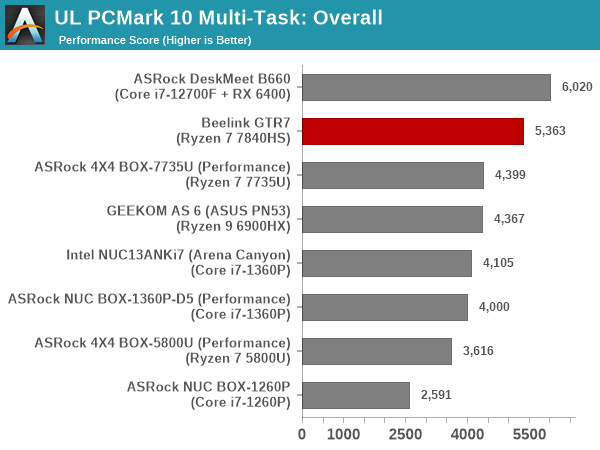
Configuring the GTR7’s Phoenix SoC at 65W gives it plenty of headroom to tackle multiple concurrent demanding workloads triggered by mainstream users (of the type benchmarked by PCMark 10). The GTR7 was already having leading performance in the absence of concurrent loading. Activation of such loads reduces the raw score, but the performance loss is less than the competition, and the GTR7 continues to remain on top.
Following the completion of the PCMark 10 benchmark, a short delay is introduced prior to the processing of Principled Technologies WebXPRT4 on MS Edge. Similar to the PCMark 10 results presentation, the graph below show the scores recorded with the transcoding load active. Available for comparison are the dedicated CPU power scores and a measure of the performance loss.
| Principled Technologies WebXPRT4 Load Testing Scores (MS Edge) | |||
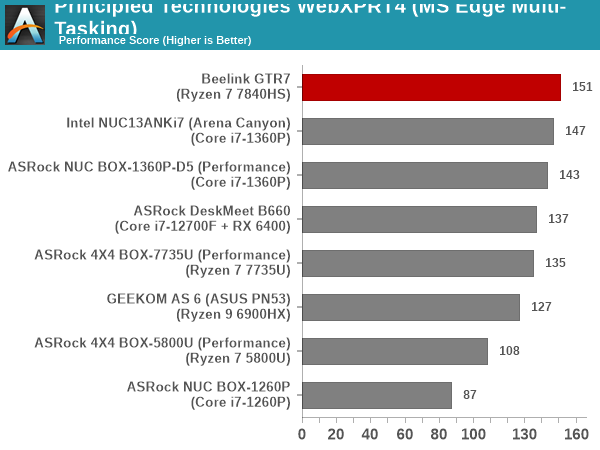
The observations made for the overall PCMark 10 scores continue to hold for WebXPRT 4 also. The GTR7 has the least performance loss, and that allows it to leapfrog the RPL-P systems in performance.
The final workload tested as part of the multitasking evaluation routine is CINEBENCH R23.
| 3D Rendering – CINEBENCH R23 Load Testing – Single Thread Score | |||

| 3D Rendering – CINEBENCH R23 Load Testing – Multiple Thread Score | |||
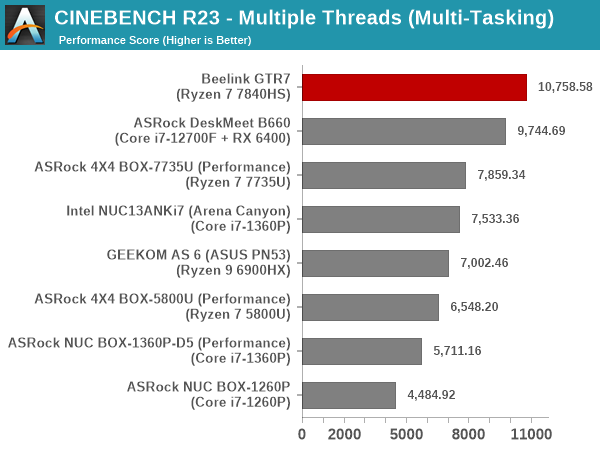
Intensive background tasks keep the efficiency cores busy, and take up some of the power budget. As a result, while the RPL-P systems came out on top in the absence of the background loads in single-threaded mode, the AMD-based systems manages to outwit them in raw scores after the introduction of the load. Multi-threaded performance continues to be a strongpoint of the GTR7, with the system coming out on top irrespective of the concurrent loading.
After the completion of all the workloads, we let the transcoding routine run to completion. The monitored transcoding rate throughout the above evaluation routine (in terms of frames per second) is graphed below.
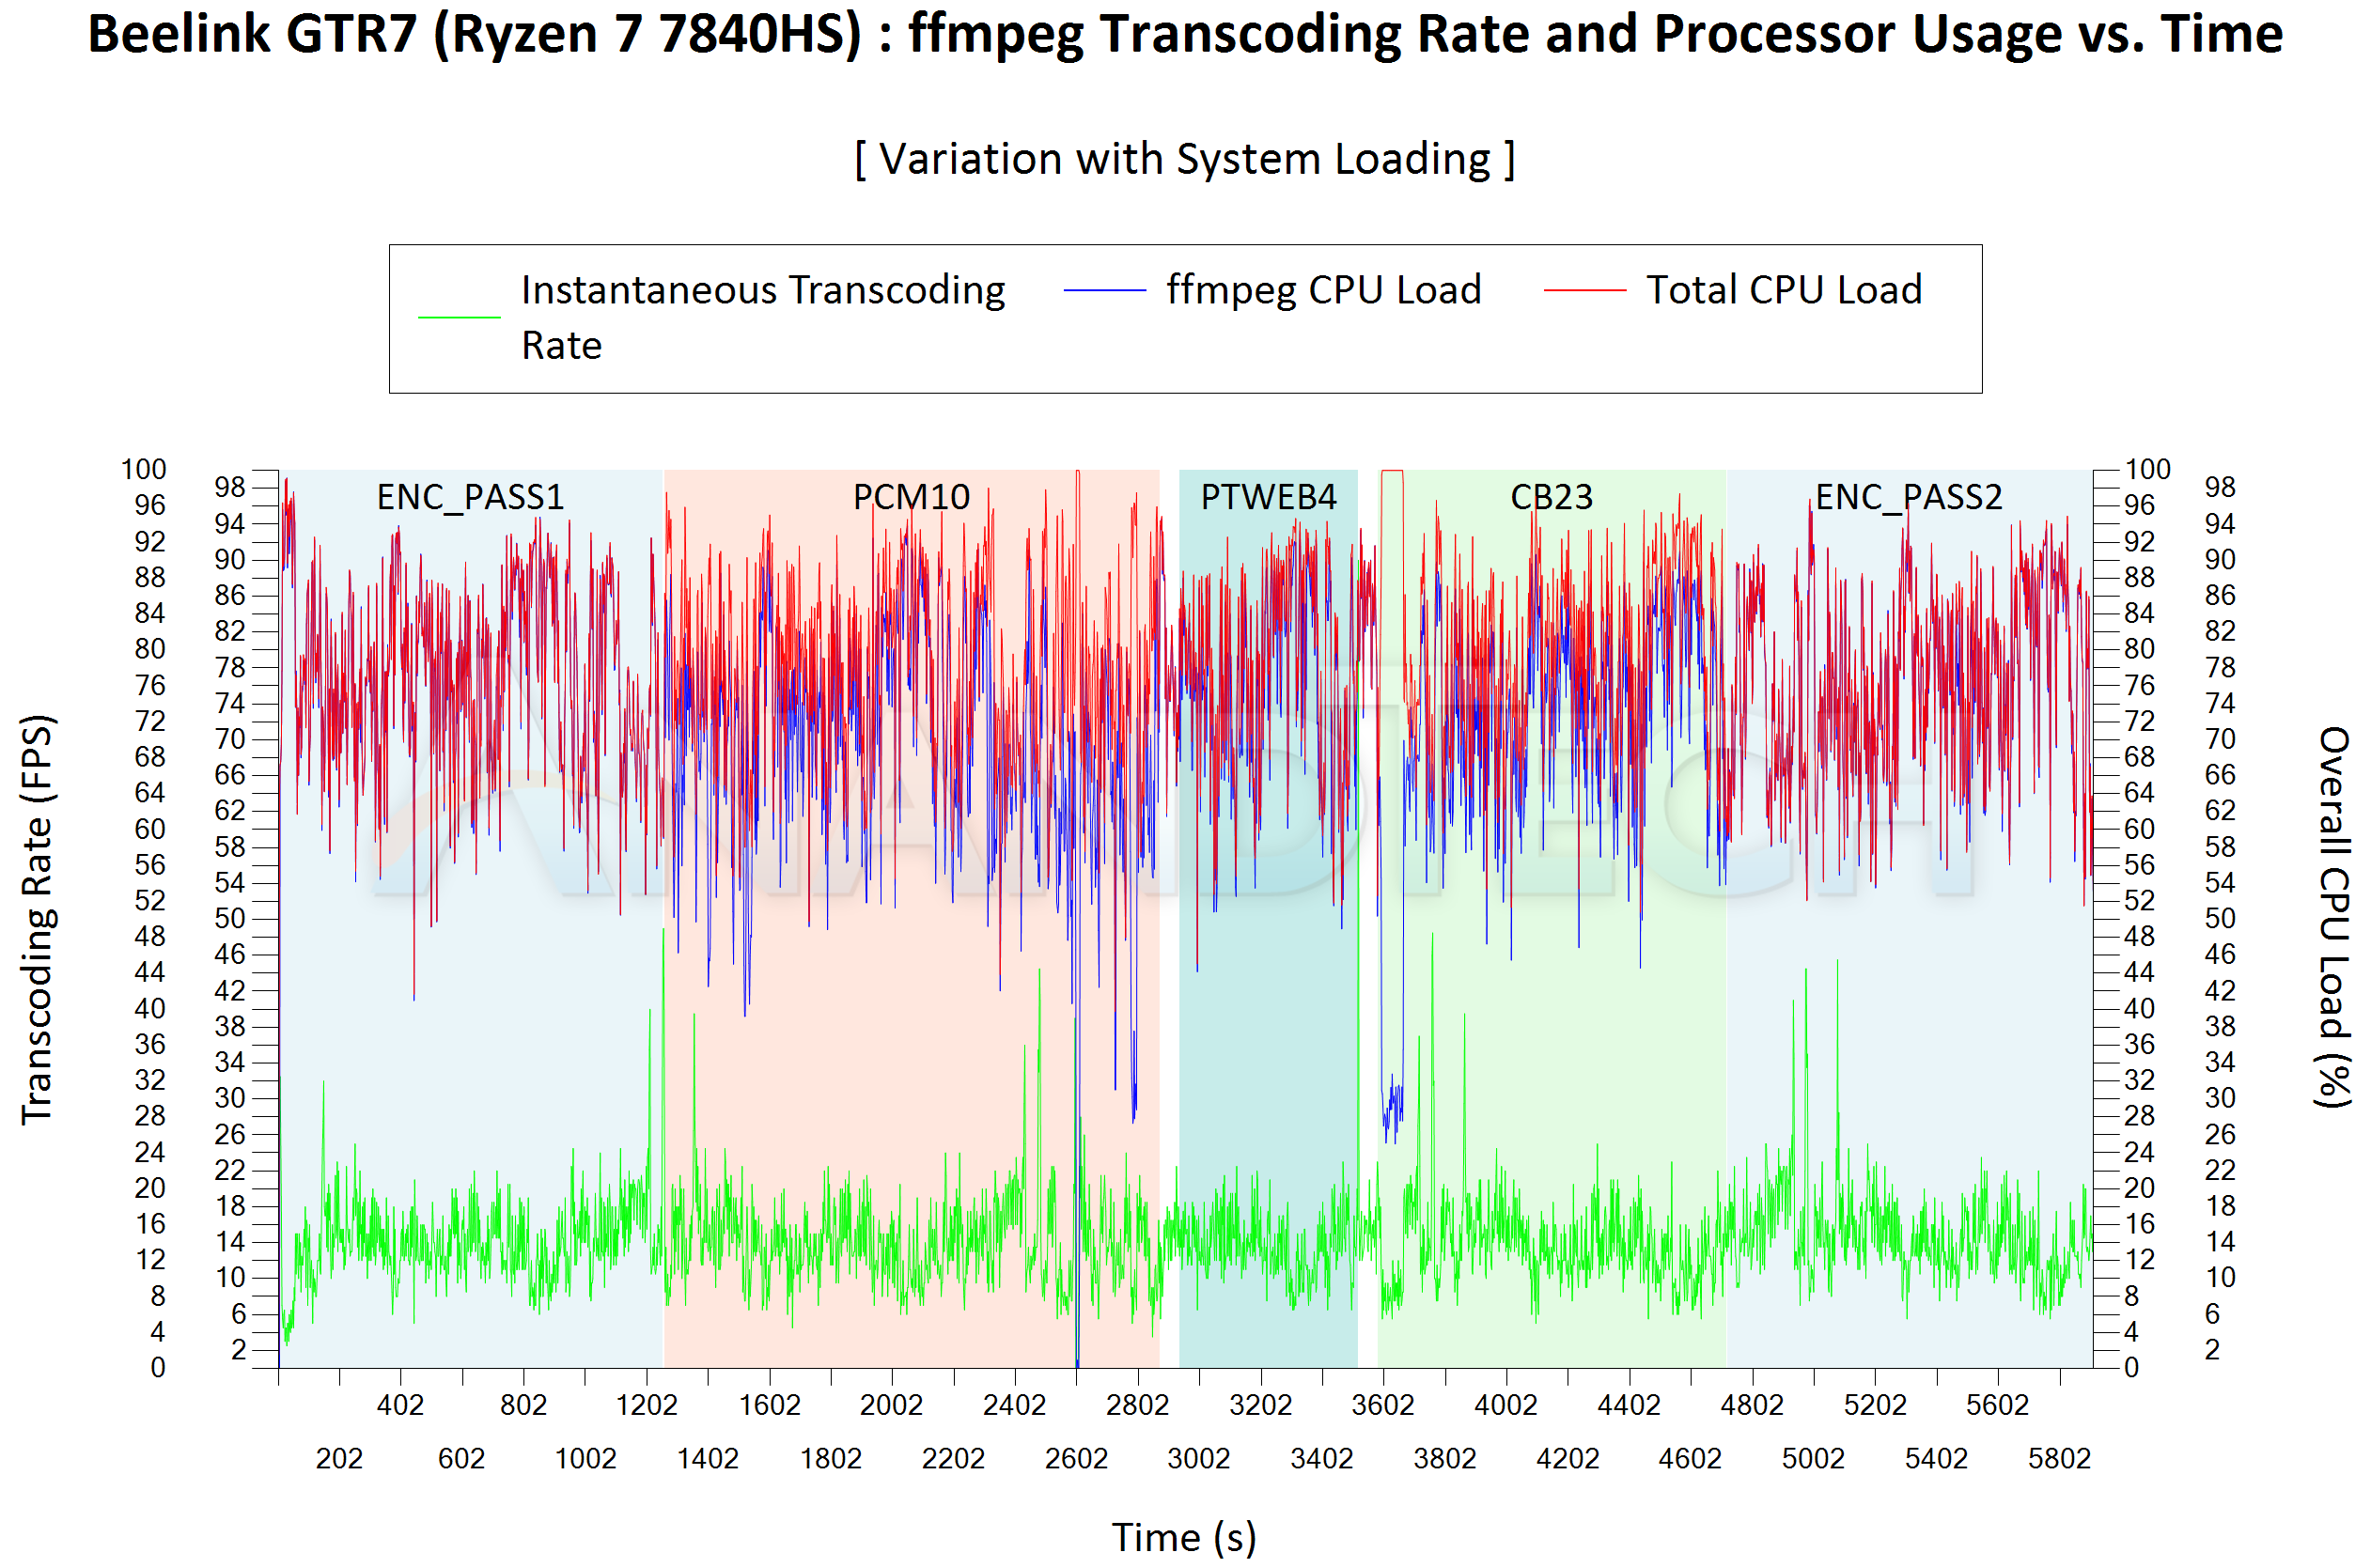
The transcoding rate during different segments is also recorded below.
| Beelink GTR7 (Ryzen 7 7840HS) ffmpeg Transcoding Rate (Multi-Tasking Test) |
|||
| Task Segment | Transcoding Rate (FPS) | ||
| Minimum | Average | Maximum | |
| Transcode Start Pass | 2.5 | 14.12 | 46.5 |
| PCMark 10 | 0 | 13.99 | 44.5 |
| WebXPRT 4 | 6.5 | 13.63 | 23 |
| Cinebench R23 | 5 | 13.78 | 48.5 |
| Transcode End Pass | 5.5 | 14.8 | 45.5 |
The comparison is against RPL-P systems such as the NUC BOX-1360P/D5. The GTR7 has a much lower delta in the transcoding rate between different task segments, but the power budget ensures that it doesn’t translate to a lower primary workload score as seen in the graphs above. Overall, the RPL-P systems seem to prioritize foreground task better compared to AMD systems, but with the right power budget, the end user may not even notice the aspect.
The 2022 Q4 update to our system reviews brings an updated HTPC evaluation suite for systems. After doing away with the evaluation of display refresh rate stability and Netflix streaming evaluation, the local media playback configurations have also seen a revamp. This section details each of the workloads processed on the Beelink GTR7 as part of the HTPC suite.
YouTube Streaming Efficiency
YouTube continues to remain one of the top OTT platforms, primarily due to its free ad-supported tier. Our HTPC test suite update retains YouTube streaming efficiency evaluation as a metric of OTT support in different systems. Mystery Box’s Peru 8K HDR 60FPS video is the chosen test sample. On PCs running Windows, it is recommended that HDR streaming videos be viewed using the Microsoft Edge browser after putting the desktop in HDR mode.
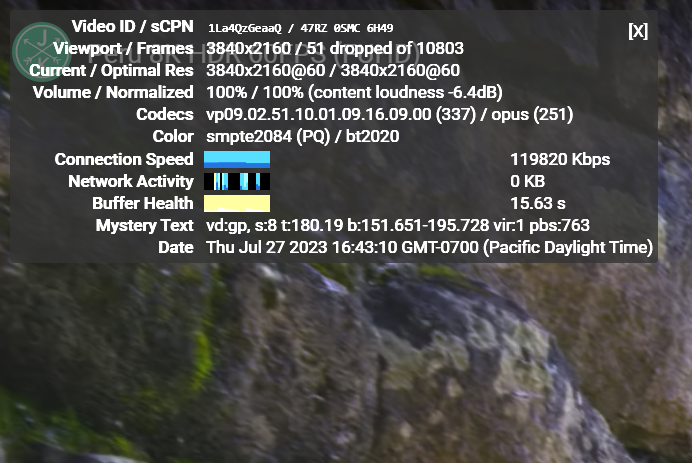
YouTube Streaming Statistics
The GPU in Beelink GTR7 supports hardware decoding of VP9 Profile 2, and we see the stream encoded with that codec being played back. The streaming is perfect, thanks to the powerful GPU and hardware decoding support – the dropped frames observed in the statistics below are due to mouse clicks involved in bringing up the overlay.
The streaming efficiency-related aspects such as GPU usage and at-wall power consumption are also graphed below.
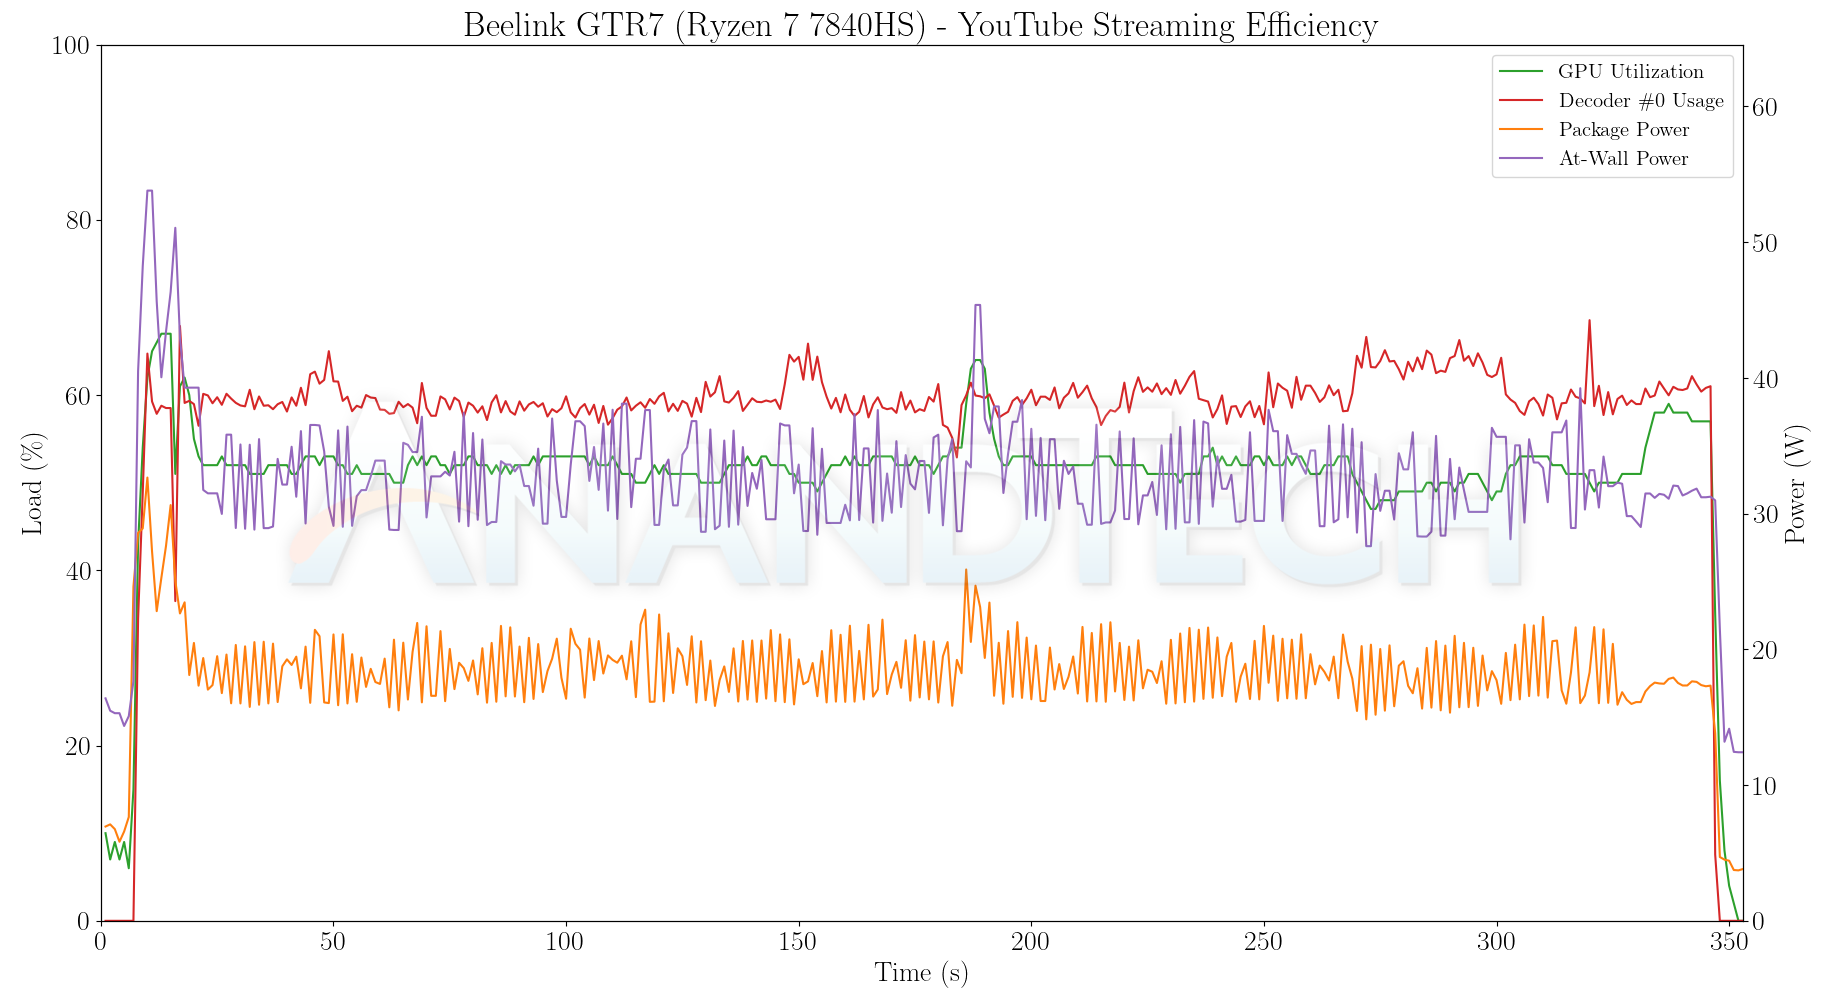

The NUC BOX-1360P/D5 RPL-P system is the most energy efficient of the tested lot by a huge margin, but the Phoenix and Rembrandt systems (GTR7 and GEEKOM AS 6) slot in right behind.
Hardware-Accelerated Encoding and Decoding
The transcoding benchmarks in the systems performance section presented results from evaluating the VCE encoder within Handbrake’s framework. The capabilities of the decoder engine are brought out by DXVAChecker.
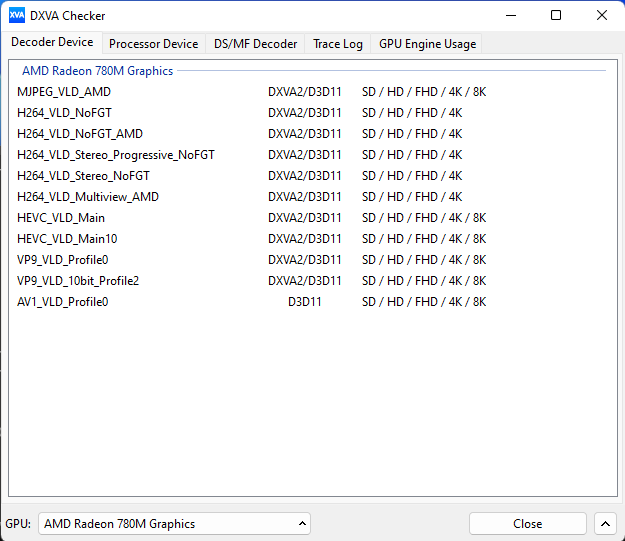
Video Decoding Hardware Acceleration in Beelink GTR7
On paper, this codec list is quite comprehensive and should cover most home consumer and digital signage requirements
Local Media Playback
Evaluation of local media playback and video processing is done by playing back files encompassing a range of relevant codecs, containers, resolutions, and frame rates. A note of the efficiency is also made by tracking GPU usage and power consumption of the system at the wall. Users have their own preference for the playback software / decoder / renderer, and our aim is to have numbers representative of commonly encountered scenarios. Our Q4 2022 test suite update replaces MPC-HC (in LAV filters / madVR modes) with mpv. In addition to being cross-platform and open-source, the player allows easy control via the command-line to enable different shader-based post-processing algorithms. From a benchmarking perspective, the more attractive aspect is the real-time reporting of dropped frames in an easily parseable manner. The players / configurations considered in this subsection include:
- VLC 3.0.18
- Kodi 20.2
- mpv 0.35.1 (hwdec auto, vo=gpu-next)
- mpv 0.35.1 (hwdec auto, vo=gpu-next, profile=gpu-hq)
Fourteen test streams (each of 90s duration) were played back from the local disk with an interval of 30 seconds in-between. Various metrics including GPU usage, at-wall power consumption, and total energy consumption were recorded during the course of this playback.
All our playback tests were done with the desktop HDR setting turned on. It is possible for certain system configurations to automatically turn on/off the HDR capabilities prior to the playback of a HDR video, but, we didn’t take advantage of that in our testing.

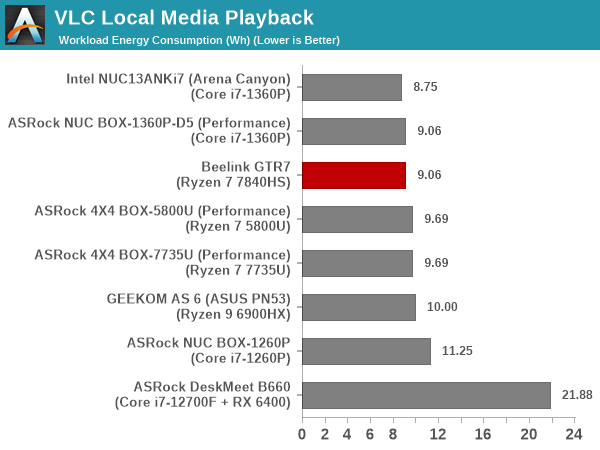
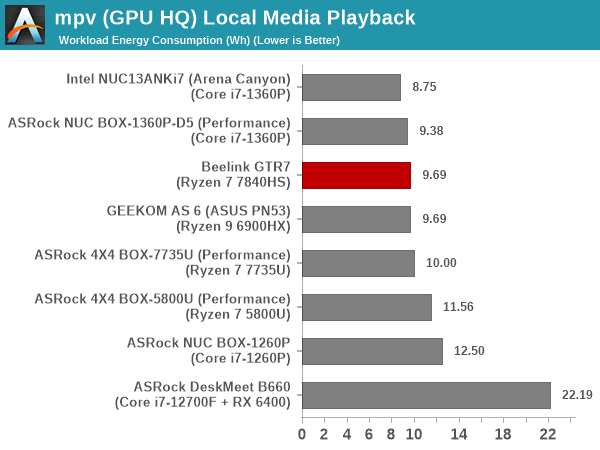
The GTR7 turns out to be the most energy efficient of all the compared AMD systems. All codecs play back well, except for the AV1 clip. VLC doesn’t take advantage of the GPU hardware decoding capabilities for that codec.
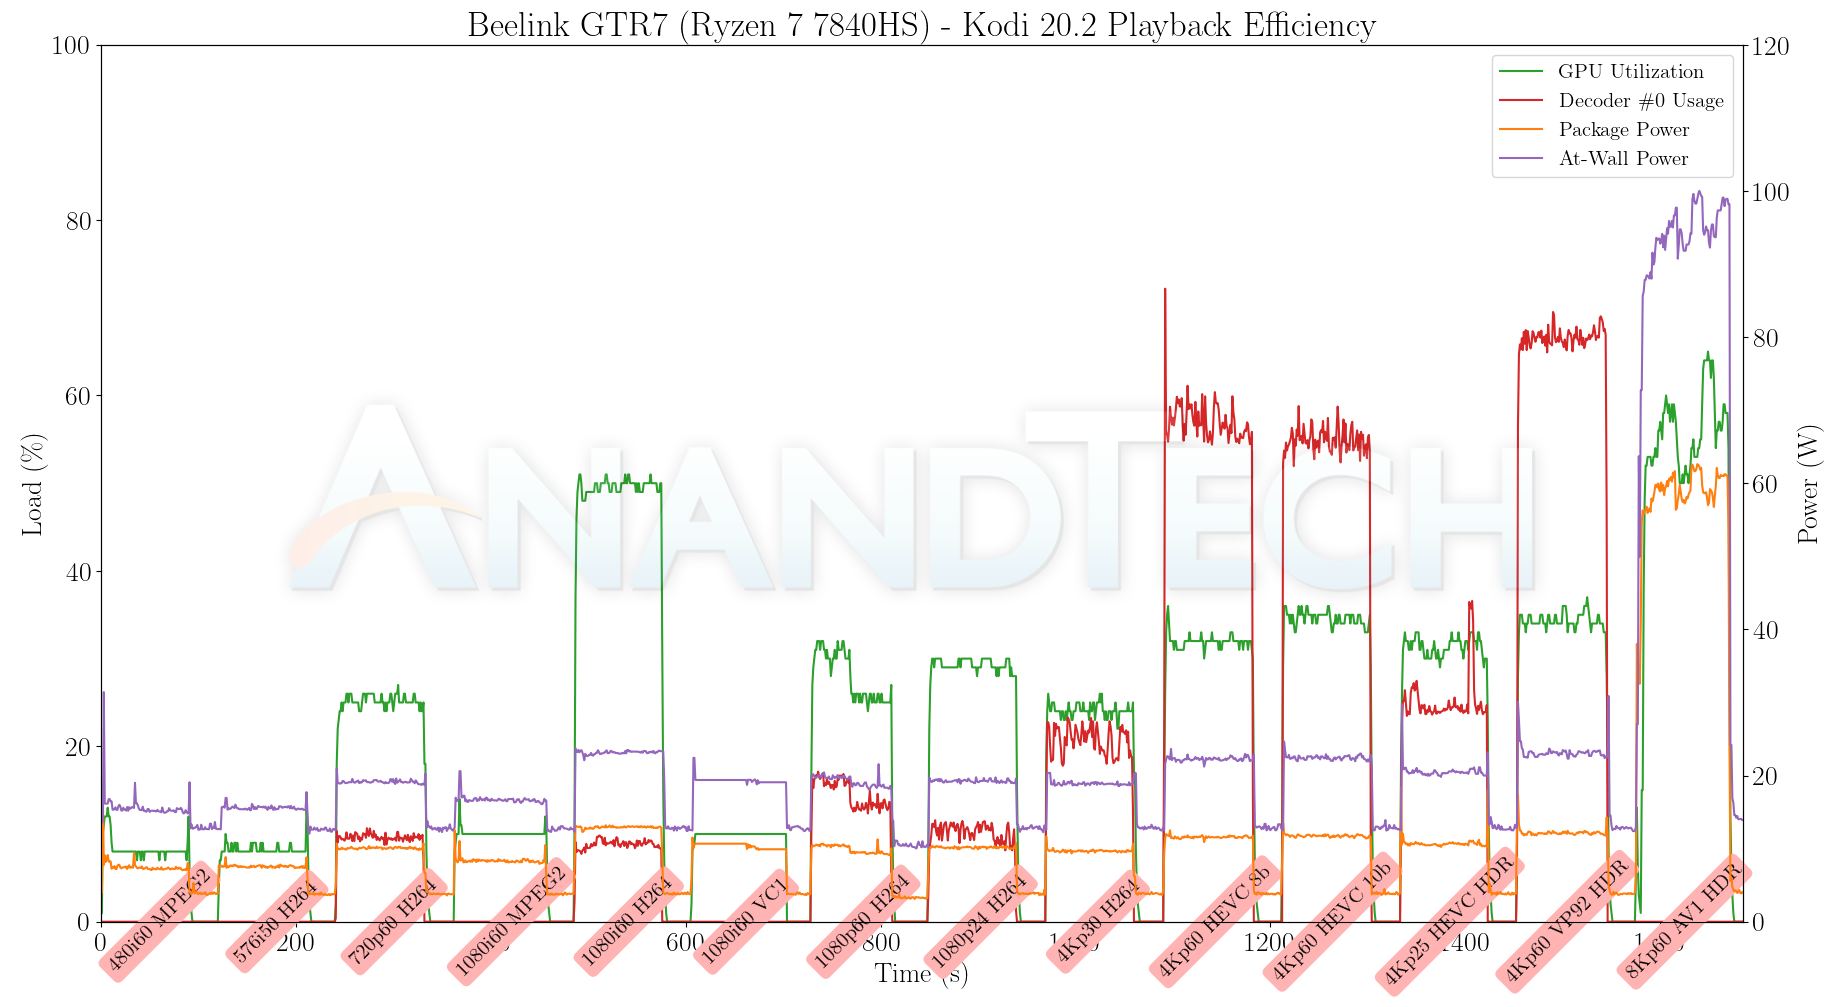
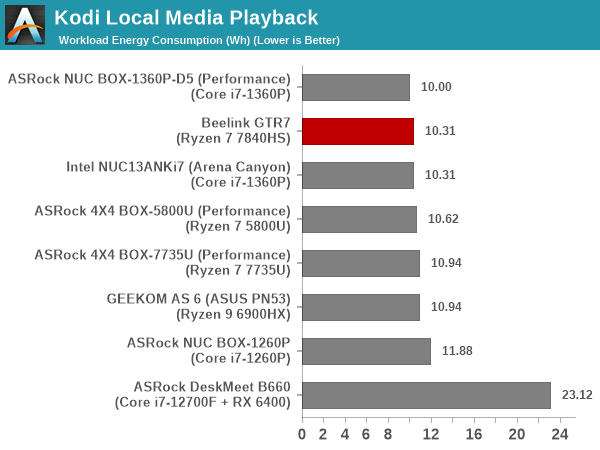
The GTR7 continues to impress with energy efficiency for Kodi playback also. Like with VLC, AV1 hardware acceleration is again unused. Since the Kodi GUI is kept active at the main screen between the playback of different streams, the GPU remains active and continues to render the UI. This results in the energy numbers creeping up when the full playback period is considered.
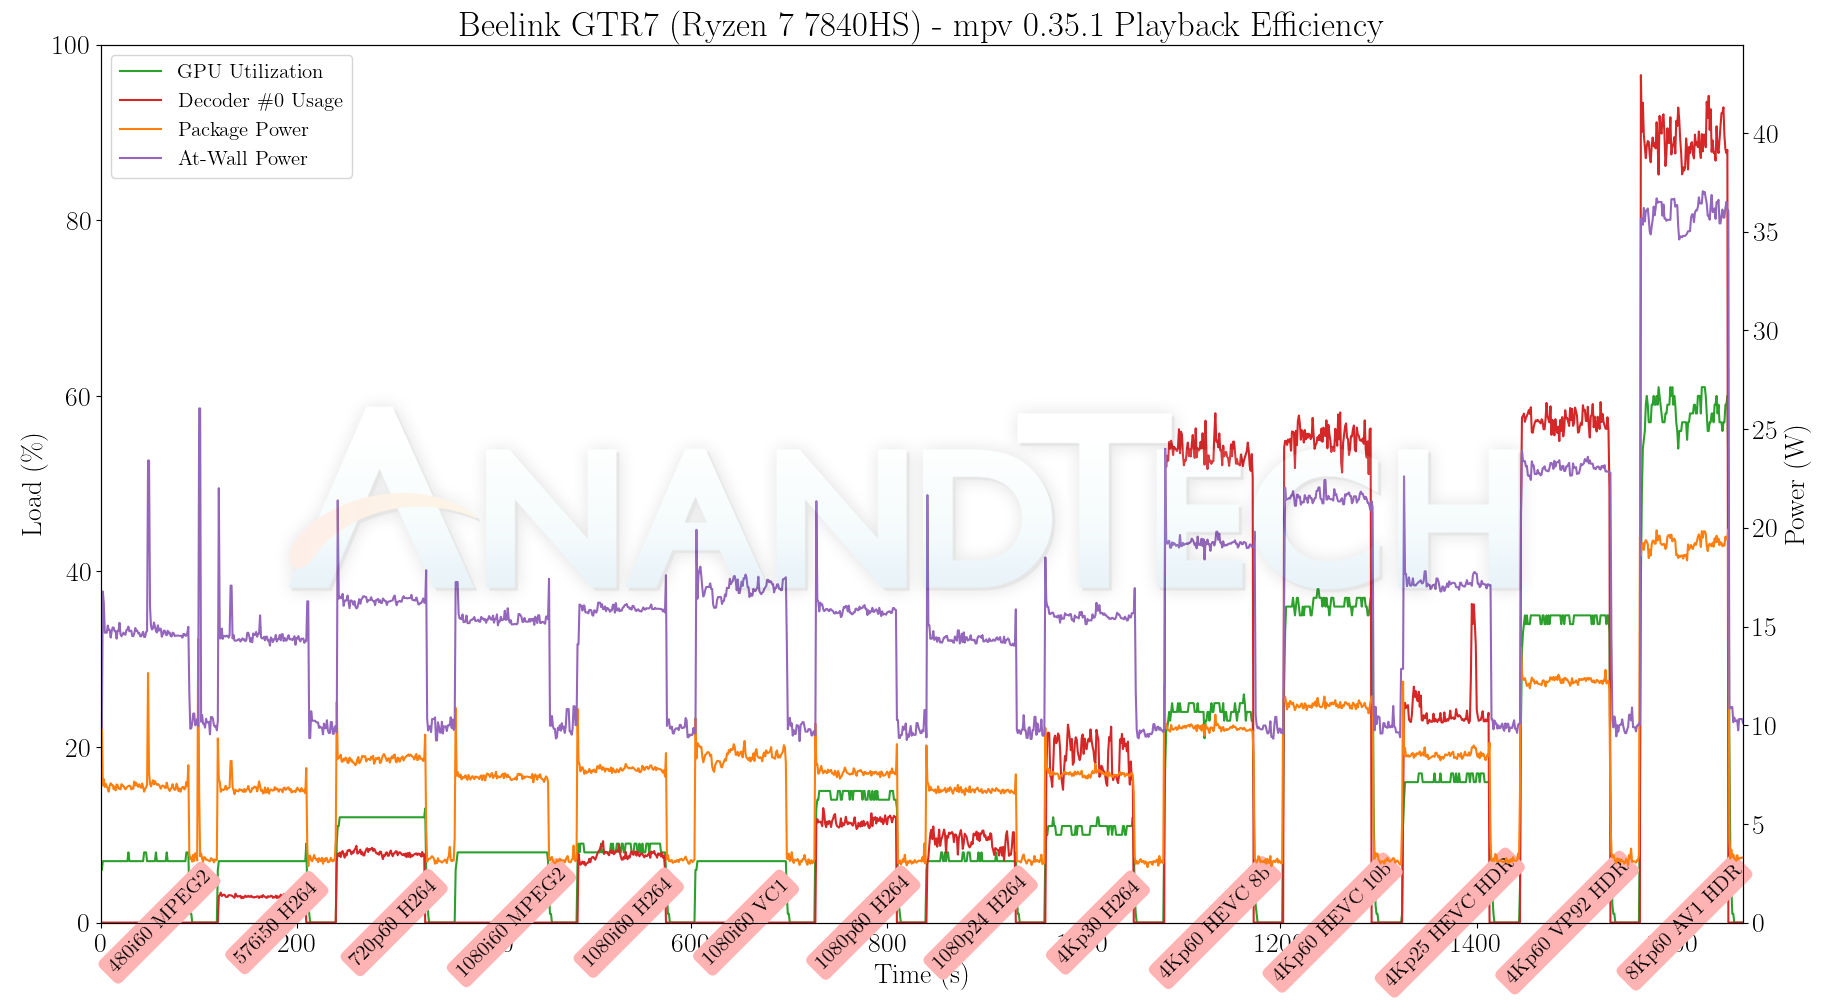

AV1 decode acceleration is utilized by mpv, contributing to the excellent energy efficiency numbers. Unlike our experience with a previous driver release in the Rembrandt-based systems, playback is perfect without any dropped frames./p>
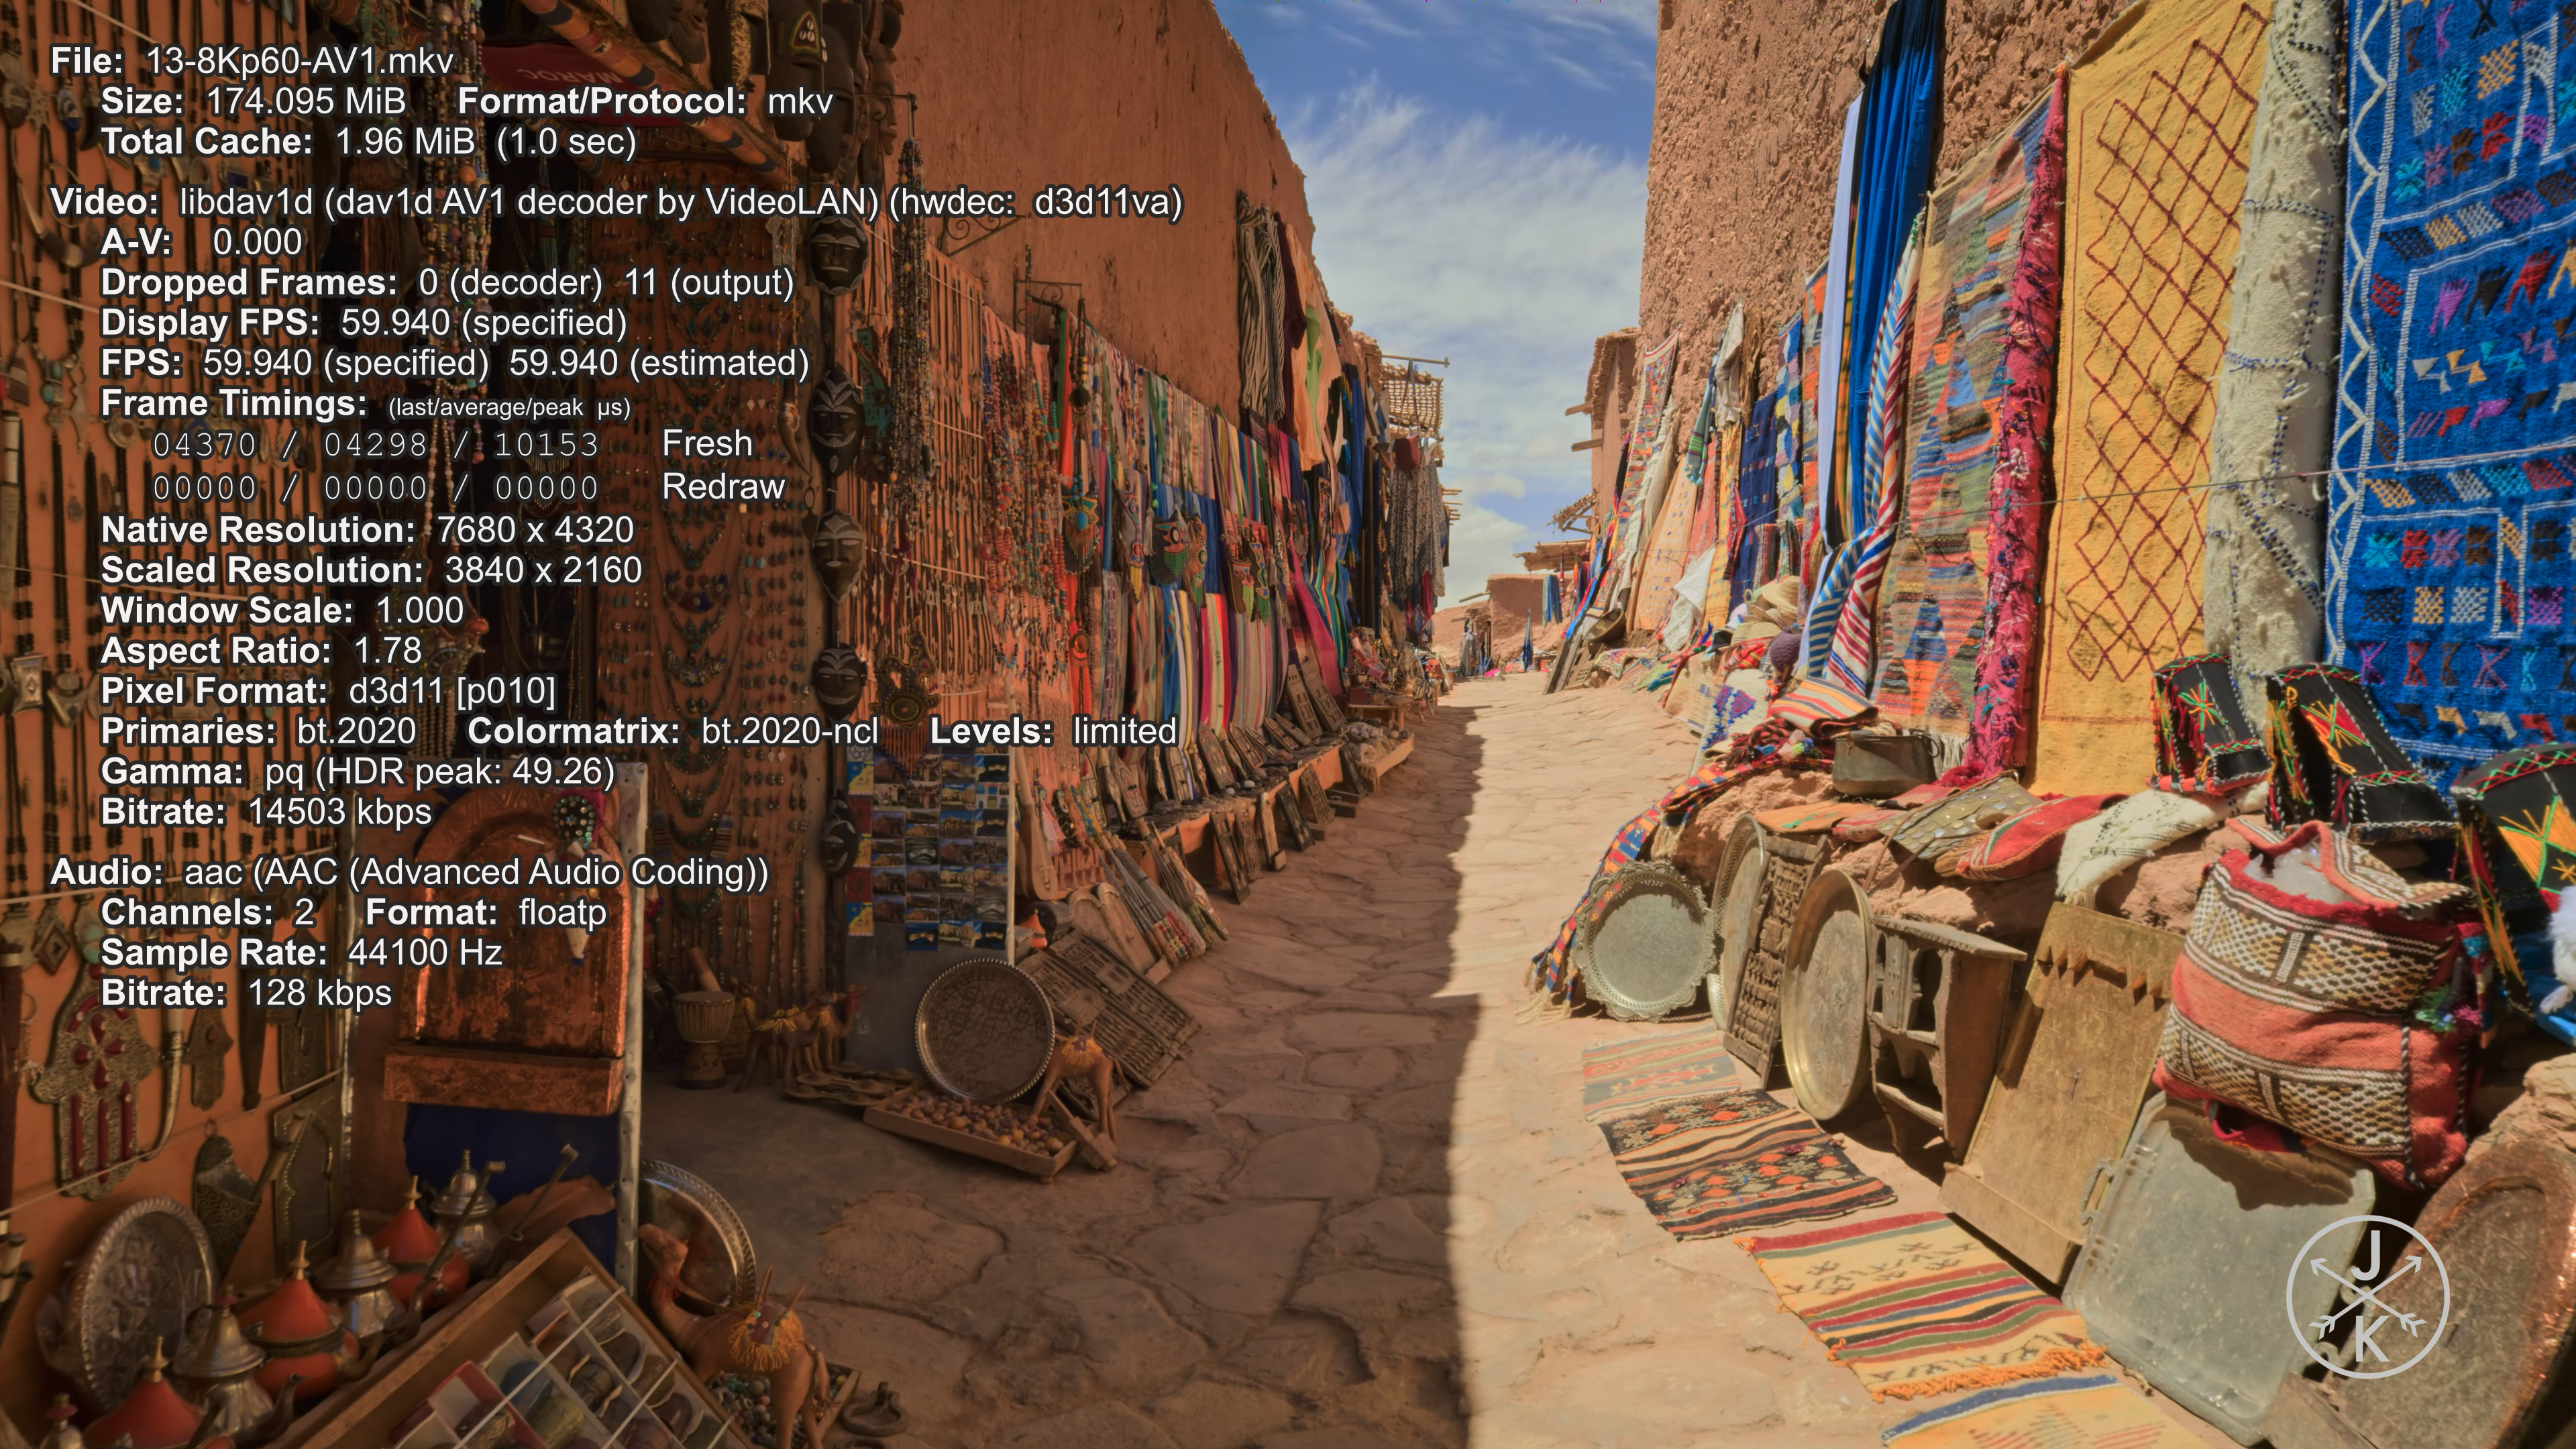
Setting the playback profile to ‘gpu-hq’ results in a lot more work for the shaders. We find that the 8Kp60 AV1 clip decode and presentation is not able to keep up with the real-time requirements because of the extra loading. This results in choppy playback as almost half the frames (2632 out of 5388) are dropped prior to presentation.
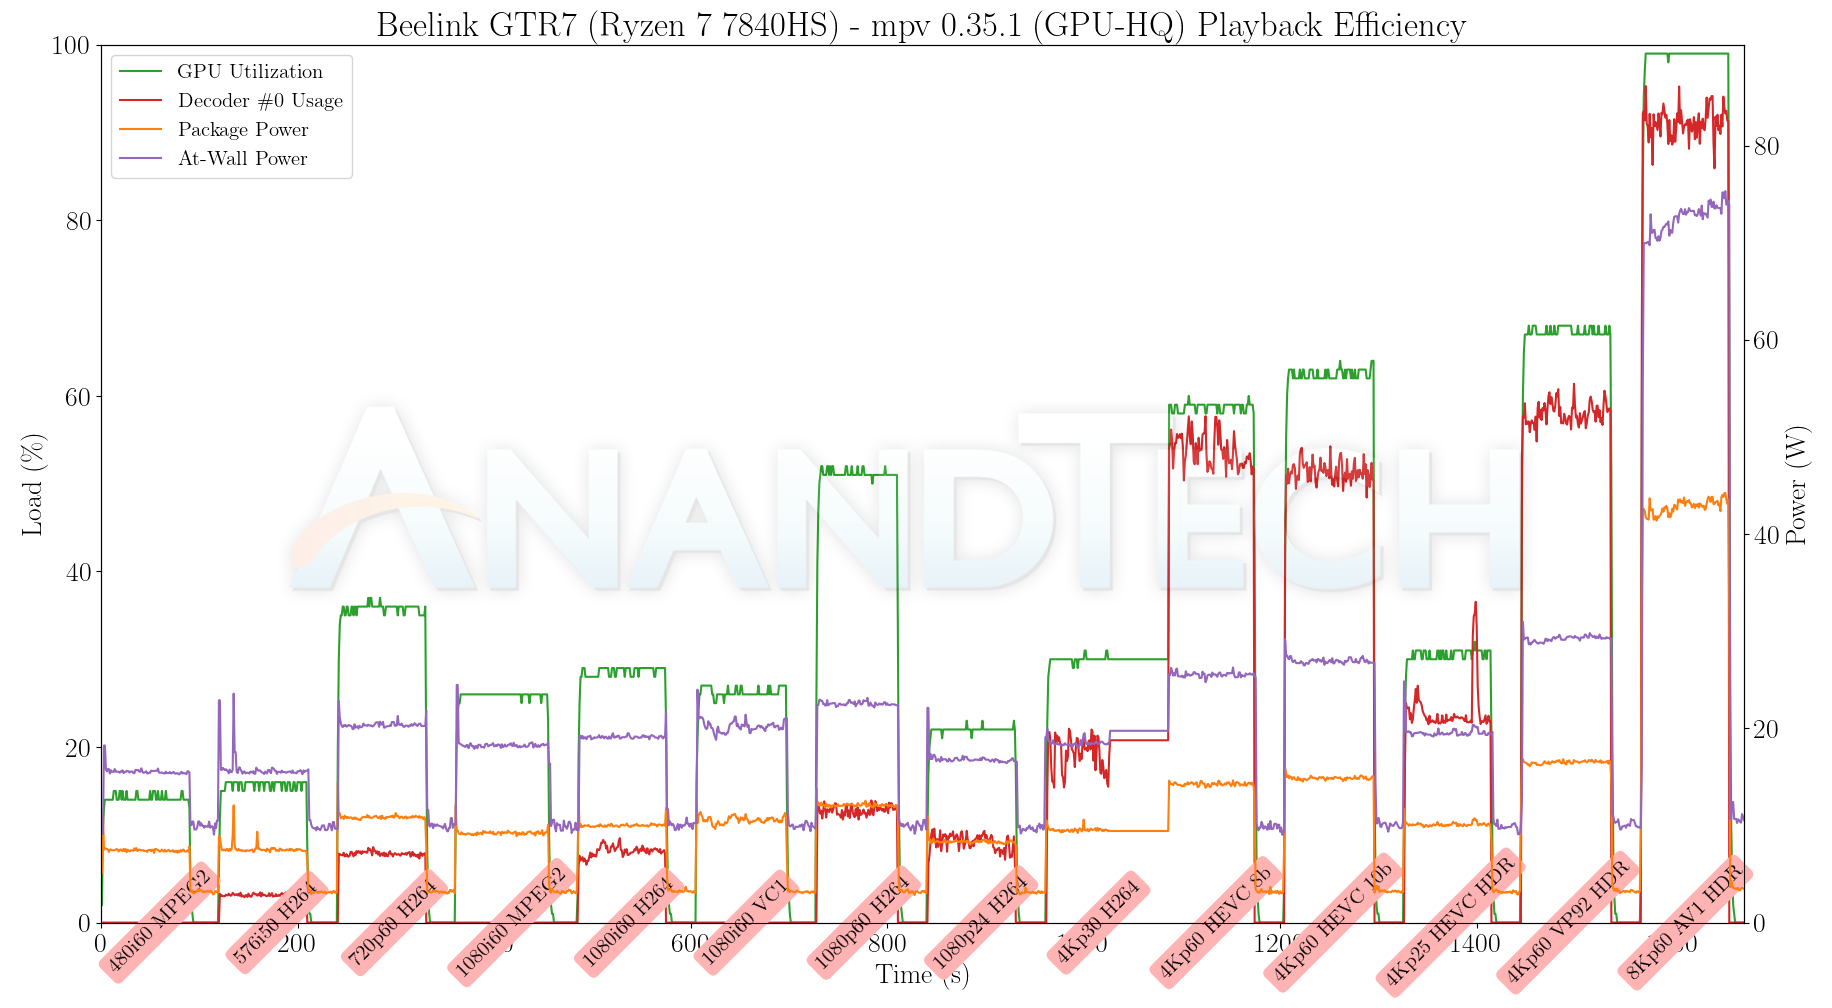
Compared to the default playback profile, the energy consumption numbers are slightly higher for this workload set because of the added shader work and extra GPU loading.
The power consumption at the wall was measured with a 4K display being driven through the HDMI port of the system. In the graph below, we compare the idle and load power of the Beelink GTR7 with other systems evaluated before. For load power consumption, we ran the AIDA64 System Stability Test with various stress components, as well as our custom stress test with Prime95 / Furmark, and noted the peak as well as idling power consumption at the wall.
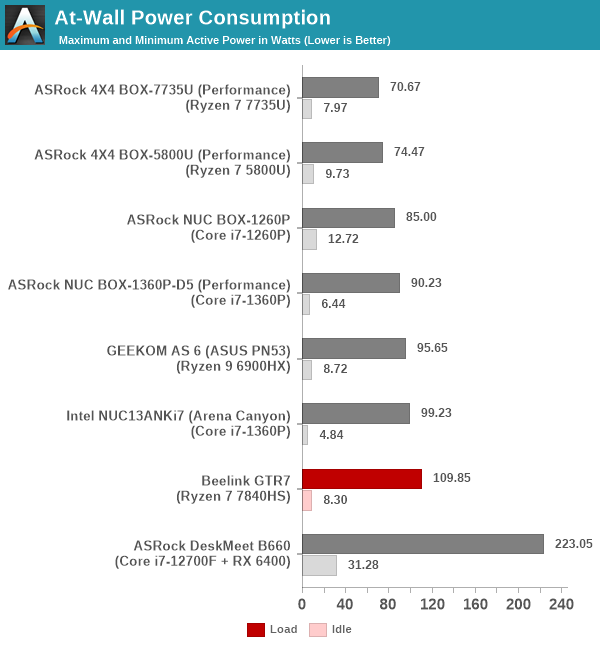
The numbers are consistent with the TDP and suggested PL1 / PL2 values for the processors in the systems, and do not come as any surprise. Idle power consumption of Intel-based systems is very impressive, with the Arena Canyon NUC able to hit a sub-5W number. The GTR7 idles at 8.3W – while this is better than the GEEKOM AS 6, we blieve Beelink can work further to optimize this number. The 110W load number is consistent with the 65W TDP of the Ryzen 7 7840HS.
Stress Testing
Our thermal stress routine is a combination of Prime95, Furmark, and Finalwire’s AIDA64 System Stability Test. The following 9-step sequence is followed, starting with the system at idle:
- Start with the Prime95 stress test configured for maximum power consumption
- After 30 minutes, add Furmark GPU stress workload
- After 30 minutes, terminate the Prime95 workload
- After 30 minutes, terminate the Furmark workload and let the system idle
- After 30 minutes of idling, start the AIDA64 System Stress Test (SST) with CPU, caches, and RAM activated
- After 30 minutes, terminate the previous AIDA64 SST and start a new one with the GPU, CPU, caches, and RAM activated
- After 30 minutes, terminate the previous AIDA64 SST and start a new one with only the GPU activated
- After 30 minutes, terminate the previous AIDA64 SST and start a new one with the CPU, GPU, caches, RAM, and SSD activated
- After 30 minutes, terminate the AIDA64 SST and let the system idle for 30 minutes
Traditionally, this test used to record the clock frequencies – however, with the increasing number of cores in modern processors and fine-grained clock control, frequency information makes the graphs cluttered and doesn’t contribute much to understanding the thermal performance of the system. The focus is now on the power consumption and temperature profiles to determine if throttling is in play.

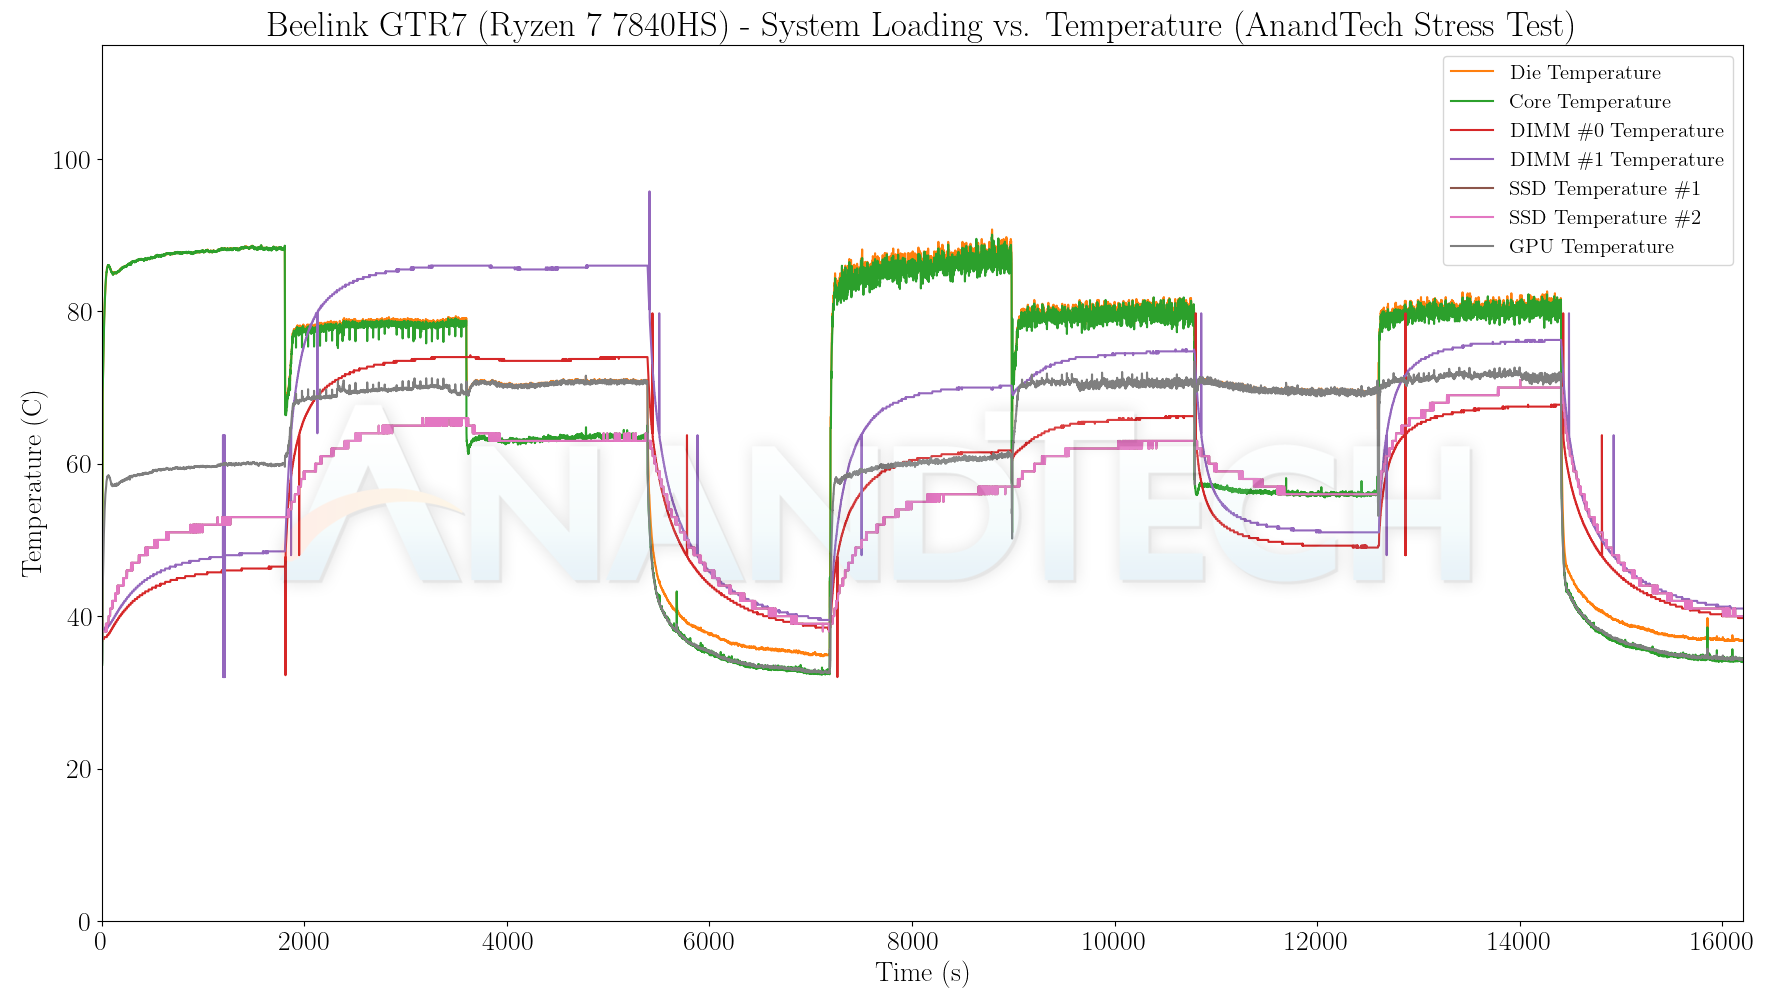
The cTDP of the processor is evident in the reported STAPM power numbers. This ‘skin-temperature aware power management’ number has a slow rise towards the 65W number even as the package power holds steady at 65W. This behavior is unlike what was observed with the Ryzen 9 6900HX in the GEEKOM AS 6 that had a 65W momentary burst, followed by a 54W mode before finally settling at 35W.
The core temperature is kept well south of 90C and the GPU below 75C throughout the process. Once the STAPM reaches 65W, a little bit of throttling takes effect and the package power drops by a watt or so. However, the vapor chamber cooling solution is good enough to keep the package power stable between 64W and 65W.
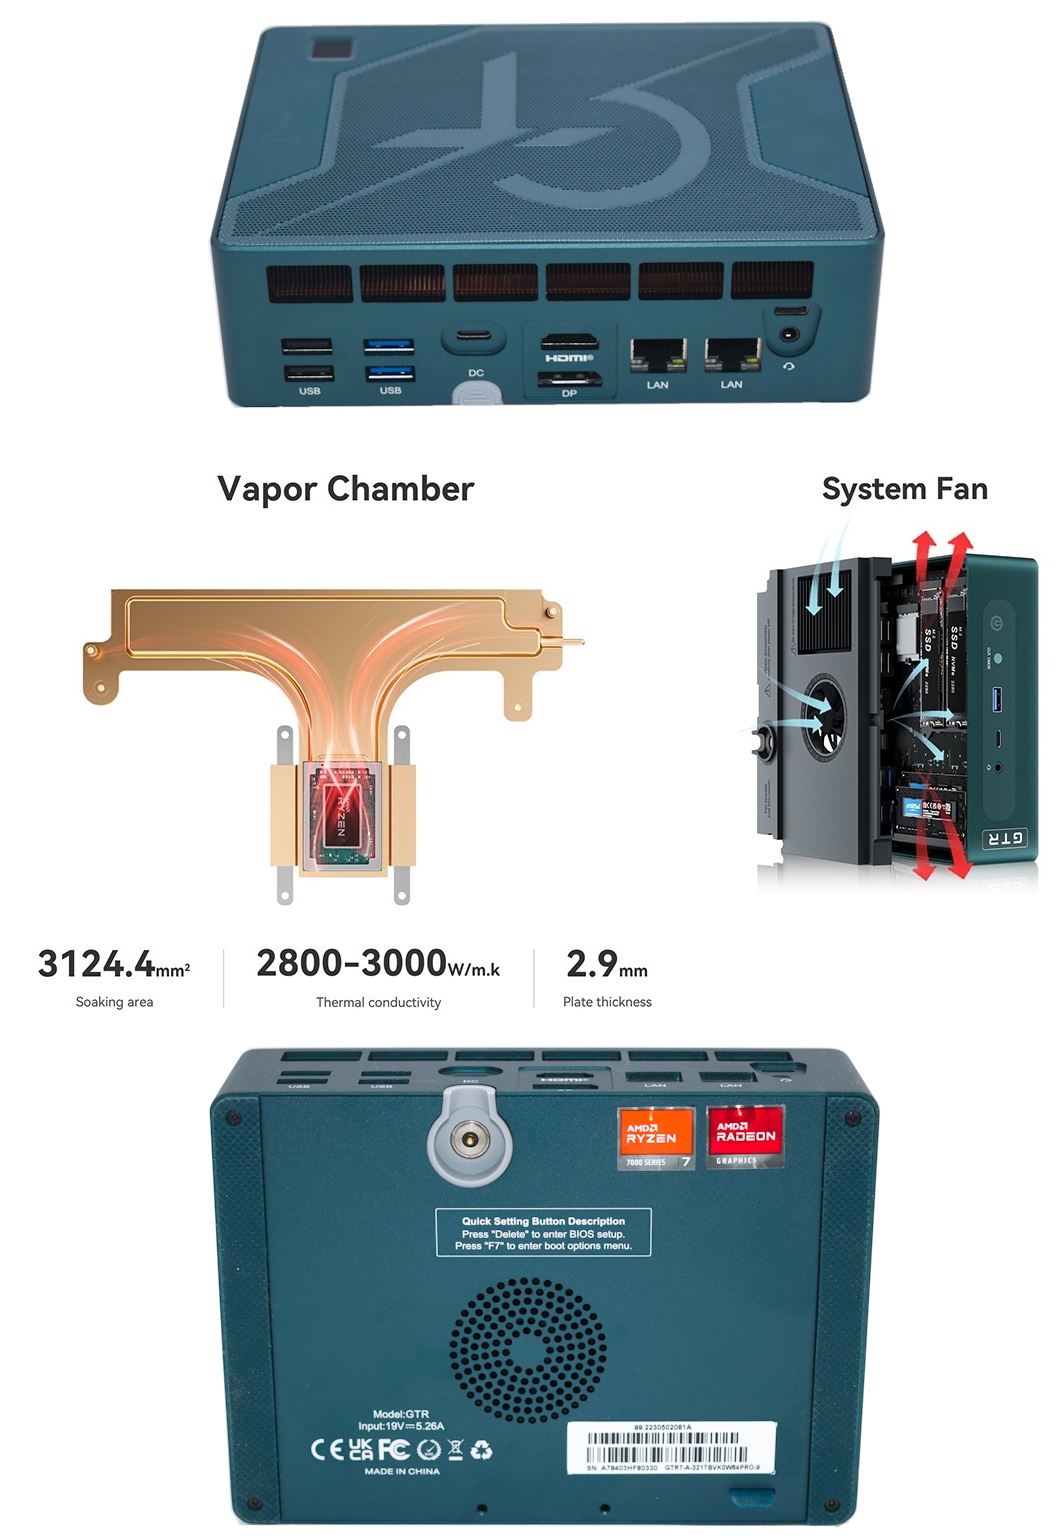
Another unique feature of the Beelink GTR7 is the second fan on the underside (Beelink refers to it as the ‘system fan’). It creates airflow around the SODIMMs and the upper part of the M.2 2280 SSDs. The lower part closer to the connector is handled by thermal pads that transfer heat to a metal heat sink pictured above. In our stress test, this solution contributes to the DIMM temperatures topping out at 70C (max. 80C) for the upper one, and 85C (max. 96C) for the lower one (as it lies sandwiched between the board and the upper SODIMM). The SSD is also appropriately cooled, with maximum temperatures being 71C and 81C at the two measurement points, though the stable numbers appear to be around 65C and 70C. Form-factor limitations mean that this is probably the best that can be done in terms of cooling for these components at the desired price point. Slight tweaks to the form-factor may allow for vertical SODIMM placement with improved airflow to reduce temperatures even further. However, as it stands, the current solution is a satisfactory one for consumer use-cases. 24×7 stressing for the SSDs or DRAM may be more challenging, but that is a problem for all other UCFF systems in the market too.
Networking and storage are aspects that may be of vital importance in specific PC use-cases. The Beelink GTR7 comes with two 2.5 Gbps RJ-45 ports and a 2×2 Wi-Fi 6 WLAN subsystem. This is high-end, considering that many mini-PC manufacturers are still advertising 1 Gbps and Wi-Fi 5 in their units. While 10 Gbps LAN ports would have been nice to have, the USB4 ports with PCIe tunneling support can be of help for such use-cases. Thunderbolt 3 docks and 10G BASE-T adapters can be used with those ports, if required.
On the storage side, Beelink advertises a Gen4 NVMe SSD, and while it is from Crucial (a tier-one vendor), it is unfortunately DRAM-less and QLC-based. The Crucial P3 Plus utilizes Micron’s 176L 3D QLC NAND behind a Phison E21T SSD controller. If I were to recommend a SSD for a mini-PC, a TLC-equipped Gen4 SSD with DRAM would probably be on top of the list. From a benchmarking perspective, we provide results from the WPCstorage test of SPECworkstation 3.1. This benchmark replays access traces from various programs used in different verticals and compares the score against the one obtained with a 2017 SanDisk 512GB SATA SSD in the SPECworkstation 3.1 reference system.
| SPECworkstation 3.1.0 – WPCstorage SPEC Ratio Scores | |||

The graphs above present results for different verticals, as grouped by SPECworkstation 3.1. The storage workload consists of 60 subtests. Access traces from CFD solvers and programs such as Catia, Creo, and Soidworks come under ‘Product Development’. Storage access traces from the NAMD and LAMMPS molecular dynamics simulator are under the ‘Life Sciences’ category. ‘General Operations’ includes access traces from 7-Zip and Mozilla programs. The ‘Energy’ category replays traces from the energy-02 SPECviewperf workload. The ‘Media and Entertainment’ vertical includes Handbrake, Maya, and 3dsmax.
Though we have called out the Crucial P3 Plus in the GTR7 for its QLC NAND, use of 176L flash and a reasonably performant Phison E21T controller means that the GTR7 in the middle of the pack consistently outperforms the Kingston NV2 in the GEEKOM AS 6 (which uses 112L 3D TLC). Other than that, the relative performance numbers in the WPCstorage suite are easily explained – the systems / drives that perform way better than the GTR7 / P3 Plus all utilize high layer-count 3D TLC NAND and are fronted by high-performance SSD controllers using DRAM for the flash translation layer (FTL).
Closing Thoughts
The Beelink GTR7 provided us with the opportunity to evaluate one of the first AMD Phoenix-based mini-PCs. The tweaks to operate the Ryzen 7 7840HS at 65W (even though AMD’s specifications call for the cTDP to be configured between 35W and 54W only) is very welcome. While we received a review sample from one of the early production runs, the company has actually been iterating quite fast even on the hardware front – a new case underside was released as a free upgrade in order to improve the thermal performance for the RAM and SSDs. A newer board iteration has also been released with expanded RAM compatibility. While it is not a matter of big concern for folks who already have a working unit in hand (Beelink doesn’t sell barebones systems), it does help in worry-free RAM capacity upgrades for power users.
Beelink has designed, manufactured, and distributed the GTR7 on their own. As a result, it is easy to see rapid iterations and adoption of feedback. The company has adopted high-end solutions such as vapor chamber-based cooling and this has resulted in the GTR7 becoming a high-end premium system. At the same time, the company has paid attention to things often ignored by other vendors – a focus on creating a thermal solution for the RAM and the SSDs, incorporating a flexible flap into the underside to make its removal easier, etc.
Like the Rembrandt-R systems, Phoenix-based ones like the GTR7 retain the dual USB4 ports functionality with full 40 Gbps support. However, neither USB4 port supports the USB 3.2 Gen 2×2 (20 Gbps) mode and that feature seems to be restricted to a few RPL-P systems for now. The GTR7 puts a 10 Gbps Type-C port (data only) in front, and two 40 Gbps USB4 Type-C ports in the rear. We would have liked one of the USB4 ports to be in the front panel. The casing could also do with added markings near the ports to indicate the functionality. While the USB 2.0 Type-A ports are easily differentiated from the USB 3.2 Gen 2 Type-A ports due to the color coding, the same can’t be said of the Type-C ports.
The system comes with a reasonably small wall wart for the 120W power adapter. Utilizing USB-C PD with its newer 140W and 240W power levels would have resulted in a more user-friendly solution. While the implemented magnetic power connector is nice and secure, it is proprietary in nature. Folks dealing with a large number of systems appreciate the ability to swap adapters across different units. For regular users, it is easier to find replacements for standard power adapters. Going the USB-C PD route would be a win-win for both Beelink and the consumer. As a value-add, Beelink could create a compact USB4 dock / hub that could act as a power adapter as well as a port extender for those who desire it. Other users could use a standard USB-C PD adapter.

Beelink GTR7 – Physical Footprint (compared to a regular soda can and a half-height mainstream Intel NUC)
Other aspects that could do with some improvement include the behavior of certain settings for some of the BIOS options. For example, configuring the UMA buffer size for the VRAM to ‘Auto’ sets it to 32MB. Windows is unable to present a 4K UI as a result, and the desktop resolution remains fixed at 1080p. With a similar ‘Auto’ setting, the GEEKOM AS 6 allocates 512MB at startup and allows the iGPU to behave normally. Thankfully, the default setting for the GTR7’s UMA Buffer Size is 4GB.
The presence of audio jacks in both the front and the rear panel addresses a minor inconvenience faced by a small subset of PC users. It is a welcome feature that would be more beneficial if users were allowed to select the active connection in case both jacks are connected to audio sinks. The absence of Wi-Fi 6E is puzzling, given that all other features of the GTR7 are high-end in nature.
The value proposition of the Beelink GTR7 needs to be discussed after taking pricing into account. The Beelink GTR7 with the Ryzen 7 7840HS, 1TB Crucial P3 Plus SSD, 2x 16 GB Crucial DDR5-5600 RAM, and Windows 11 Pro OS is priced at $709 ($789 with $80 off using coupon code GTR780). This is the same as the GEEKOM AS 6 with similar build components, but for a newer processor and better connectivity (in terms of USB and LAN ports). At this price point, the GTR7 is a no-brainer, with the only tempering aspect being the newness of the platform. The first stable drivers for the product were released by AMD in late July, and Beelink themselves have been iterating on the hardware over the last couple of months.
Traditionally, buying from no-name brands or upstarts like Beelink – particularly from their own storefronts – at ‘too good to be true’ prices is fraught with risk. However, the company seems to give that impression only because they are new to the distribution and support challenges. With their OEM history, the R&D and components quality are not a major concern. Beelink also sells their PCs on Amazon, but with Phoenix SoCs in high demand, the GTR7 listing is currently only on Beelink’s own site. That said, we are starting to see more Phoenix-based mini-PCs in the market from the likes of SimplyNUC (Moonstone), Morefine (M600), and MinisForum (UM790 Pro). Compared to these UCFF systems, the Beelink GTR7 seems to have an edge by operating the Phoenix SoC with a higher cTDP configuration and incorporating better connectivity. The company has achieved this with minimal physical footprint penalty. Overall, the Beelink GTR7 gets our recommendation for power users who don’t mind the risks associated with a cutting-edge platform.