ASRock Industrial NUC BOX-N97 and GMKtec NucBox G2 Review: Contrasting Compact ADL-N Options
2023-10-06Intel introduced a separate microarchitecture for low-power / low-cost x86 systems in the 2008 Silverthorne Atom processors. Variation of the microarchitecture in different product families has since helped the company to span a wider performance / power efficiency range. From 2008 to 2020, each product family opted for either the Atom-class microarchitecture or the Core-class one. However, the introduction of hybrid CPUs (starting with the short-lived Lakefield) saw the placement of cores based on both microarchitectures in the same die. The Tremont microarchitecture (developed as part of the Atom-family) made its debut in Lakefield before gaining wider market presence through Jasper Lake and Elkhart Lake. Its successor (Gracemont) is adopting a similar trajectory. After its introduction in Alder Lake (ADL), it underwent further refinement in Raptor Lake (RPL). The hybrid processors in these two families teamed up the Gracemont efficiency cores with the Golden Cove (ADL) / Raptor Cove (RPL) performance cores. Eventually, Intel released a new line of processors under the ‘Alder Lake-N’ (ADL-N) tag comprising only the Gracemont cores, a pared-down integrated GPU, and premium connectivity options removed. As a replacement for the Tremont-based Jasper Lake SoCs, ADL-N has found its way into a variety of entry-level computing systems including notebooks and compact desktops.
ASRock Industrial’s lineup of ultra-compact form-factor (UCFF) systems – the Intel-based NUC BOX series and AMD-based 4X4 BOX series – has enjoyed significant market success, allowing the company to regularly introduce products based on the latest Intel and AMD offerings. At the same time, the expanding market for compact computing systems has also brought many Asian companies such as ACEMAGIC, Beelink, GEEKOM, GMKtec, and MinisForum into play. These vendors are essentially brands for OEMs / ODMs with experience in product design and manufacturing experience. The rise of e-commerce has allowed them to find an outlet for their product designs via direct-to-consumer sales.
As ADL-N ramps up, we are seeing a flood of low-cost compact desktop systems based on it from multiple vendors. We took advantage of this opportunity to source two contrasting ADL-N mini-PCs – the ASRock Industrial NUC BOX-N97 and the GMKtec NucBox G2. Though both systems utilize a quad-core ADL-N SoC, the feature set and target markets are very different. The review below provides a detailed analysis of the system features, build, performance profile, and value proposition of the NUC BOX-N97 and the NucBox G2.
Rapid strides have been made in CPU performance and power efficiency over the last decade. This has resulted in compact systems equipped with sub-15W TDP SoCs becoming powerful enough to replace bulky desktops for many use-cases. This trend gained mainstream attention with Intel’s introduction of the ultra-compact form-factor (4in. x 4in.) NUC in the early 2010s. The 4×4 form-factor continues to hold sway even today, as evidenced by the variety of UCFF systems introduced by multiple vendors every year. The ASRock Industrial NUC BOX-N97 we are looking at in this review utilizes the tried and tested 4×4 form-factor.
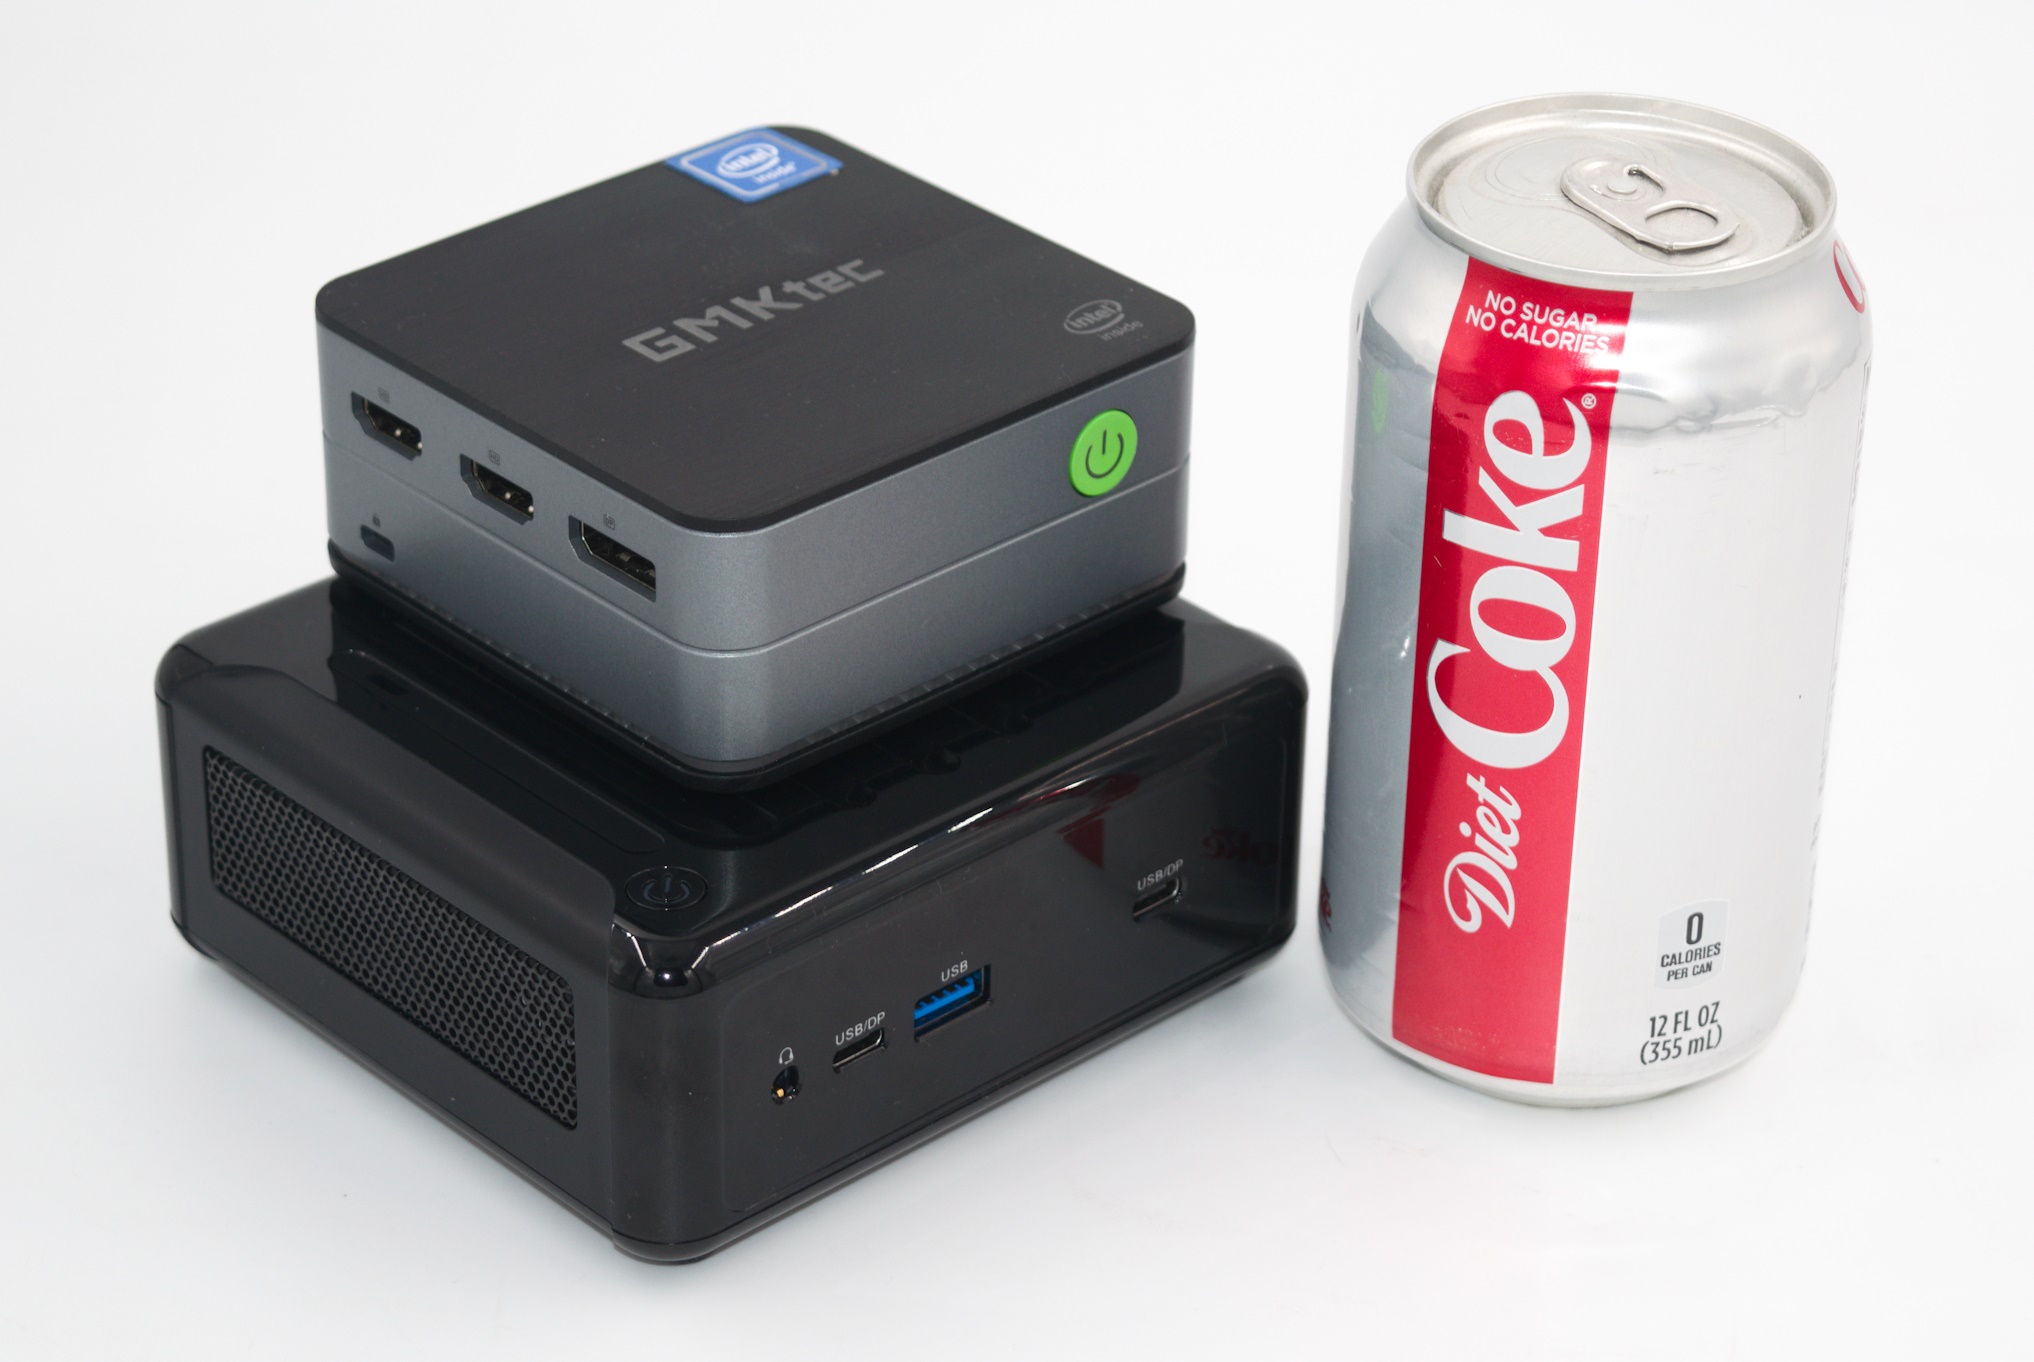
The 4×4 form-factor was chosen in order to be able to accommodate a 2.5″ disk drives and SODIMM kits. Since that time, both storage and memory technologies have evolved significantly. High-capacity M.2 2242 / 2230 SSDs are becoming common, and soldered RAM is not being met with as much derision as before. These have contributed to some vendors introducing micro-PCs with a sub-4×4 footprint. The second system evaluated as part of this review, GMKtec’s NucBox G2, is one such micro-PC measuring 3.4 in x 3.4 in.
ASRock Industrial NUC BOX-N97
ASRock Industrial has been serving the industrial systems market with compact boards and mini-PCs since the days of Intel Skylake (6th Gen) / Braswell. Having taken over ASRock’s Beebox design, the company’s product releases in this category have had a regular cadence.
The company has been maintaining a line of actively-cooled 4in. x 4in. NUC BOX systems based on Intel’s low power microarchitecture. In the Tremont era, the company introduced the Elkhart Lake-based NUC BOX-J6412. This was the successor of the NUC BOX-3xx0 based on the Braswell SoCs. The NUC BOX-N97 is the company’s latest product in the lineup. This Gracemont version utilizes the ADL-N Intel Processor N97. Similar to other products in the NUC BOX line, the system if offered as a barebone, with the ability to accommodate a single DDR4-3200 SODIMM and either a 2.5″ SATA drive or a M.2 2280 SATA / NVMe SSD.
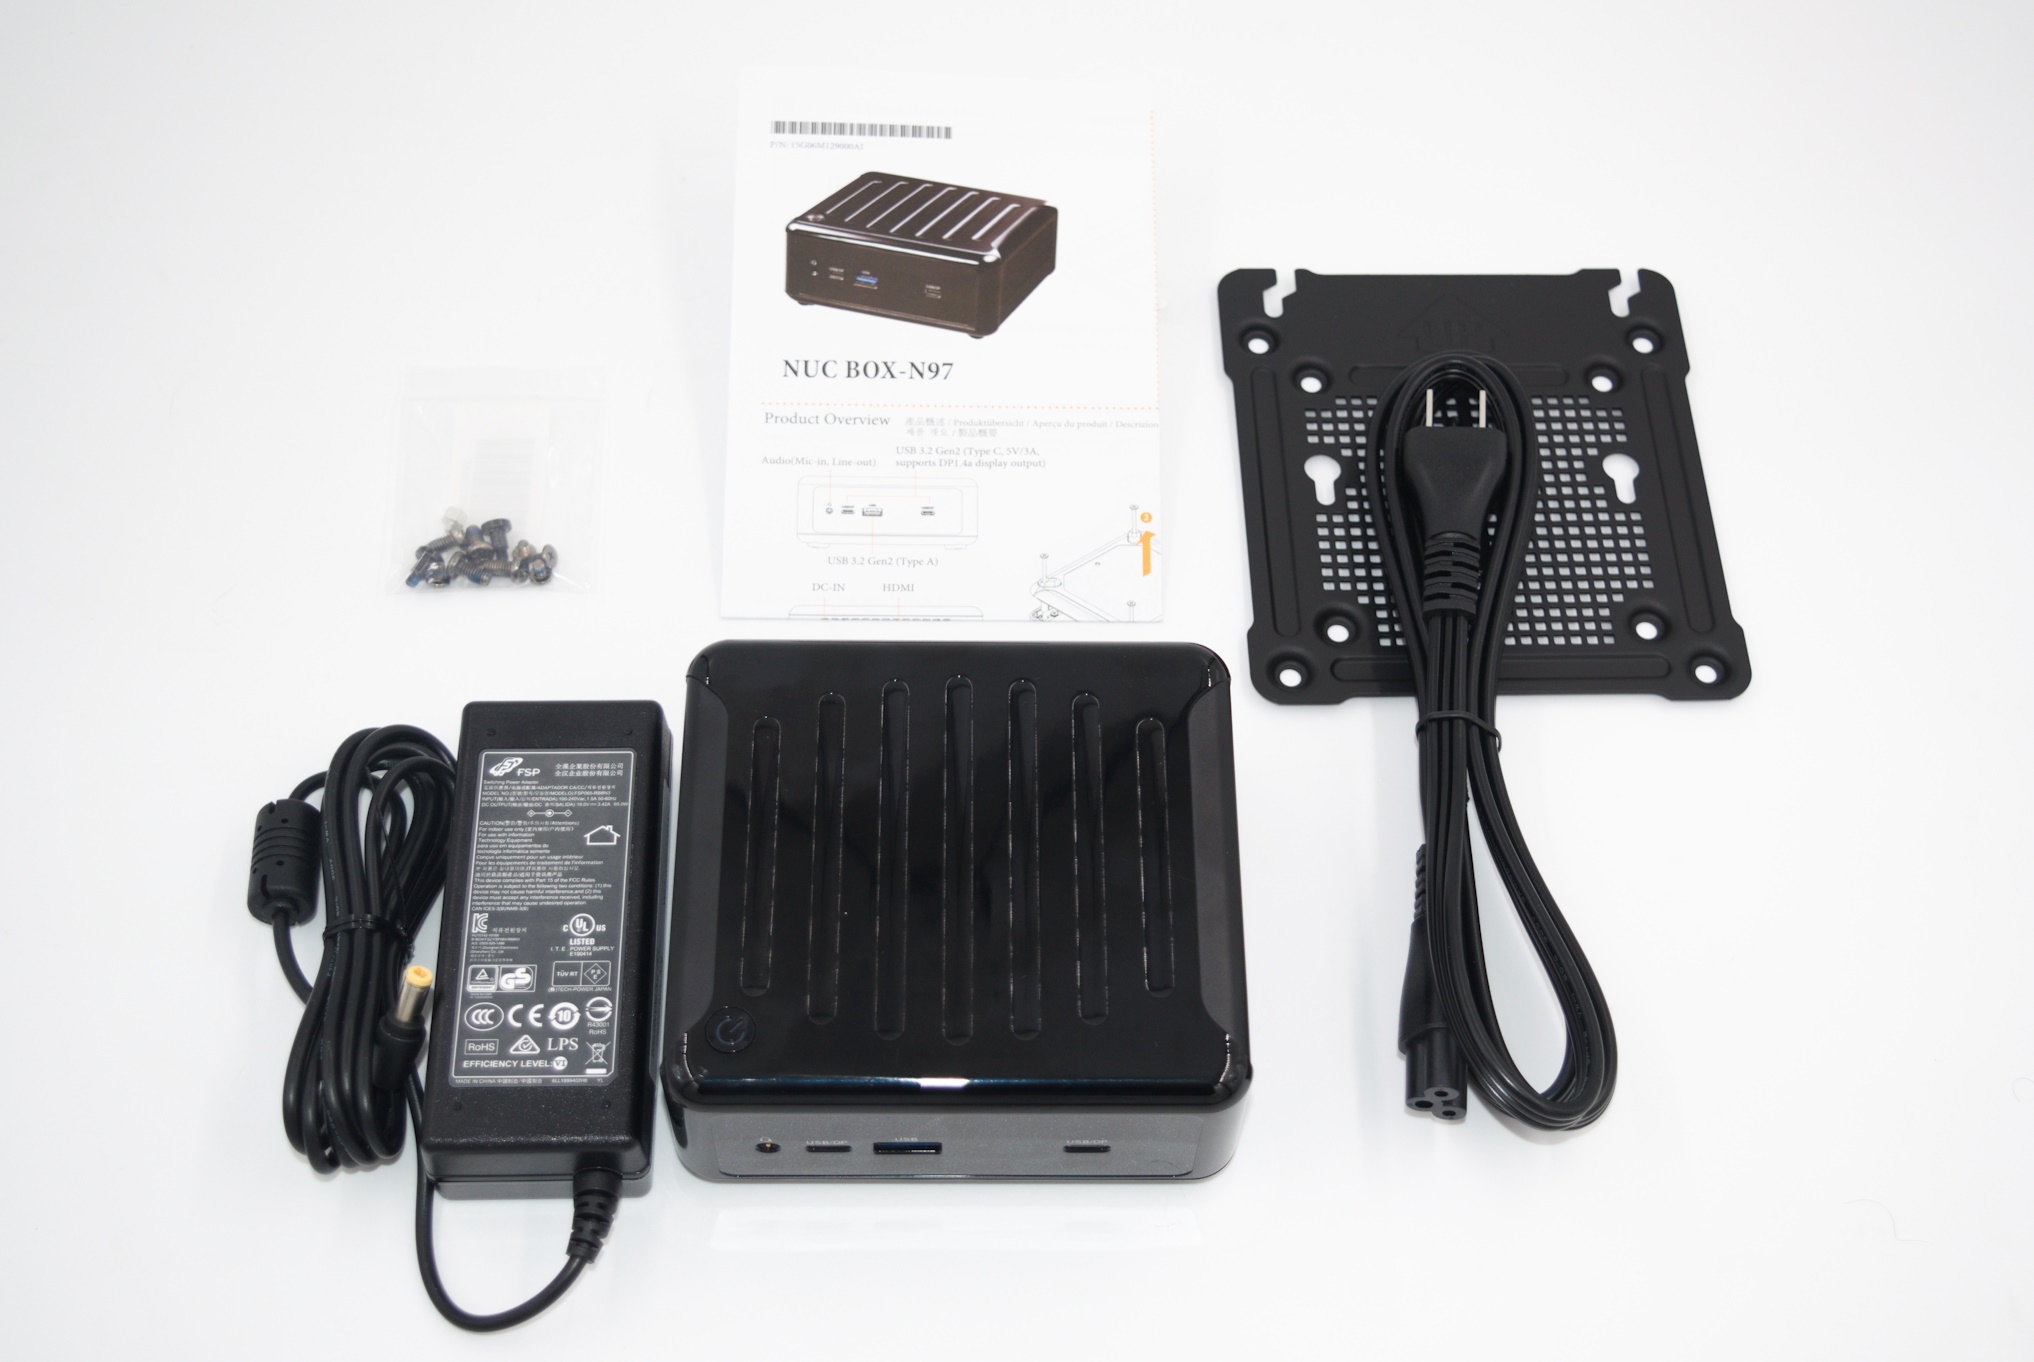
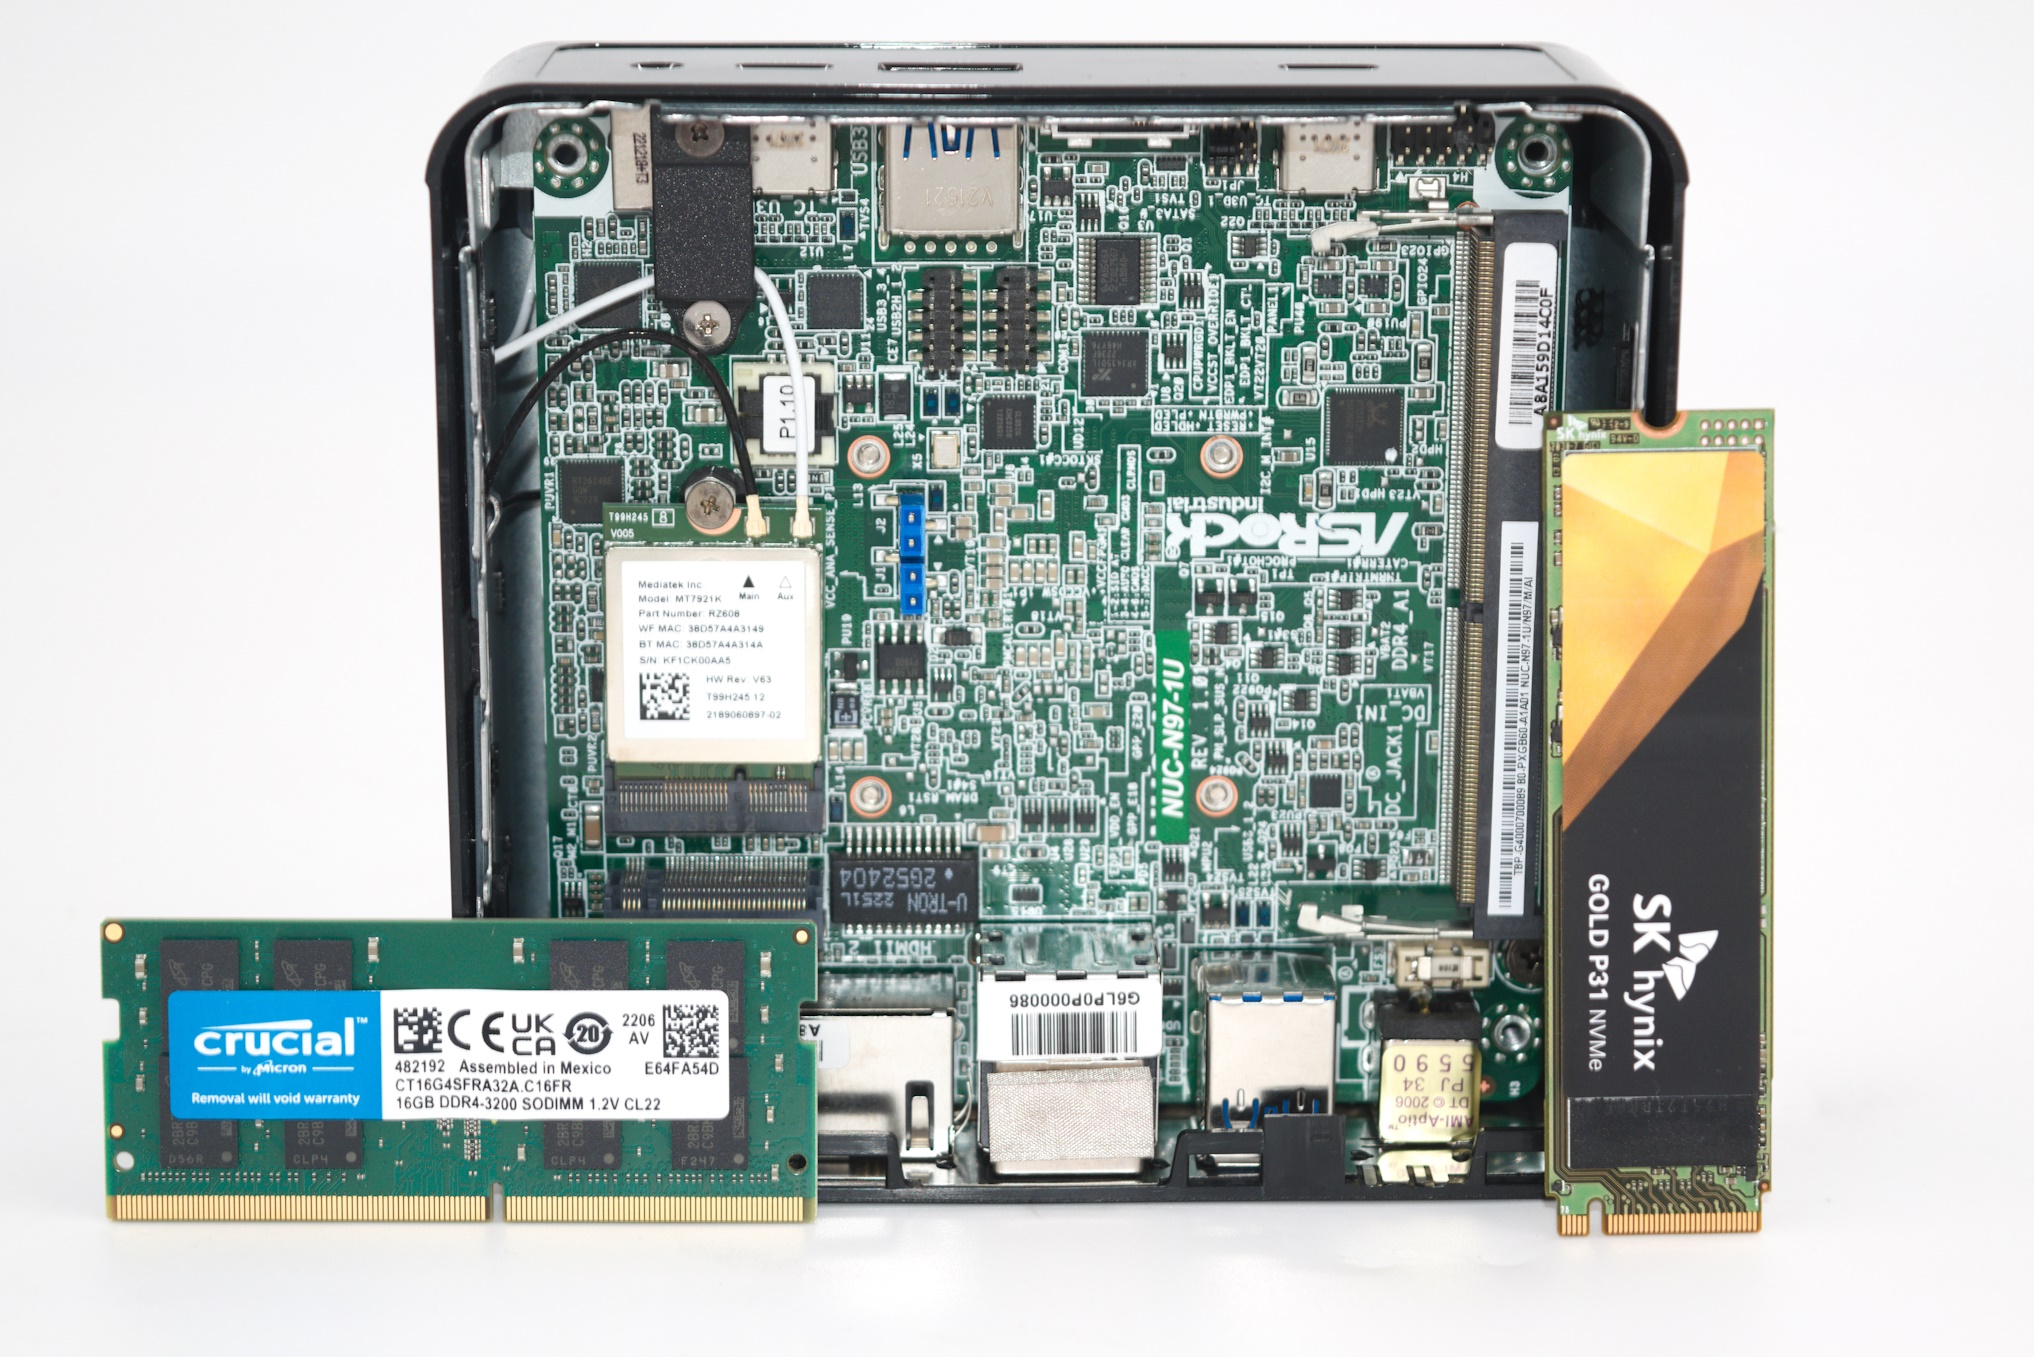
In addition to the main unit, the NUC BOX-N97 package comes with a VESA mount and corresponding screws, and a 65W (19V @ 3.42A) power adapter. A geo-specific power cord is supplied along with a product overview / installation brochure. The gallery below provides a comprehensive look at the chassis design and I/O ports placement. The space for the 2.5″ drive is on the underside of the unit (the one that needs to be separated out in order to install the RAM and disk drive). The SATA cable is affixed to the underside, as shown in one of the gallery pictures.


We opted to install a 16 GB Crucial DDR4-3200 CL 22 SODIMM in the system along with a SK hynix Gold P31 NVMe SSD. It must be noted that the M.2 slot accepts both SATA and NVMe SSDs, with the latter operating at PCIe 3.0 x1.
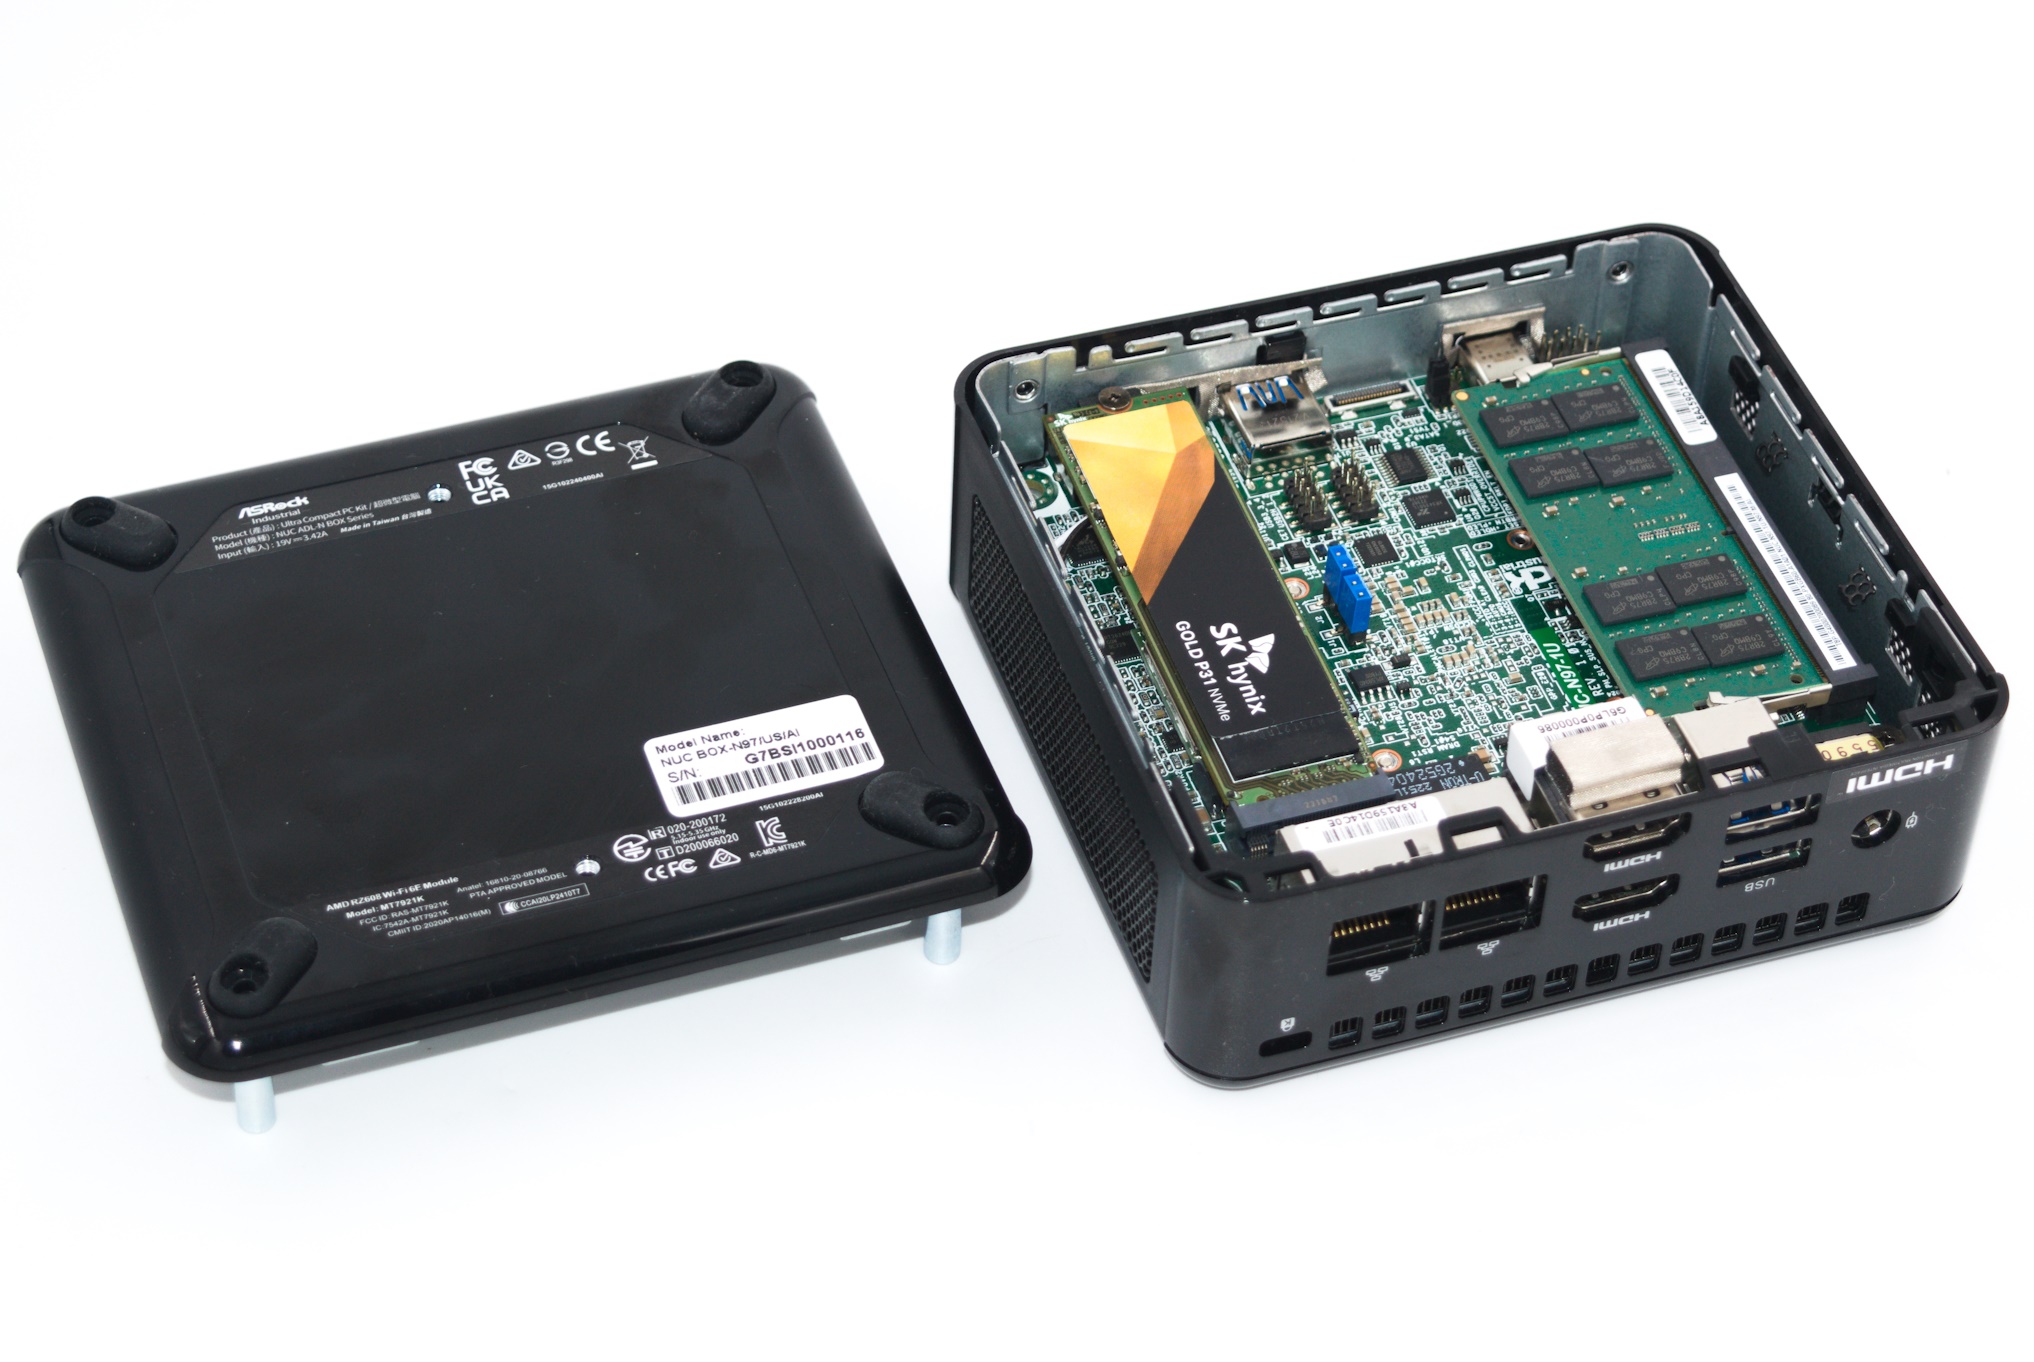
Every NUC BOX system reviewed before had been equipped with dual SODIMM slots. The NUC BOX-N97 has only one slot, though (as the ADL-N SoCs have only a single memory channel). Except for the DRAM slot, the rest of the NUC BOX-N97’s internals are very similar to the other NUC BOX systems reviewed before. The system uses a notebook-style cooler. There are no bells and whistles, and the chassis design and thermal solution are tried and tested versions.
GMKtec NucBox G2
The GMKtec’s NucBox G2 is the company’s follow-up to the still-active Jasper Lake-based NucBox 7. This micro-PC family adopts the ports-all-around scheme that we already saw in last week’s review of the ACEMAGIC T8 Plus. Like the ACEMAGIC system, the NucBox G2 also comes with soldered LPDDR5 RAM. A semblance of upgradability is maintained, thanks to the use of a M.2 2242 SATA SSD. The system is not available as a barebone kit. Our review configuration came with 12 GB of LPDDR5-4800 RAM and a 1 TB SATA SSD with Windows 11 Pro pre-installed.
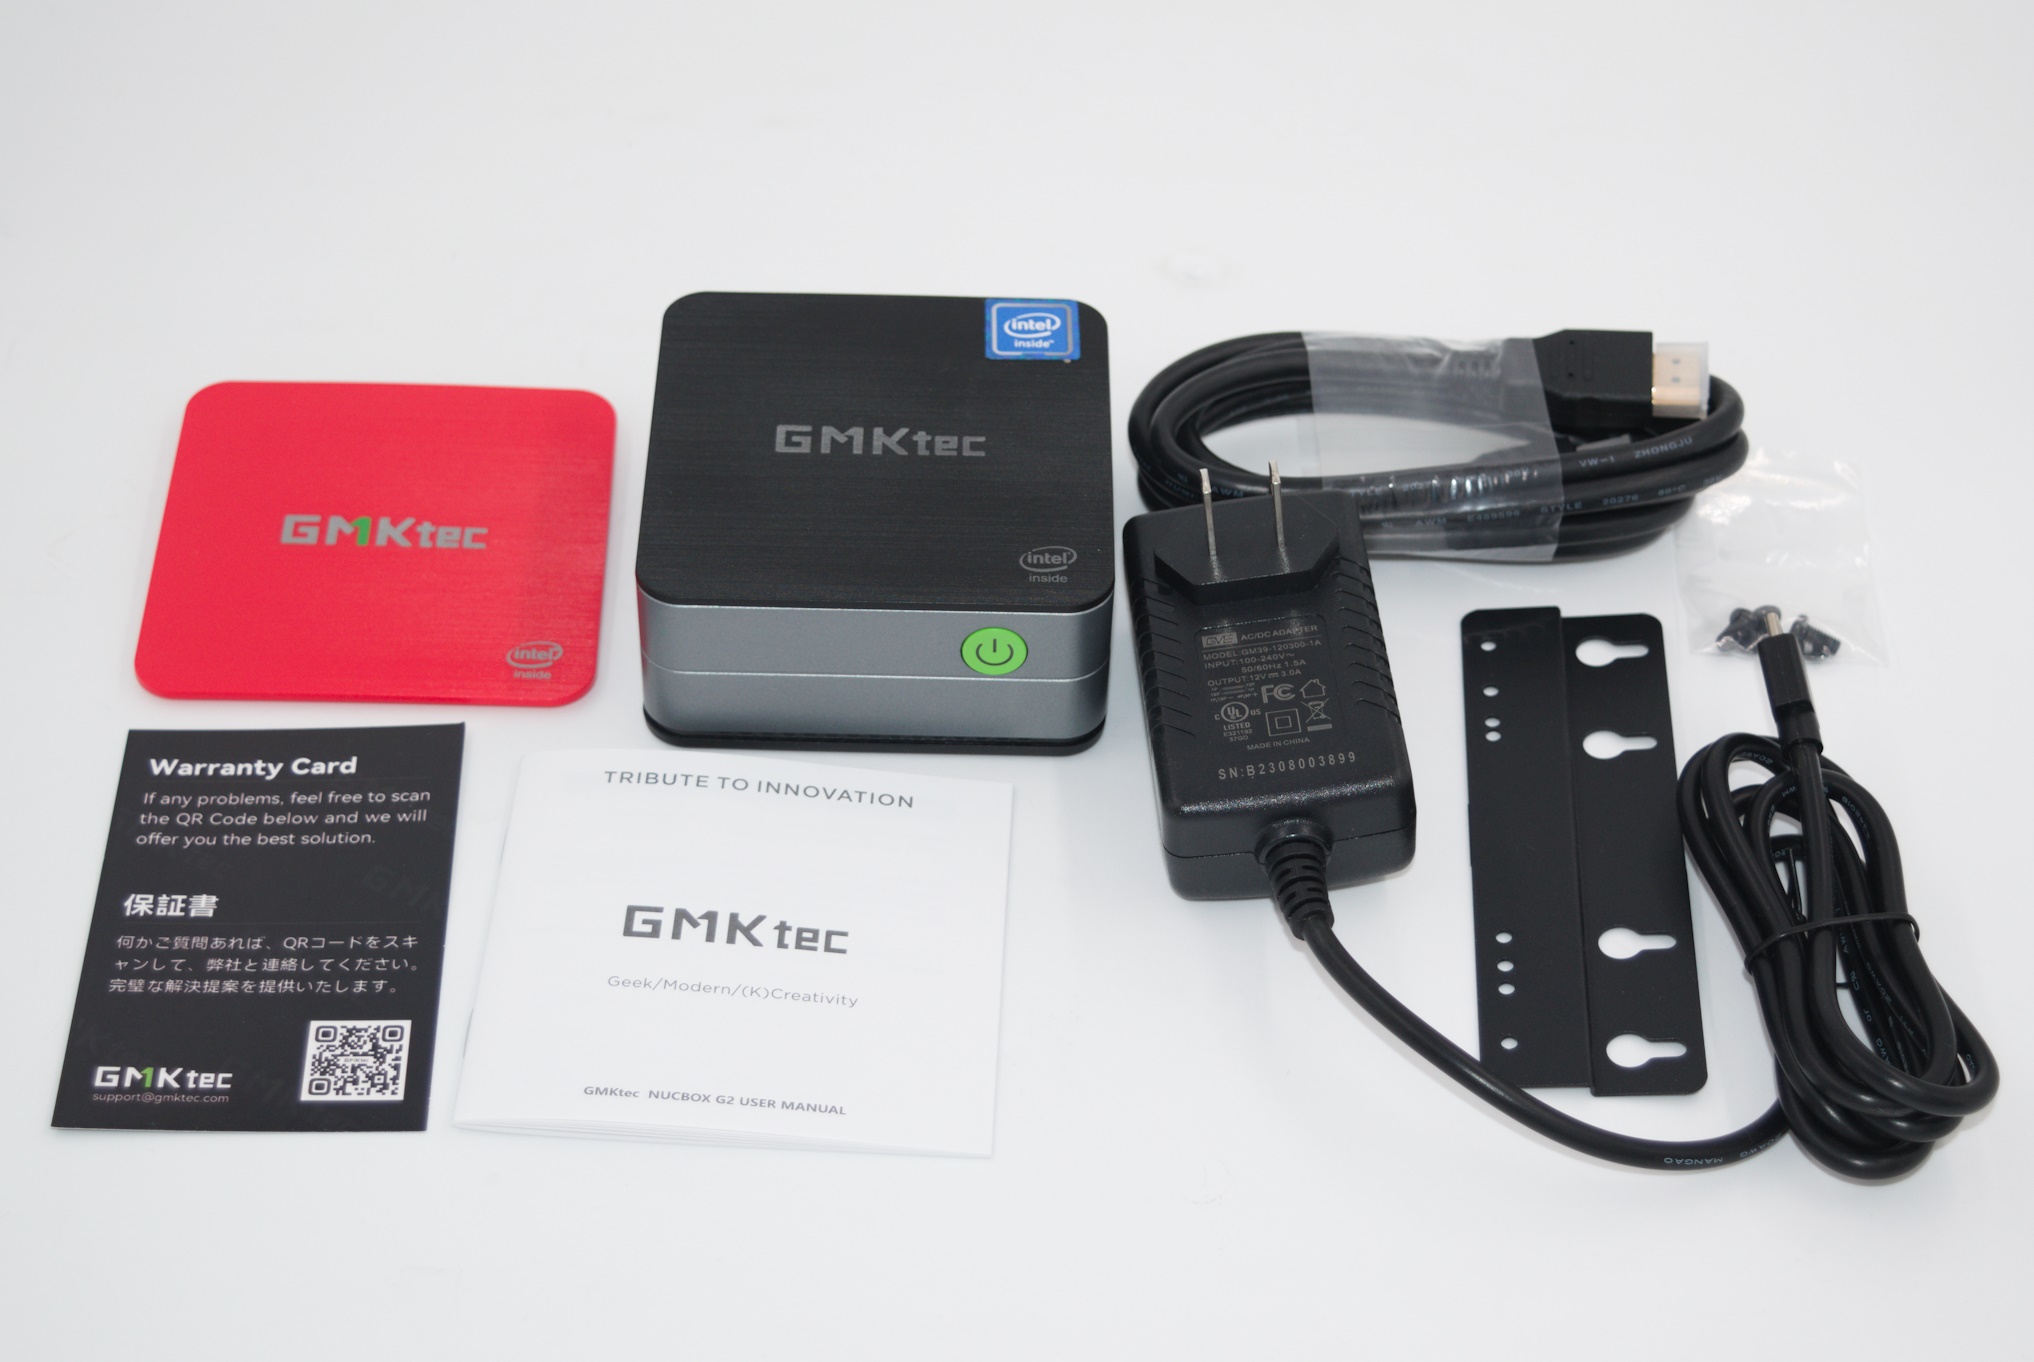
In addition to the main unit, the NucBox G2 package comes with a HDMI cable, wall mount with associated screws, an user manual, a warranty card, and a 36W (12V @ 3A) geo-specific wall wart with a Type-C output. Unfortunately, this is a non-conforming USB Type-C application, and the wall wart can’t be used reliably with other devices conforming to USB-PD sink standards. The adapter can only be used with the Type-C power input-only port of the NucBox G2. The top part of the main unit can be pried off easily to expose the M.2 2242 SATA SSD slot. GMKtec also offers an alternative colored top panel. Teardown pictures are provided in the gallery below along with a look at the placement of various I/O ports.


The teardown pictures show the M.2 SATA SSD surrounded by a plastic frame on which the WLAN antenna are mounted. Unscrewing the underside reveals a LED lighting base connected to the main board with a ribbon connector. A small notebook-style fan is also visible along with the associated copper heat spreader. The LED lighting base has open vents allowing the fan to suck in air and blow it out over the heat spreader fins. Taking off the heat sink and fan reveals the ADL-N package and a single DRAM package that incorporates four 24 Gbit Micron dice.
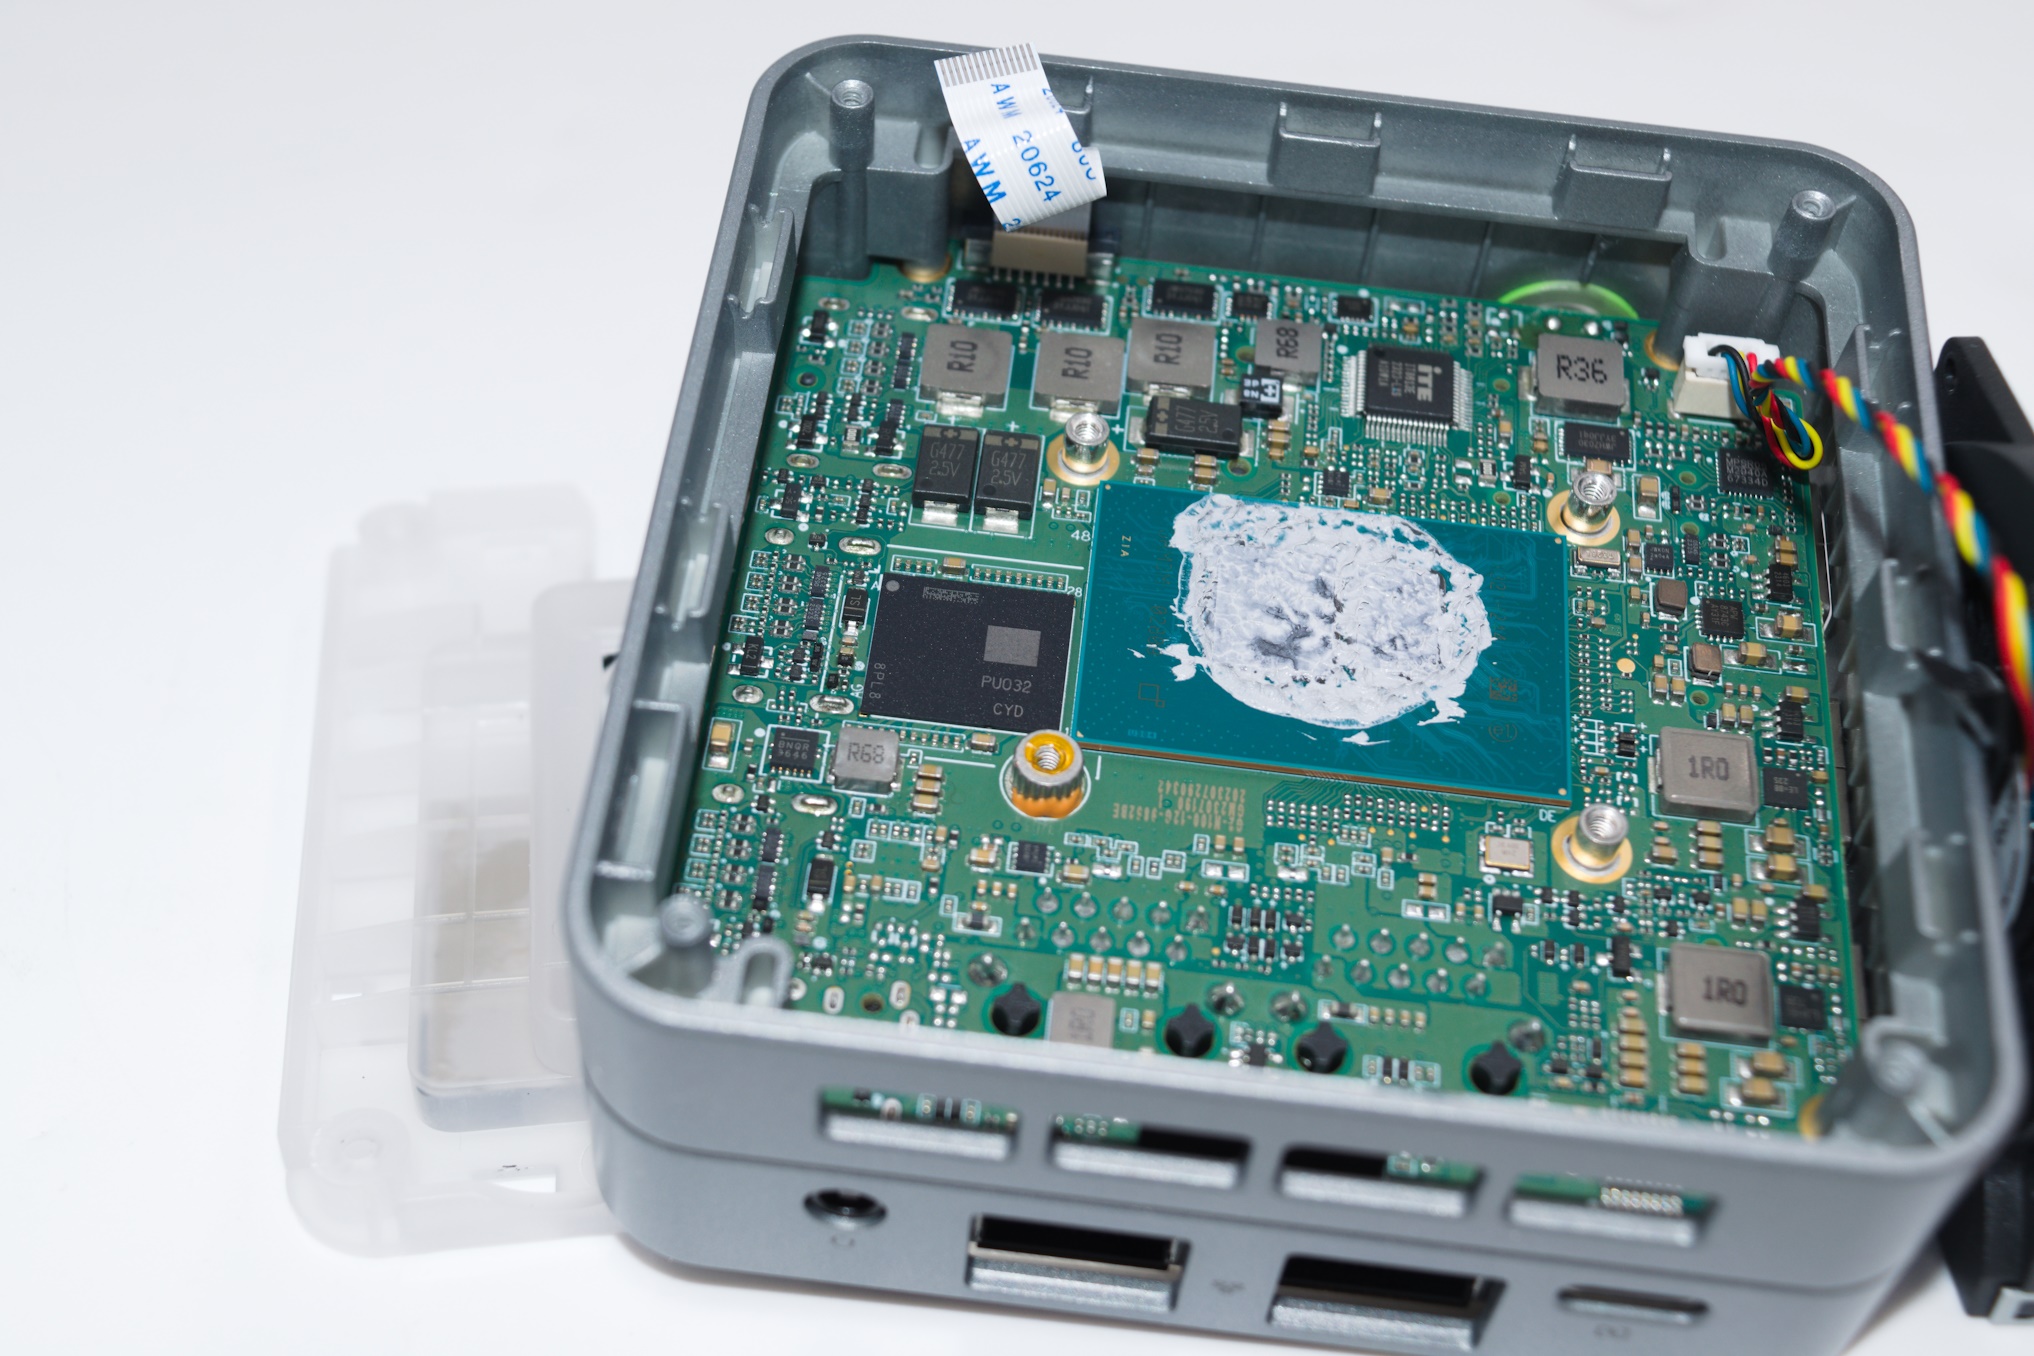
12 GB LPDDR5-4800 Package Adjacent to the Thermal Paste-Laden ADL-N Package
The soldered RAM is not user-upgradeable. However, the M.2 2230 slot for the WLAN component is accessible under the M.2 SATA SSD slot. The pre-installed SSD is from FuturePath, and seems to have the same SSD controller manufacturer as the FPT310 SSD seen in the ACEMAGIC T8 Plus review.
The NucBox G2 came with Windows Pro OS pre-installed, but we had to wipe it and install Windows 11 Enterprise to keep the testing environment consistent across different systems. The full specifications of the two review samples (as tested) are summarized in the table below.
| Systems Specifications (as tested) |
||
| ASRock NUC BOX-N97 | GMKtec NucBox G2 | |
| Processor | Intel Processor N97 Alder Lake-N 4C/4T, up to 3.6 GHz Intel 7, 6MB L3, 12W (PL1 = 12W / PL2 = 25W) |
Intel Processor N100 Alder Lake-N 4C/4T, up to 3.4 GHz Intel 7, 6MB L3, 6W (PL1 = 10W / PL2 = 25W) |
| Memory | Crucial CT16G4SFRA32A.C16FR DDR4-3200 SODIMM 22-22-22-52 @ 3200 MHz 1×16 GB |
Micron LPDDR5-4800 (Single-Channel / 4 x16) 52-44-44-104 @ 4800 MHz 12 GB |
| Graphics | Intel UHD Graphics (24EU @ 1200 MHz) |
Intel UHD Graphics (24EU @ 750 MHz) |
| Disk Drive(s) | SK hynix Gold P31 SHGP31-1000GM-2 (1 TB; M.2 2280 PCIe 3.0 x4 NVMe SSD, operating at x1) (SK hynix 128L 4D TLC; SK hynix Cepheus ACNT038 Controller) |
Futurepath S4GXH02TV6A01T0 (1 TB; M.2 2242 SATA III 6 Gbps) (?? NAND; ?? Controller) |
| Networking | 2x 2.5 GbE RJ-45 (Realtek RTL8125) Mediatek MT7921K (RZ608) Wi-Fi 6E (2×2 802.11ax – 1.2 Gbps) |
2x GbE RJ-45 (Realtek RTL8168/8111) Realtek RTL8852BE Wi-Fi 6 / Bluetooth 5 (2×2 802.11ax – 1.2 Gbps) |
| Audio | Realtek ALC256 (3.5mm Audio Jack in Front) Digital Audio with Bitstreaming Support over HDMI and Type-C (Alt DP) Ports |
3.5mm Audio Jack Digital audio and bitstreaming support over HDMI Outputs |
| Video | 2x HDMI 2.0b 2x Display Port 1.4a over Type-C Alt-Mode (up to 3 simultaneous 4096×2160 @ 60 Hz displays) |
2x HDMI 2.0b (up to 4Kp60) 1x DisplayPort 1.4a (up to 4Kp60) |
| Miscellaneous I/O Ports | 2x USB 3.2 Gen 2 Type-C w/ Alt DP Support (Front) 1x USB 3.2 Gen 2 Type-A (Front) 2x USB 3.2 Gen 2 Type-A (Rear) |
3x USB 3.2 Gen 2 (10 Gbps) Type-A |
| Operating System | Windows 11 Enterprise (22000.2416) | Windows 11 Enterprise (22000.2360) |
| Pricing | (Street Pricing on Oct 05th, 2023) US $260 (barebones) US $353 (as configured, no OS) |
(Street Pricing on Oct 5st, 2023) US $230 (as configured, w/OS) |
| Full Specifications | ASRock Industrial NUC BOX-N97 Specifications | GMKtec NucBox G2 Specifications |
In the next section, we take a look at the system setup and follow it up with a detailed platform analysis.
Prior to setting up the OS on the ASRock Industrial NUC BOX-N97, we took some time to look into the BIOS interface. As is typical for systems targeting the industrial market, the main BIOS interface is a vanilla one. It does provide plenty of configuration options. The video below presents the entire gamut of available options.
The key aspect standing out in the above video is the presence of the ‘In-Band ECC’ option. Though disabled by default, we were able to enable it and observe its effects (hardware reservation of 1/32 of the memory capacity, as well as MemTest86 hang during memory testing of a known faulty SODIMM instead of reporting errors). We confirmed with ASRock Industrial that this option would not be removed in a future BIOS version (like what was done for the NUCS BOX-1360P/D4). Apparently, Intel has decided to allow In-Band ECC as an official feature of the Intel Processor N97.
The BIOS interface of the GMKtec G2 exposes many additional options to play around with, as shown in the video below.
The BIOS allows control over power limits and time windows as well as the fan curves. It also enables configuration of the LED board attached to the base. Various color options are available under ‘Boot > LED Colour Settings’.
The evaluation of both systems was done with default UEFI settings.
The I/O capabilities of the ADL-N SoC family are brought out in this slide from the launch deck provided by Intel earlier this year.
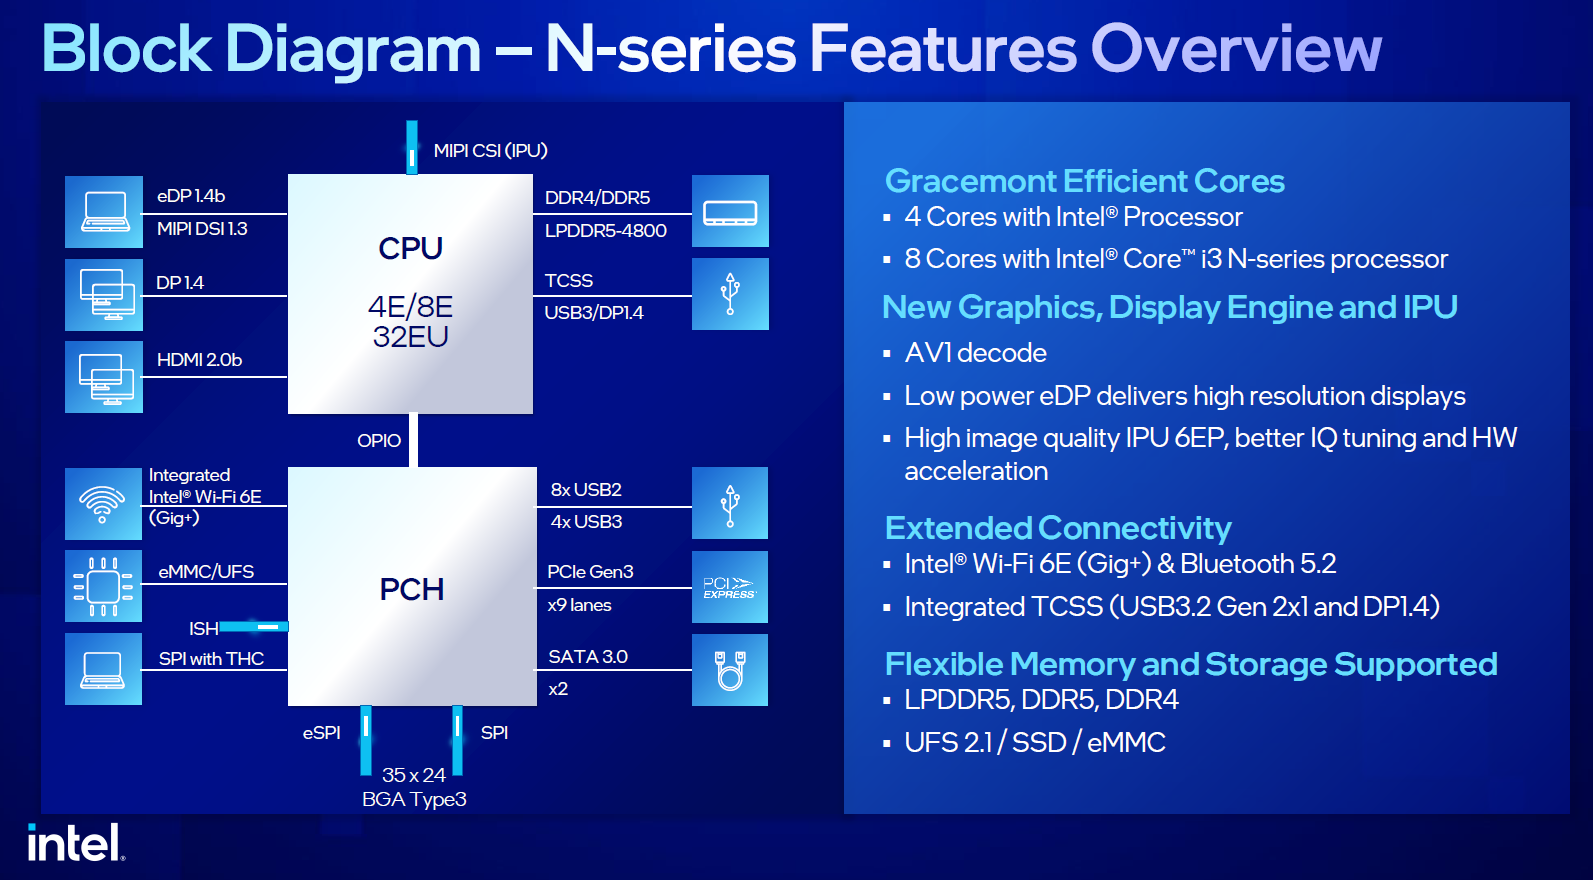
The N97 and N100 processors both have four Gracemont cores. While the NUC BOX-N97 goes in for a DDR4 memory slot, the NucBox G2 opts for a LPDDR5-4800 memory subsystem. ASRock Industrial takes advantage of both USB3/DP1.4 ports from the CPU (in regular Alder Lake -U/-P with performance cores, these would have been the Thunderbolt ports), while GMKtec ignores them. There are 9 PCIe 3.0 lanes available, and so it becomes interesting to note how the vendors utilize them in their systems.
The block diagram below presents the overall high-speed I/O distribution from the NUC BOX-N97’s user manual.
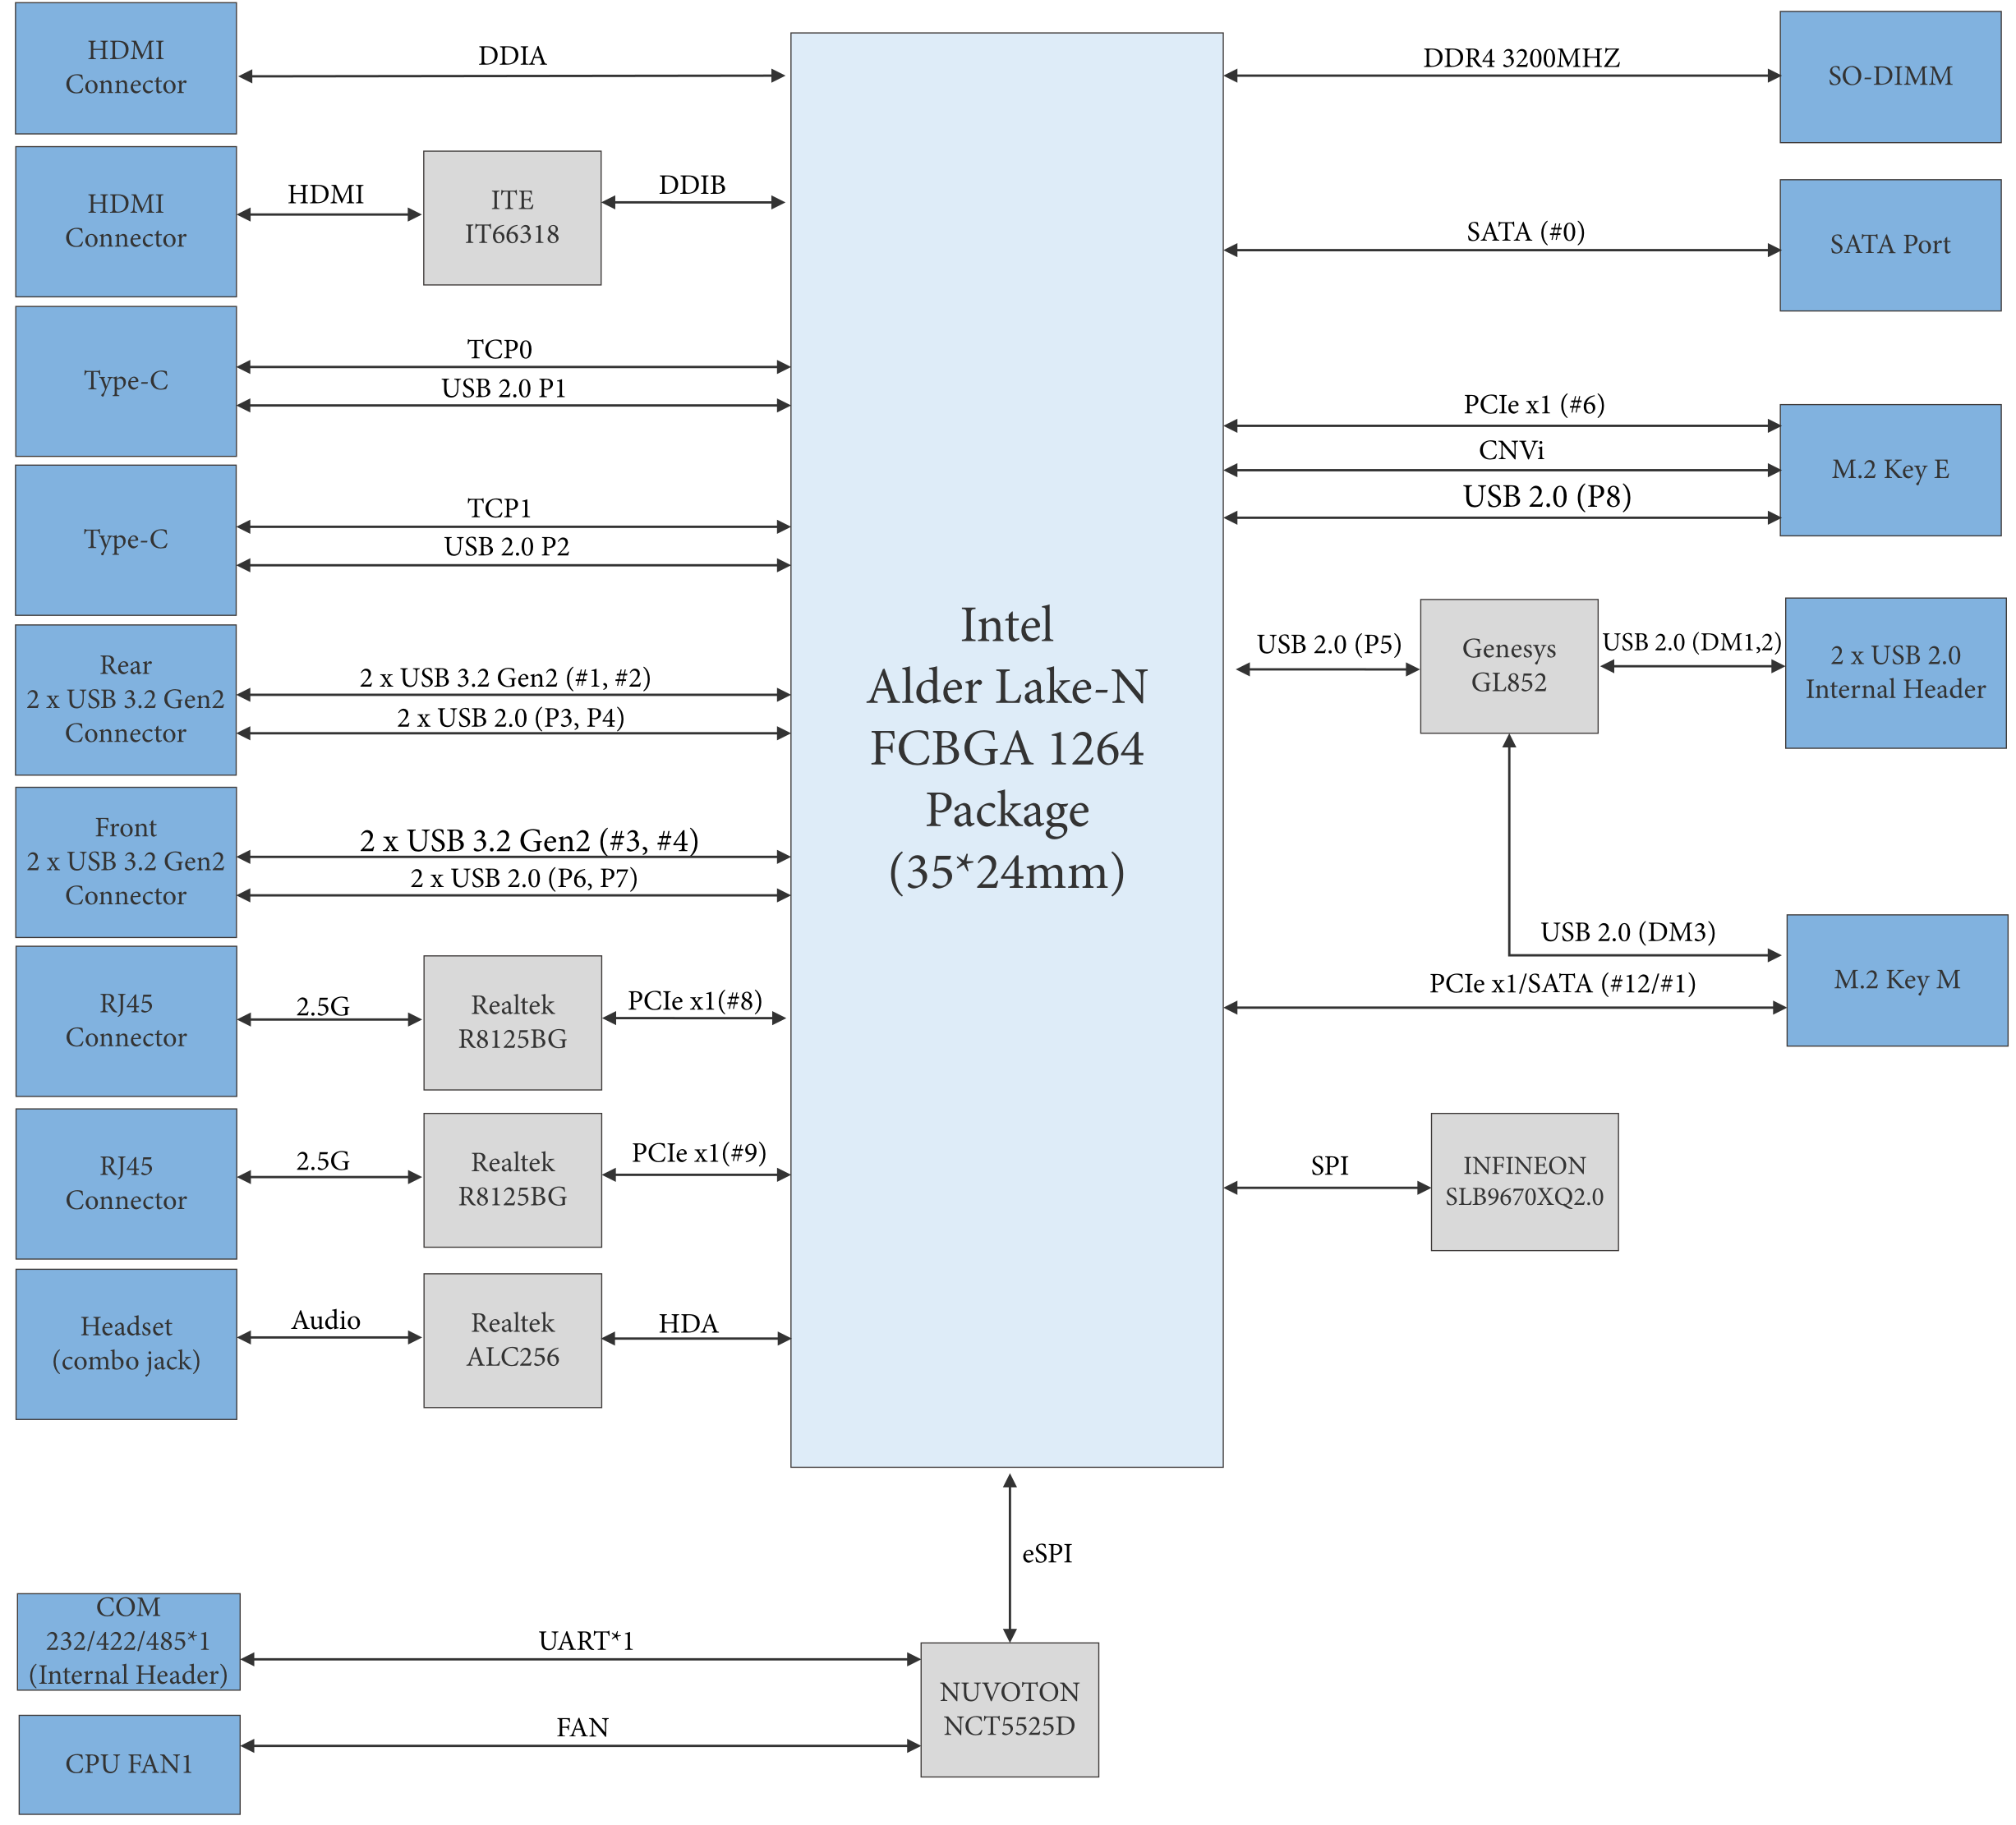
Additional context is provided by the bus layout to I/O ports mapping presented below.
The Realtek audio codec behind the audio jack doesn’t find a place in the bus layout. We have already noted the utilization of the ‘Thunderbolt’ Type-C outputs as USB 3.2 Gen 2 ports with Alt-DP support.
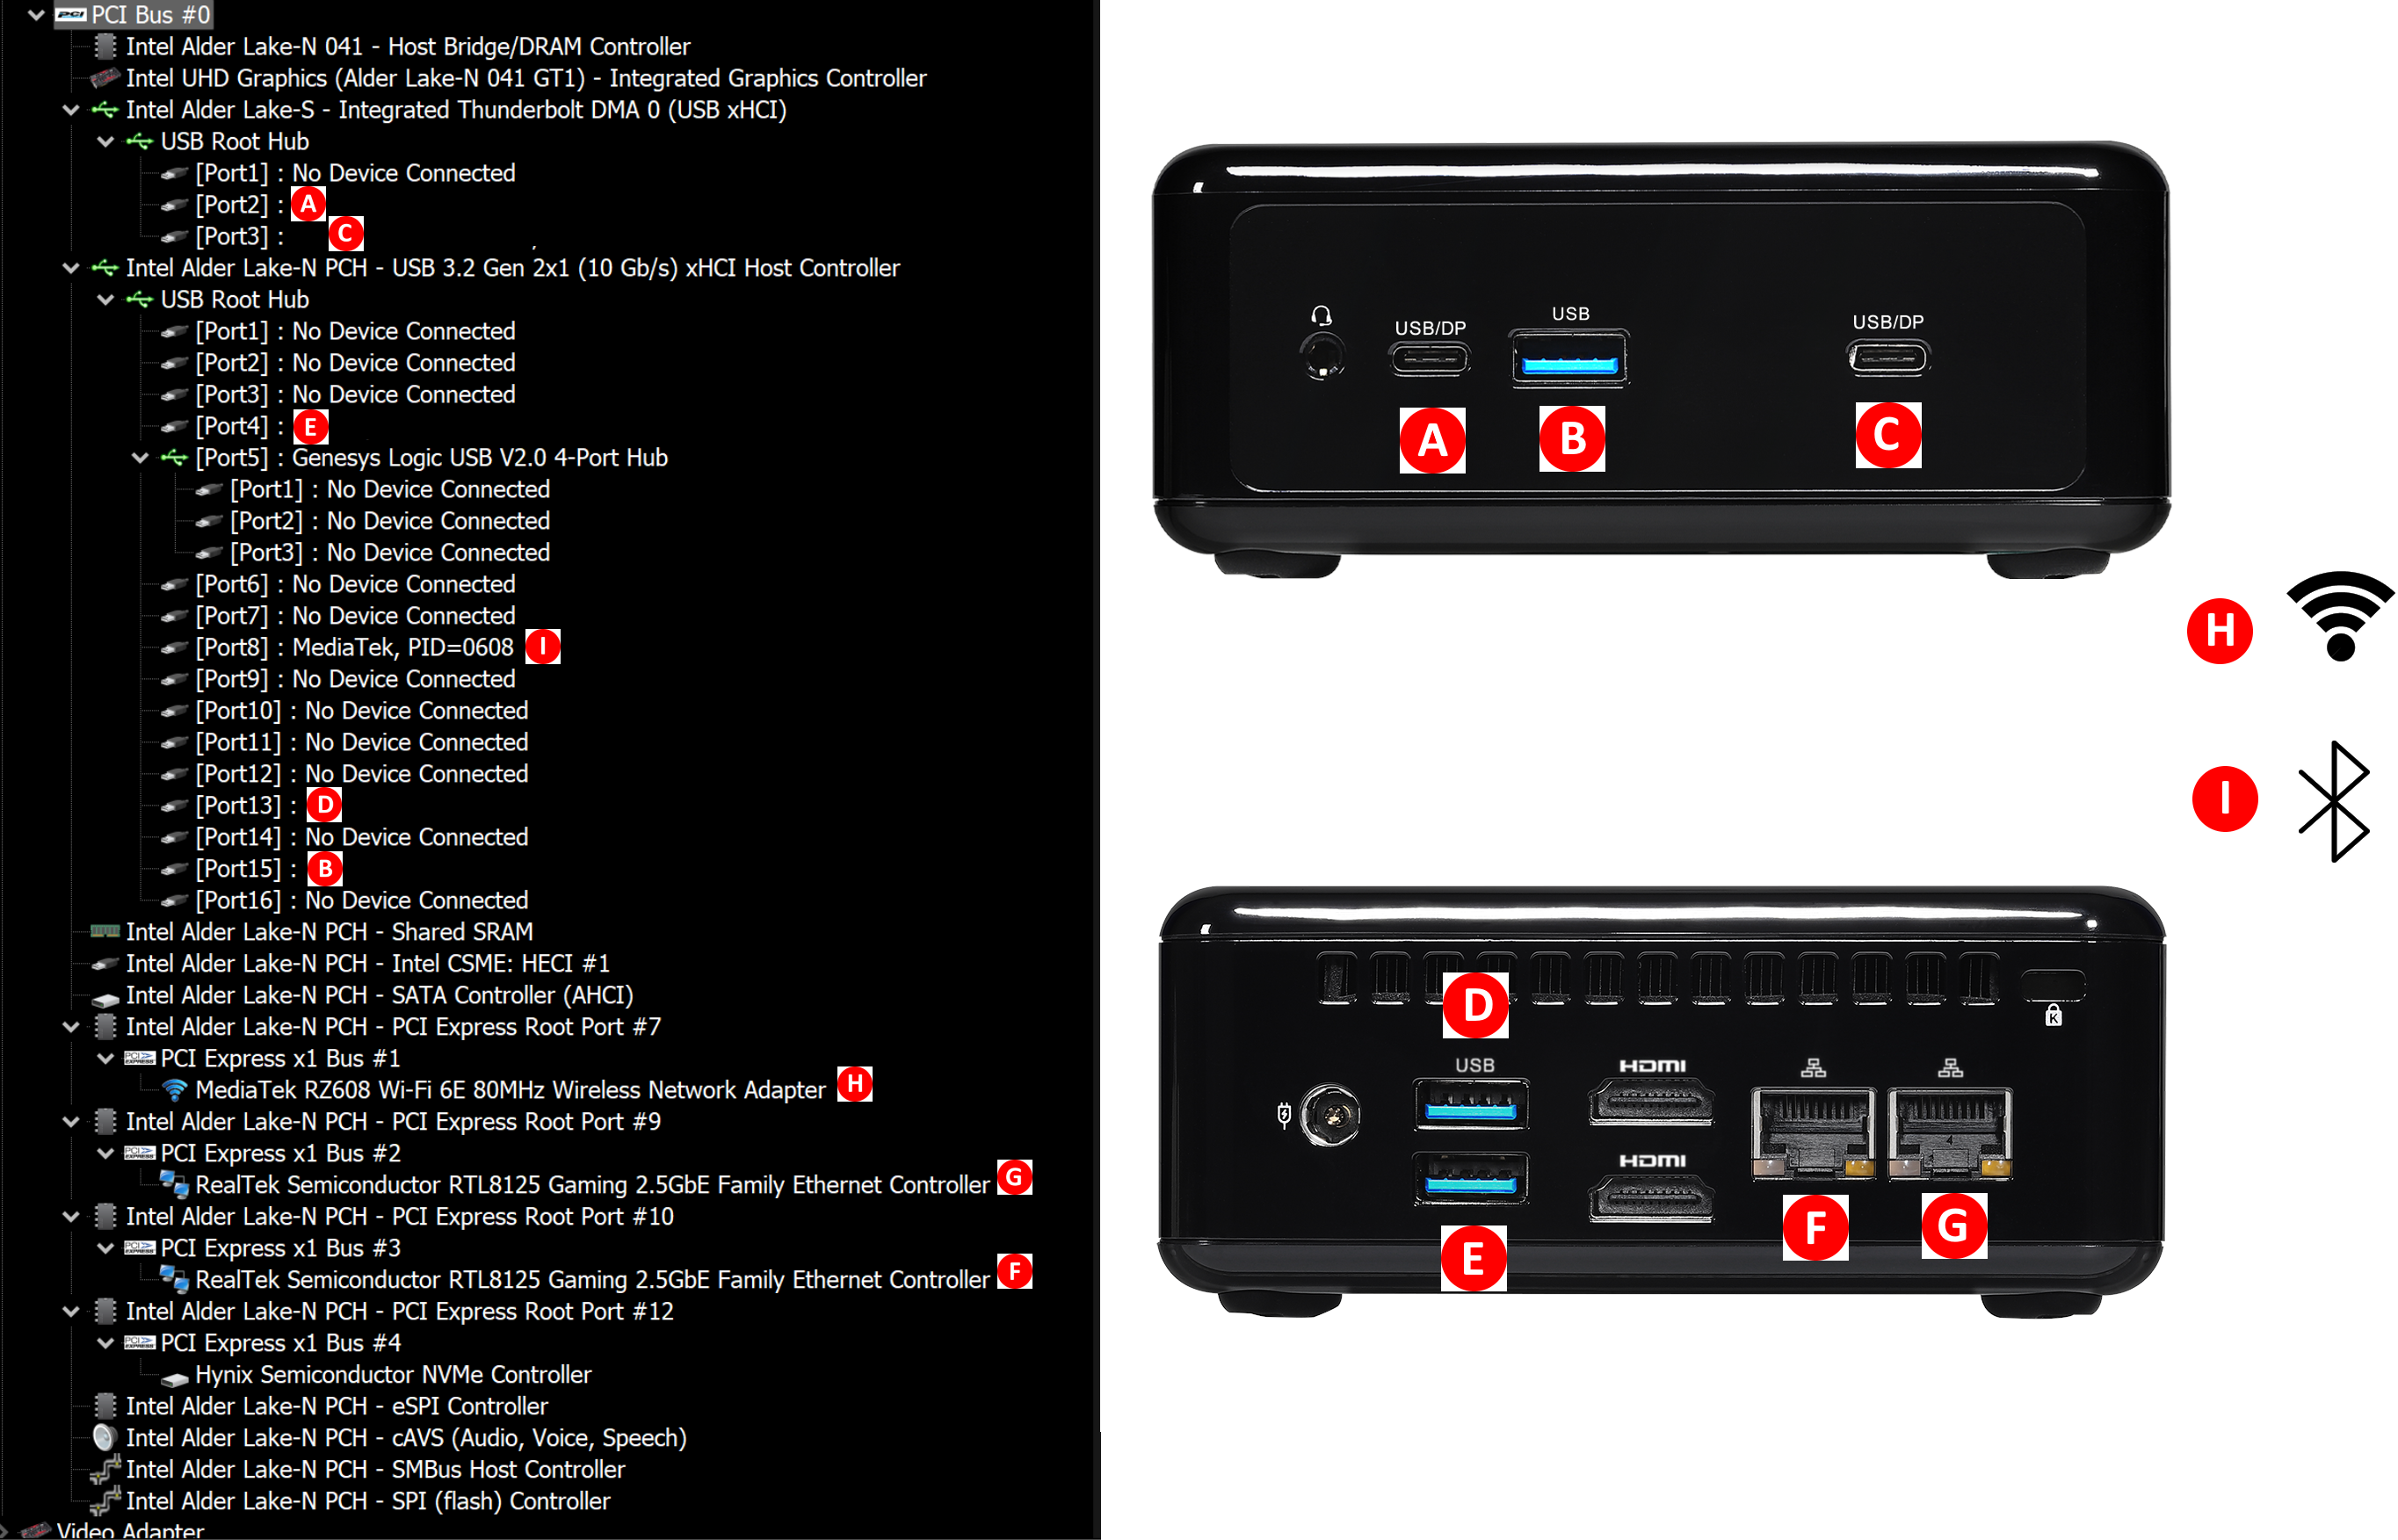
GMKtec doesn’t maintain a user manual with a block diagram – their target market does not require it. However, the bus layout to I/O ports mapping can be inferred.
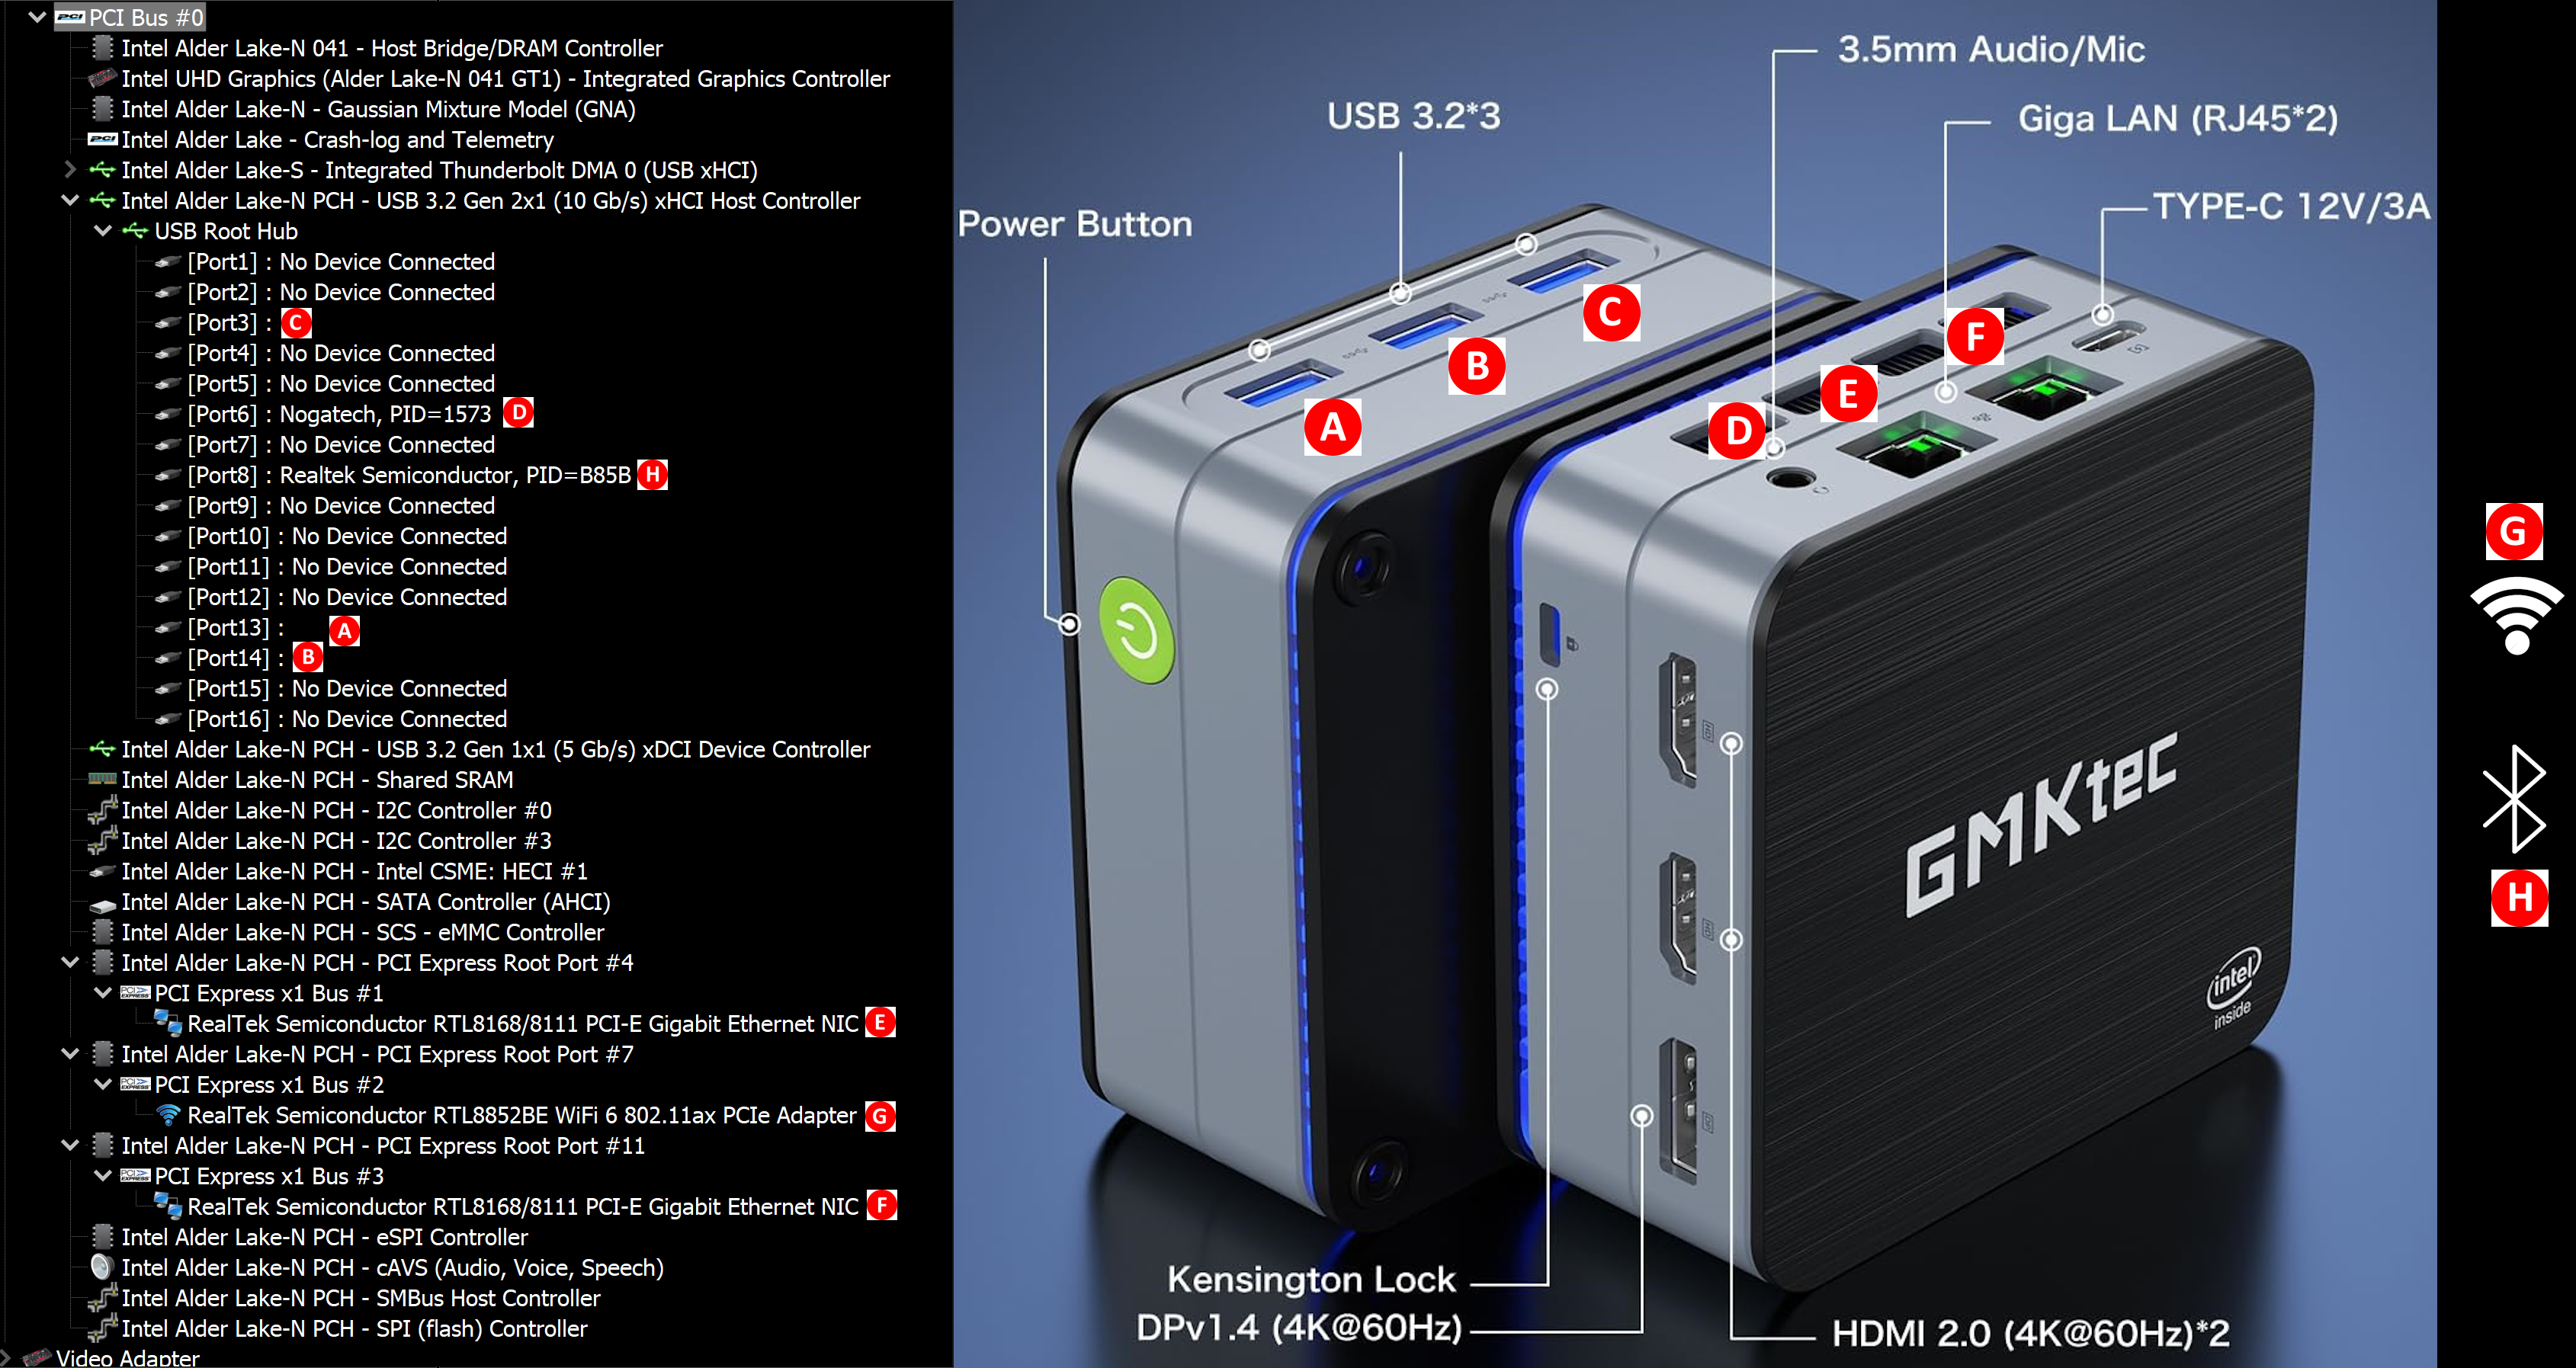
The Type-A ports are all 10 Gbps-capable (USB 3.2 Gen 2). This is in contrast to the USB 3.2 Gen 1 ports in the ACEMAGIC T8 Plus which has a similar physical footprint and I/O layout.
In today’s review, we compare the ASRock Industrial NUC BOX-N97 and the GMKtec NucBox G2 against a host of other systems based on processors with TDPs ranging from 6W to 28W. The systems do not target the same market segments, but a few key aspects lie in common, making the comparisons relevant.
| Comparative PC Configurations | ||
| Aspect | ASRock NUC BOX-N97 | |
| CPU | Intel Processor N97 Alder Lake-N 4C/4T, up to 3.6 GHz Intel 7, 6MB L3, 12W (PL1 = 12W / PL2 = 25W) |
Intel Processor N97 Alder Lake-N 4C/4T, up to 3.6 GHz Intel 7, 6MB L3, 12W (PL1 = 12W / PL2 = 25W) |
| GPU | Intel UHD Graphics (24EU @ 1200 MHz) |
Intel UHD Graphics (24EU @ 1200 MHz) |
| RAM | Crucial CT16G4SFRA32A.C16FR DDR4-3200 SODIMM 22-22-22-52 @ 3200 MHz 1×16 GB |
Crucial CT16G4SFRA32A.C16FR DDR4-3200 SODIMM 22-22-22-52 @ 3200 MHz 1×16 GB |
| Storage | SK hynix Gold P31 SHGP31-1000GM-2 (1 TB; M.2 2280 PCIe 3.0 x4 NVMe SSD, operating at x1) (SK hynix 128L 4D TLC; SK hynix Cepheus ACNT038 Controller) |
SK hynix Gold P31 SHGP31-1000GM-2 (1 TB; M.2 2280 PCIe 3.0 x4 NVMe SSD, operating at x1) (SK hynix 128L 4D TLC; SK hynix Cepheus ACNT038 Controller) |
| Wi-Fi | 2x 2.5 GbE RJ-45 (Realtek RTL8125) Mediatek MT7921K (RZ608) Wi-Fi 6E (2×2 802.11ax – 1.2 Gbps) |
2x 2.5 GbE RJ-45 (Realtek RTL8125) Mediatek MT7921K (RZ608) Wi-Fi 6E (2×2 802.11ax – 1.2 Gbps) |
| Price (in USD, when built) | (Street Pricing on Oct 05th, 2023) US $260 (barebones) US $353 (as configured, no OS) |
(Street Pricing on Oct 05th, 2023) US $260 (barebones) US $353 (as configured, no OS) |
The next few sections will deal with comparative benchmarks for the above systems.
Our 2022 Q4 update to the test suite for Windows 11-based systems carries over some of the standard benchmarks we have been using over the last several years. While UL’s PCMark makes the list, we have opted to temporarily suspend reporting of BAPCo’s SYSmark scores (pending fixture of the energy consumption aspect). Instead, BAPCO’s CrossMark multi-platform benchmarking tool has been added to the set along with UL’s Procyon suite. While CrossMark employs idle time compression and processes all workloads in an opaque manner, UL’s Procyon processes real-world workloads with user interactions (like BAPCo’s SYSmark). We have augmented the UL Procyon suite benchmark with our own custom energy measurement setup.
UL PCMark 10
UL’s PCMark 10 evaluates computing systems for various usage scenarios (generic / essential tasks such as web browsing and starting up applications, productivity tasks such as editing spreadsheets and documents, gaming, and digital content creation). We benchmarked select PCs with the PCMark 10 Extended profile and recorded the scores for various scenarios. These scores are heavily influenced by the CPU and GPU in the system, though the RAM and storage device also play a part. The power plan was set to Balanced for all the PCs while processing the PCMark 10 benchmark. The scores for each contributing component / use-case environment are also graphed below.
| UL PCMark 10 – Performance Scores | |||
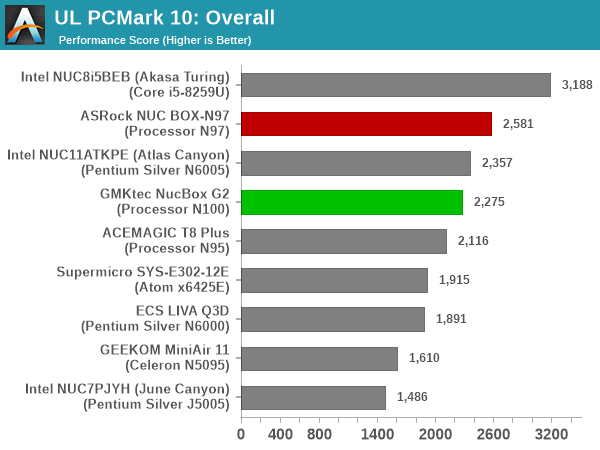
The NUC BOX-N97 has a 2W edge in the PL1, and the CPU and iGPU are both clocked slightly higher in it compared to the N100 in the NucBox G2. However, the latter has a slight edge in the memory department with LPDDR5-4800 compared to the DDR4-3200 in the NUC BOX-N97. The results above point to a slight edge for the NUC BOX-N97.
UL Procyon v2.1.544
PCMark 10 utilizes open-source software such as Libre Office and GIMP to evaluate system performance. However, many of their professional benchmark customers have been requesting evaluation with commonly-used commercial software such as Microsoft Office and Adobe applications. In order to serve their needs, UL introduced the Procyon benchmark in late 2020. There are five benchmark categories currently – Office Productivity, AI Inference, Battery Life, Photo Editing, and Video Editing. AI Inference benchmarks are available only for Android devices, while the battery life benchmark is applicable to Windows devices such as notebooks and tablets. We presents results from our processing of the other three benchmarks. Note that Jasper Lake and previous Atom-based systems were not able to complete the UL Procyon benchmarks and are hence not included in the graphs below.
| UL Procyon – Office Productivity Scores | |||
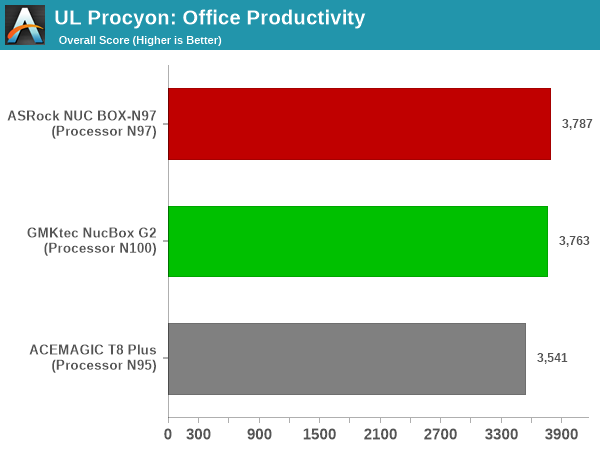
The performance of the ADL-N systems are all similar, with the N97 enjoying a slight edge due to the power limit default settings. Having a slightly larger physical footprint allows the system to keep up the power limits at higher values without running into thermal issues.
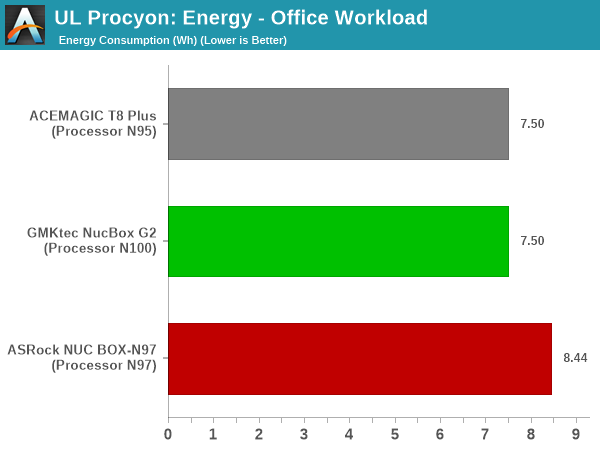
Unfortunately, in the quest for that bit of extra performance, the NUC BOX-N97 incurs an energy-consumption penalty of 0.96 Wh. This is in comparison to the NucBox G2 for the same Office workloads.
Moving on to the evaluation of Adobe Photoshop and Adobe Lightroom, we find the NUC BOX-N97 enjoying a healthier lead. This is likely due to the extra iGPU power available that probably matters for this workload.
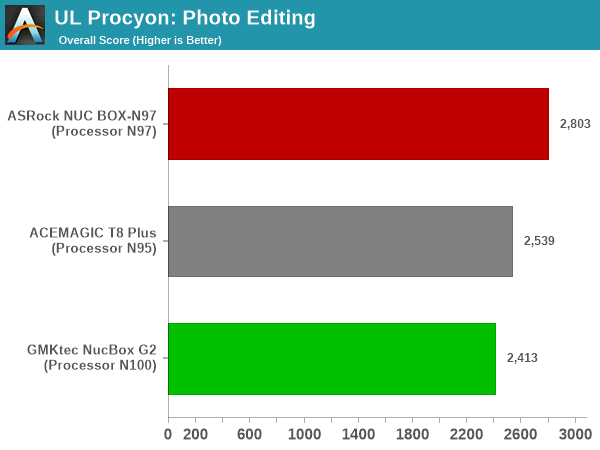
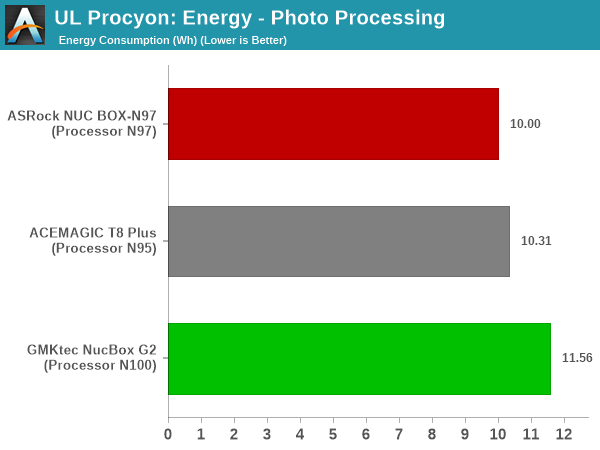
The usage of the iGPU for accelerating some of the tasks allows the NUC BOX-N97 to complete the job early while minimizing the energy consumption – a 1.56Wh advantage over the NucBox G2.
UL Procyon evaluates performance for video editing using Adobe Premier Pro.
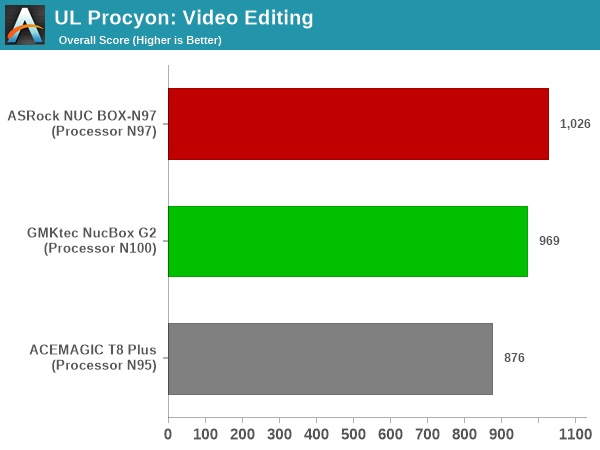
The involvement of the iGPU is a positive for the NUC BOX-N97 again, allowing it to get the top honors by a comfortable margin.
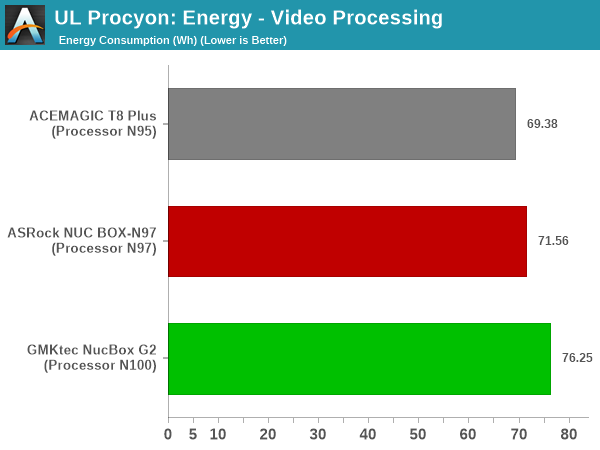
Harnessing the iGPU allows the workload to be completed faster on the NUC BOX-N97 compared to the NucBox G2, and this is reflected again in the energy consumption numbers.
BAPCo CrossMark 1.0.1.86
BAPCo’s CrossMark aims to simplify benchmark processing while still delivering scores that roughly tally with SYSmark. The main advantage is the cross-platform nature of the tool – allowing it to be run on smartphones and tablets as well.
| BAPCo CrossMark 1.0.1.86 – Sub-Category Scores | |||
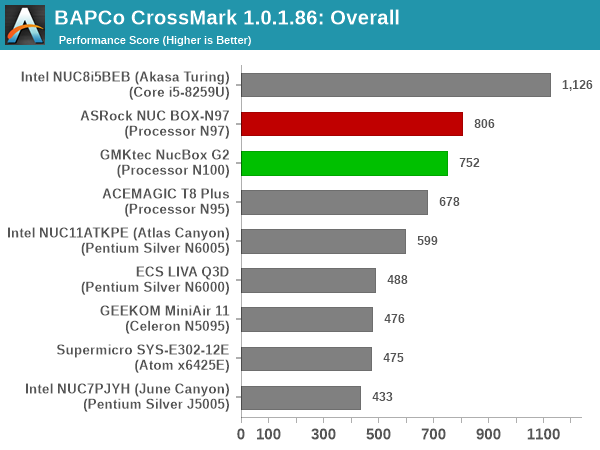
The relative performance seen in the UL PCMark 10 workloads also translate to BAPCo Crossmark. Idle time compression doesn’t seem to affect the relative ordering, as both the systems adopt the same 25W PL2. The responsiveness of the NUC BOX-N97 is obviously much better than the NucBox G2 because the former uses a PCIe 3.0 x1 NVMe SSD, while the latter uses a SATA SSD. The creativity workload sees the G2 edge ahead by a bit, possibly due to the faster memory.
SFF PCs traditionally do not lend themselves to workstation duties. In fact, we were never able to get SPECworkstation to complete successfully in any of the Jasper Lake systems. However, things have changed with Gracemont, and we are able to run SPECworkstation 3.1 on ADL-N systems.
The SPECworkstation 3.1 benchmark measures workstation performance based on a number of professional applications. It includes more than 140 tests based on 30 different workloads that exercise the CPU, graphics, I/O and memory hierarchy. These workloads fall into different categories.
- Media and Entertainment (3D animation, rendering)
- Product Development (CAD/CAM/CAE)
- Life Sciences (medical, molecular)
- Financial Services
- Energy (oil and gas)
- General Operations
- GPU Compute
Individual scores are generated for each test and a composite score for each category is calculated based on a reference machine (HP Z240 tower workstation using an Intel E3-1240 v5 CPU, an AMD Radeon Pro WX3100 GPU, 16GB of DDR4-2133, and a SanDisk 512GB SSD). Official benchmark results generated automatically by the benchmark itself are linked in the table below for the systems being compared.
| SPECworkstation 3.1 Official Results (2K) | |
| ASRock NUC BOX-N97 | Run Summary |
| GMKtec NucBox G2 | Run Summary |
| ACEMAGIC T8 Plus | Run Summary |
Details of the tests in each category, as well as an overall comparison of the systems on a per-category basis are presented below.
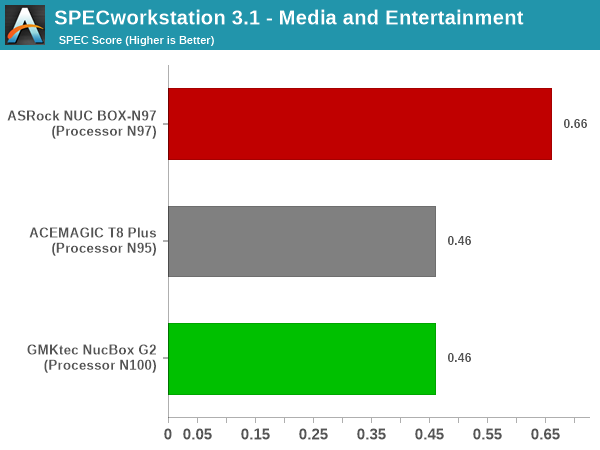
Media and Entertainment
The Media and Entertainment category comprises of workloads from five distinct applications:
- The Blender workload measures system performance for content creation using the open-source Blender application. Tests include rendering of scenes of varying complexity using the OpenGL and ray-tracing renderers.
- The Handbrake workload uses the open-source Handbrake application to transcode a 4K H.264 file into a H.265 file at 4K and 2K resolutions using the CPU capabilities alone.
- The LuxRender workload benchmarks the LuxCore physically based renderer using LuxMark.
- The Maya workload uses the SPECviewperf 13 maya-05 viewset to replay traces generated using the Autodesk Maya 2017 application for 3D animation.
- The 3ds Max workload uses the SPECviewperf 13 3dsmax-06 viewset to replay traces generated by Autodesk’s 3ds Max 2016 using the default Nitrous DX11 driver. The workload represents system usage for 3D modeling tasks.
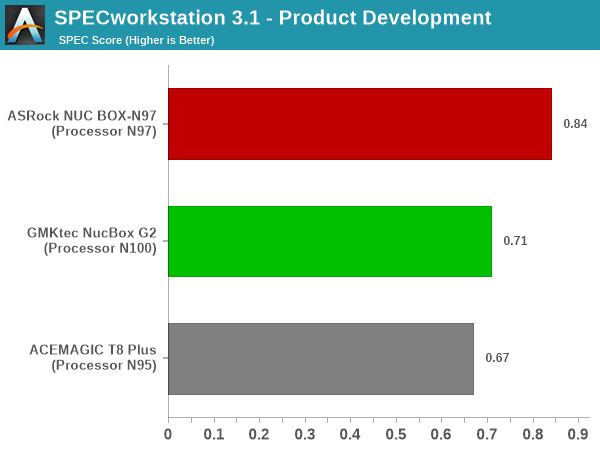
Product Development
The Product Development category comprises of eight distinct workloads:
- The Rodinia (CFD) workload benchmarks a computational fluid dynamics (CFD) algorithm.
- The WPCcfd workload benchmarks another CFD algorithm involving combustion and turbulence modeling.
- The CalculiX workload uses the Calculix finite-element analysis program to model a jet engine turbine’s internal temperature.
- The Catia workload uses the catia-05 viewset from SPECviewperf 13 to replay traces generated by Dassault Systemes’ CATIA V6 R2012 3D CAD application.
- The Creo workload uses the creo-02 viewset from SPECviewperf 13 to replay traces generated by PTC’s Creo, a 3D CAD application.
- The NX workload uses the snx-03 viewset from SPECviewperf 13 to replay traces generated by the Siemens PLM NX 8.0 CAD/CAM/CAE application.
- The Solidworks workload uses the sw-04 viewset from SPECviewperf 13 to replay traces generated by Dassault Systemes’ SolidWorks 2013 SP1 CAD/CAE application.
- The Showcase workload uses the showcase-02 viewset from SPECviewperf 13 to replay traces from Autodesk???s Showcase 2013 3D visualization and presentation application
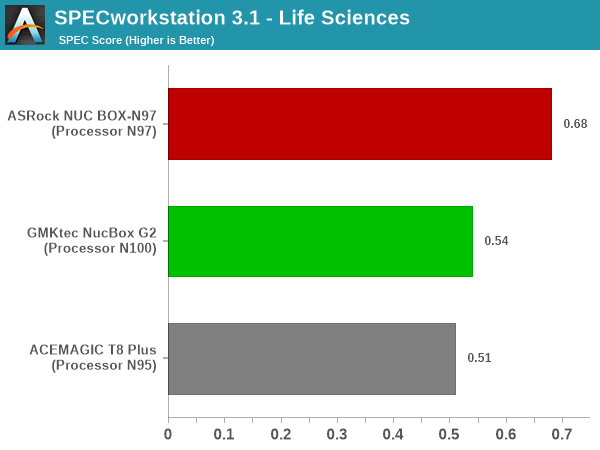
Life Sciences
The Life Sciences category comprises of four distinct test sets:
- The LAMMPS set comprises of five tests simulating different molecular properties using the LAMMPS molecular dynamics simulator.
- The NAMD set comprises of three tests simulating different molecular interactions.
- The Rodinia (Life Sciences) set comprises of four tests – the Heartwall medical imaging algorithm, the Lavamd algorithm for calculation of particle potential and relocation in a 3D space due to mutual forces, the Hotspot algorithm to estimate processor temperature with thermal simulations, and the SRAD anisotropic diffusion algorithm for denoising.
- The Medical workload uses the medical-02 viewset from SPECviewperf 13 to determine system performance for the Tuvok rendering core in the ImageVis3D volume visualization program.
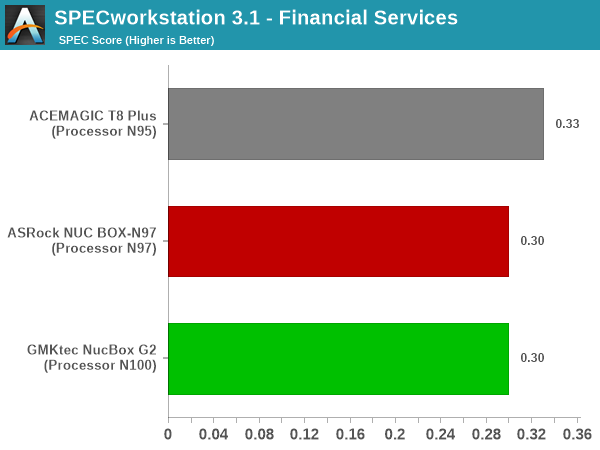
Financial Services
The Financial Services workload set benchmarks the system for three popular algorithms used in the financial services industry – the Monte Carlo probability simulation for risk assessment and forecast modeling, the Black-Scholes pricing model, and the Binomial Options pricing model.
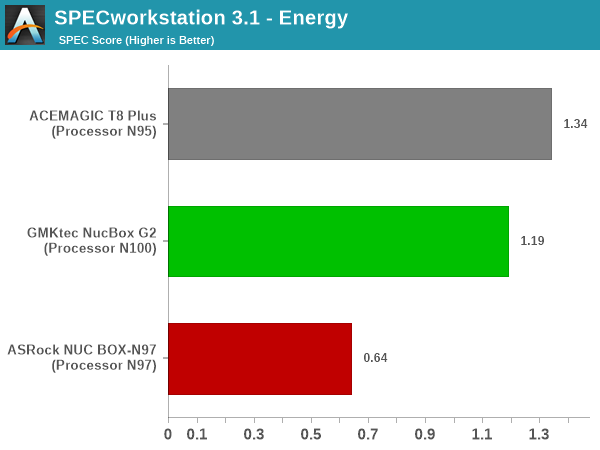
Energy
The Energy category comprises of workloads simulating various algorithms used in the oil and gas industry:
- The FFTW workload computes discrete Fourier transforms of large matrices.
- The Convolution workload computes the convolution of a random 100×100 filter on a 400 megapixel image.
- The SRMP workload processes the Surface-Related Multiples Prediction algorithm used in seismic data processing.
- The Kirchhoff Migration workload processes an algorithm to calculate the back propogation of a seismic wavefield.
- The Poisson workload takes advantage of the OpenMP multi-processing framework to solve the Poisson’s equation.
- The Energy workload uses the energy-02 viewset from SPECviewperf 13 to determine system performance for the open-source OPendTec seismic visualization application.
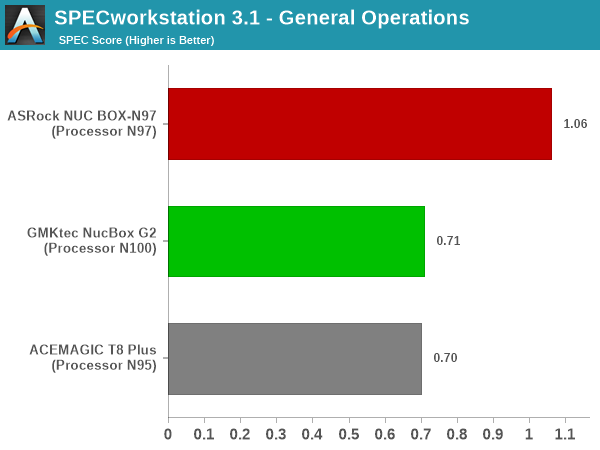
General Operations
In the General Options category, the focus is on workloads from widely used applications in the workstation market:
- The 7zip workload represents compression and decompression operations using the open-source 7zip file archiver program.
- The Python workload benchmarks math operations using the numpy and scipy libraries along with other Python features.
- The Octave workload performs math operations using the Octave programming language used in scientific computing.
- The Storage workload evaluates the performance of the underlying storage device using transaction traces from multiple workstation applications.
GPU Compute
In the GPU Compute category, the focus is on workloads taking advantage of the GPU compute capabilities using either OpenCL or CUDA, as applicable:
- The LuxRender benchmark is the same as the one seen in the media and entertainment category.
- The Caffe benchmark measures the performance of the Caffe deep-learning framework.
- The Folding@Home benchmark measures the performance of the system for distributed computing workloads focused on tasks such as protein folding and drug design.
We only process the OpenCL variants of the benchmark, as the CUDA version doesn’t process correctly with default driver installs.
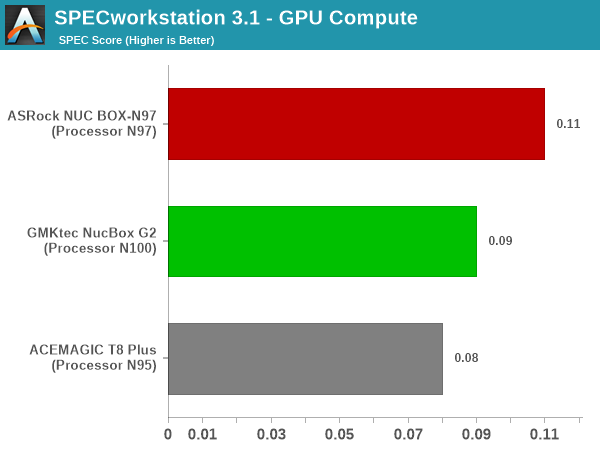
Except for the ‘energy’ workloads, the NUC BOX-N97 comes out on top by a comfortable margin, with G2 coming in second. The anomaly in the ‘energy’ workload is likely due to the faster RAM in the G2 compared to the one in the NUC BOX-N97.
Standardized benchmarks such as UL’s PCMark 10 and BAPCo’s SYSmark take a holistic view of the system and process a wide range of workloads to arrive at a single score. Some systems are required to excel at specific tasks – so it is often helpful to see how a computer performs in specific scenarios such as rendering, transcoding, JavaScript execution (web browsing), etc. This section presents focused benchmark numbers for specific application scenarios.
3D Rendering – CINEBENCH R23
We use CINEBENCH R23 for 3D rendering evaluation. R23 provides two benchmark modes – single threaded and multi-threaded. Evaluation of different PC configurations in both supported modes provided us the following results.
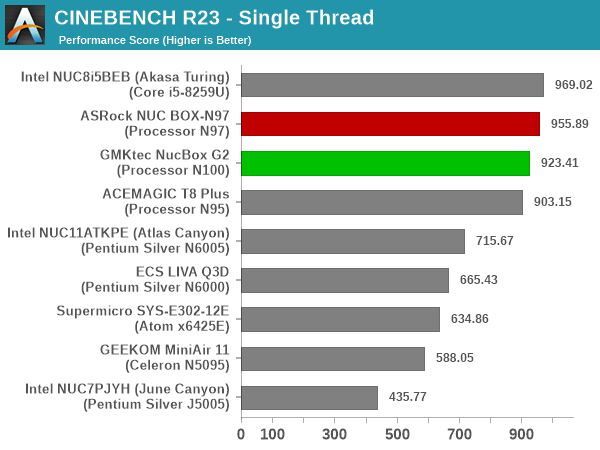
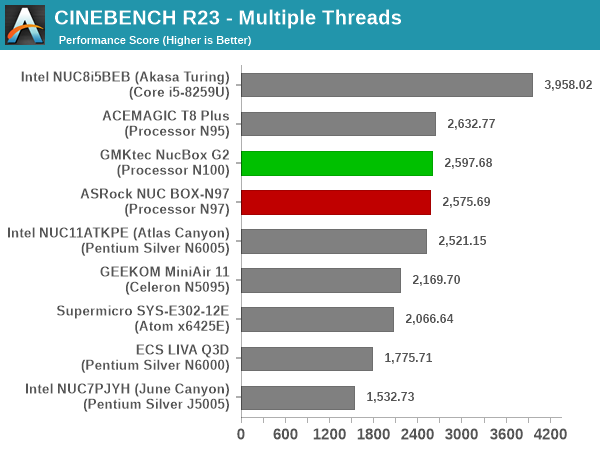
The 2W edge in the PL1 gives the NUC BOX-N97 the honors in the single-threaded rendering performance. However, with multiple threads in the picture, the systems are bunched together and the scores for all of them are within the realm of run-to-run variations.
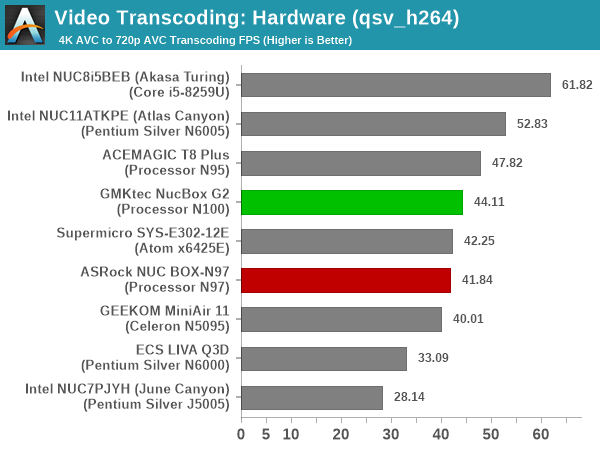
Transcoding: Handbrake 1.5.1
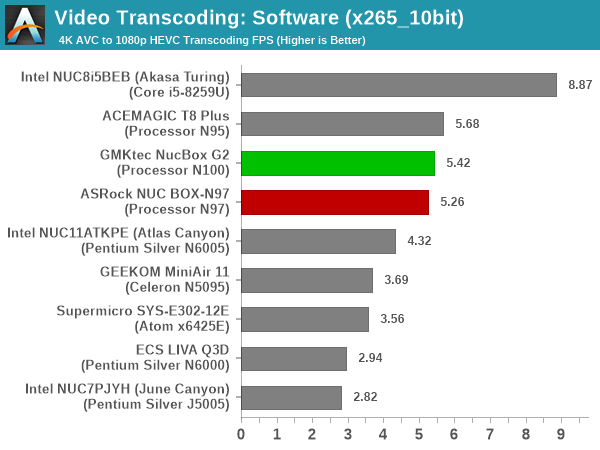
Handbrake is one of the most user-friendly open source transcoding front-ends in the market. It allows users to opt for either software-based higher quality processing or hardware-based fast processing in their transcoding jobs. Our new test suite uses the ‘Tears of Steel’ 4K AVC video as input and transcodes it with a quality setting of 19 to create a 720p AVC stream and a 1080p HEVC stream.
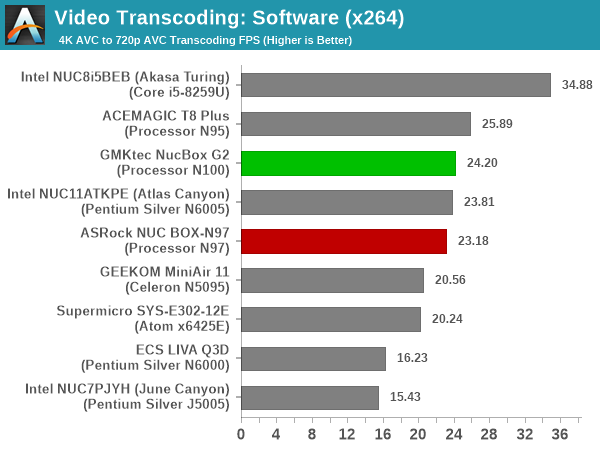
Software transcoding should ideally just be dependent on the number of cores and power limits. However, despite the 2W edge, the NUC BOX-N97 drops down a bit compared to both the NucBox G2 and the T8 Plus. The only reasonable explanation appears to the use of LPDDR5 in the latter two systems. The higher PL1 (15W) of the T8 Plus gives it the edge despite the slower LPDDR5 memory.
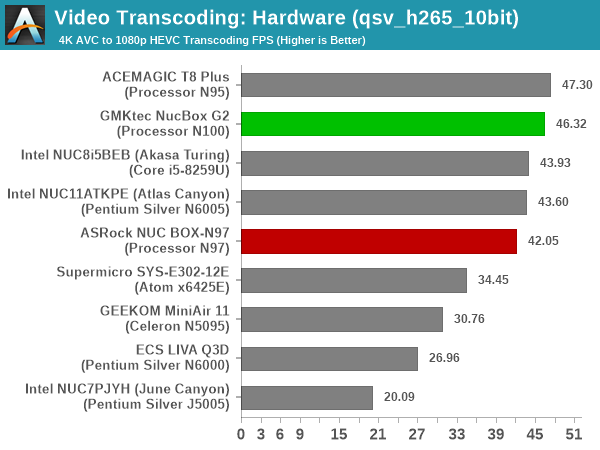
The 15W PL1 of the T8 Plus puts it above the NucBox G2 and the NUC BOX-N97, and between the latter two, the faster LPDDR5 memory seems to positively impact the G2.
Archiving: 7-Zip 21.7
The 7-Zip benchmark is carried over from our previous test suite with an update to the latest version of the open source compression / decompression software.
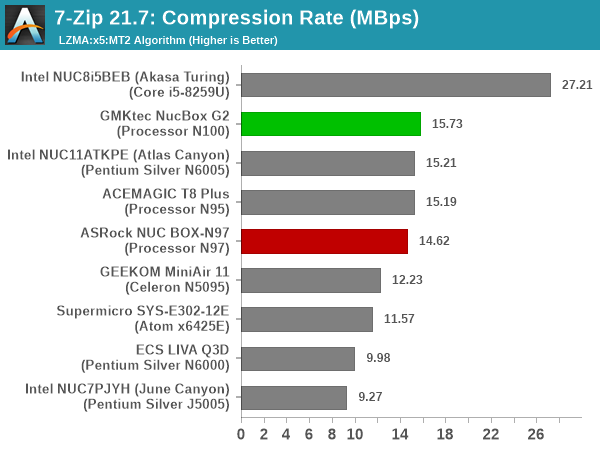
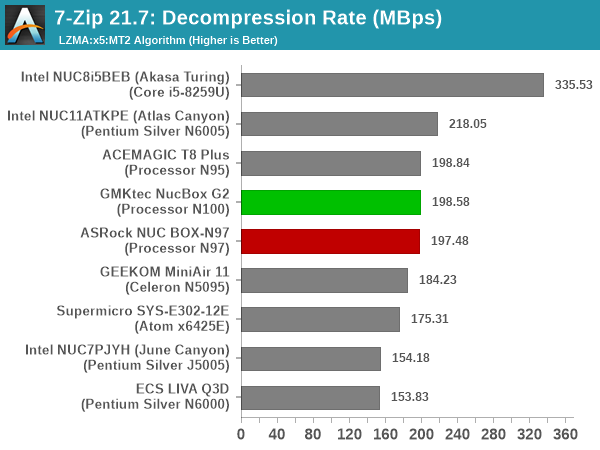
The numbers for the three ADL-N systems are close together. The edge seems to be with the NucBox G2, with its LPDDR5-4800 memory.
Web Browsing: JetStream, Speedometer, and Principled Technologies WebXPRT4
Web browser-based workloads have emerged as a major component of the typical home and business PC usage scenarios. For headless systems, many applications based on JavaScript are becoming relevant too. In order to evaluate systems for their JavaScript execution efficiency, we are carrying over the browser-focused benchmarks from the WebKit developers used in our notebook reviews. Hosted at BrowserBench, JetStream 2.0 benchmarks JavaScript and WebAssembly performance, while Speedometer measures web application responsiveness.
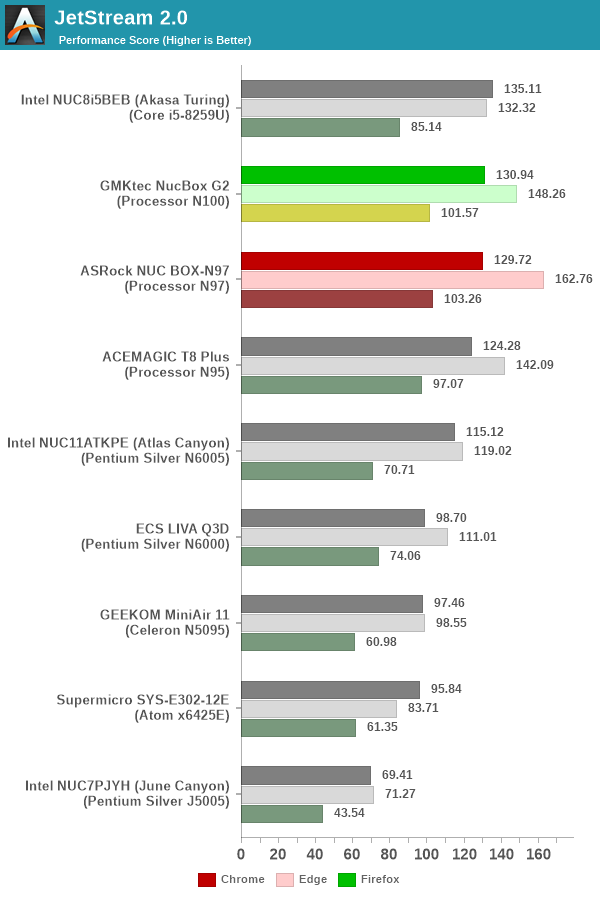
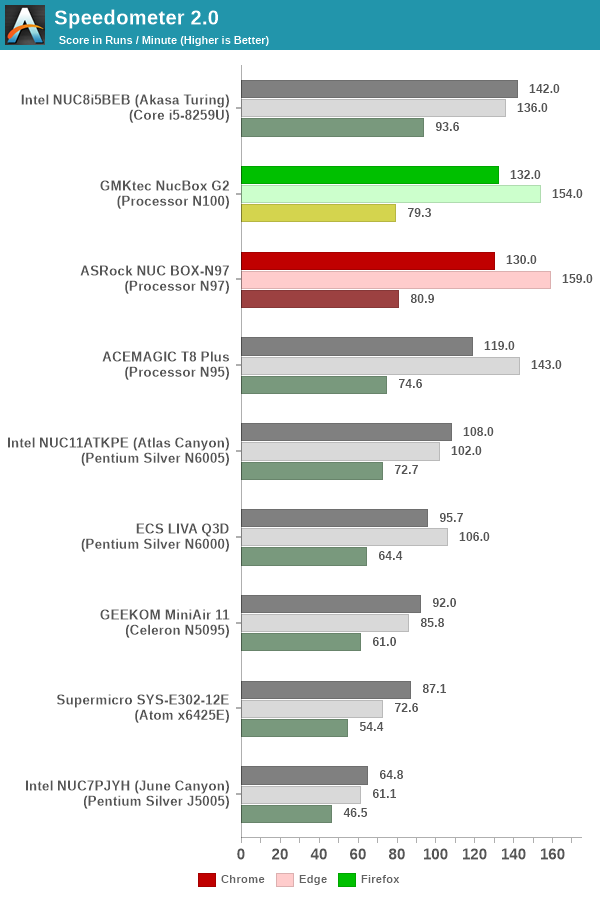
From a real-life workload perspective, we also process WebXPRT4 from Principled Technologies. WebXPRT4 benchmarks the performance of some popular JavaScript libraries that are widely used in websites.
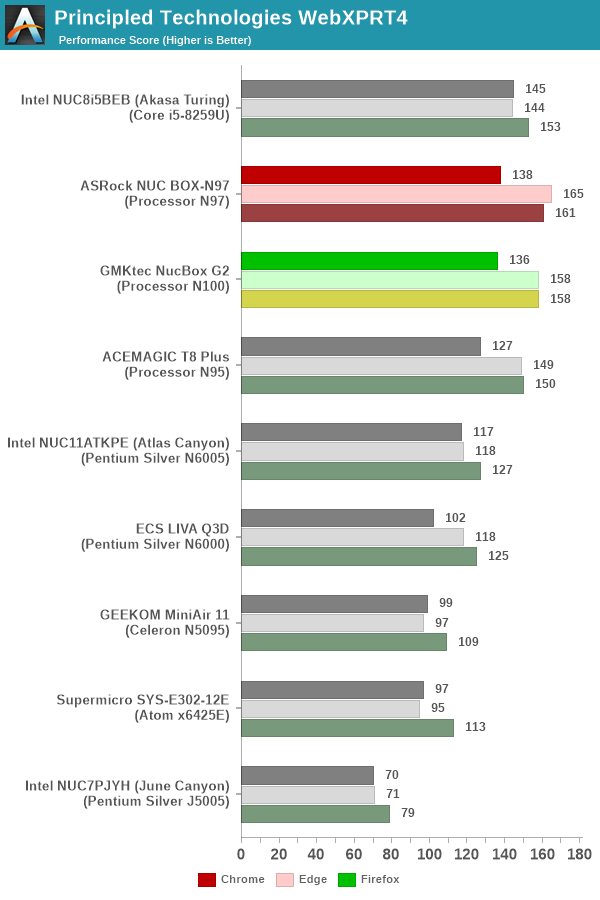
Single-threaded performance is important here, and the 2W PL1 edge gives the NUC BOX-N97 a leg up. This is particularly seen with the Edge browser. Overall, we find the scores largely tallying with each other across the same browsers.
Application Startup: GIMP 2.10.30
A new addition to our systems test suite is AppTimer – a benchmark that loads up a program and determines how long it takes for it to accept user inputs. We use GIMP 2.10.30 with a 50MB multi-layered xcf file as input. What we test here is the first run as well as the cached run – normally on the first time a user loads the GIMP package from a fresh install, the system has to configure a few dozen files that remain optimized on subsequent opening. For our test we delete those configured optimized files in order to force a ???fresh load??? every second time the software is run.
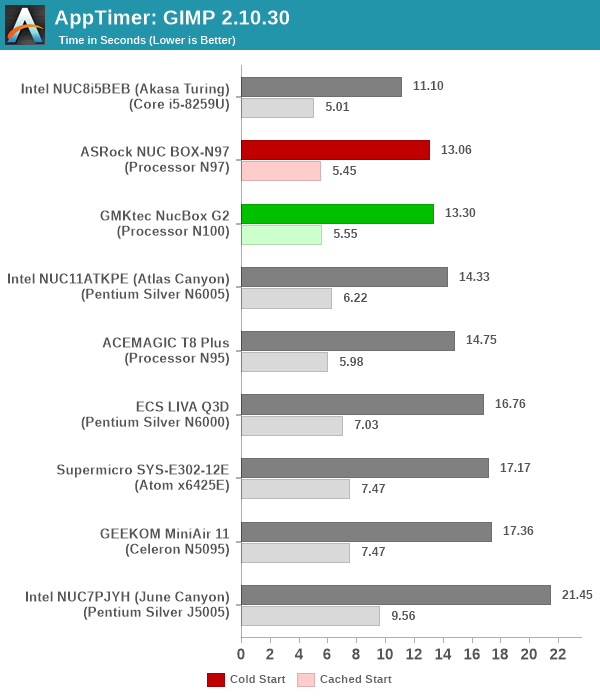
As it turns out, GIMP does optimizations for every CPU thread in the system, which requires that higher thread-count processors take a lot longer to run. So the test runs quick on systems with fewer threads, however fast cores are also needed. Both PL1 and PL2 settings help here, which is why the T8 Plus’s 15W / 15W is not effective enough against the NUC BOX-N97’s 12W / 25W and the NucBox G2’s 10W / 25W. The 2W edge for the N97 is reflected in the above graph.
Cryptography Benchmarks
Cryptography has become an indispensable part of our interaction with computing systems. Almost all modern systems have some sort of hardware-acceleration for making cryptographic operations faster and more power efficient. In the case of IoT servers, many applications – including web server functionality and VPN – need cryptography acceleration.
BitLocker is a Windows features that encrypts entire disk volumes. While drives that offer encryption capabilities are dealt with using that feature, most legacy systems and external drives have to use the host system implementation. Windows has no direct benchmark for BitLocker. However, we cooked up a BitLocker operation sequence to determine the adeptness of the system at handling BitLocker operations. We start off with a 4.5GB RAM drive in which a 4GB VHD (virtual hard disk) is created. This VHD is then mounted, and BitLocker is enabled on the volume. Once the BitLocker encryption process gets done, BitLocker is disabled. This triggers a decryption process. The times taken to complete the encryption and decryption are recorded. This process is repeated 25 times, and the average of the last 20 iterations is graphed below.
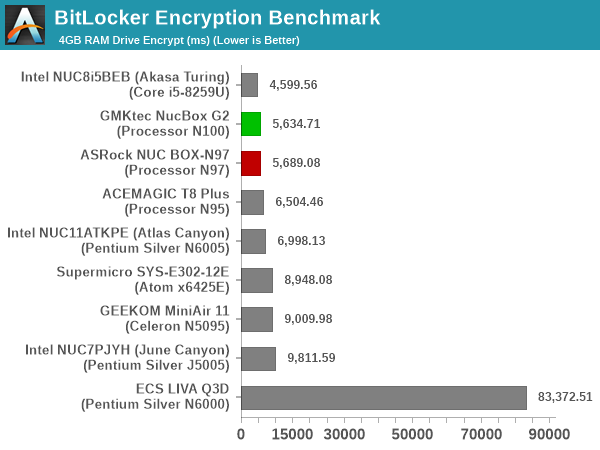
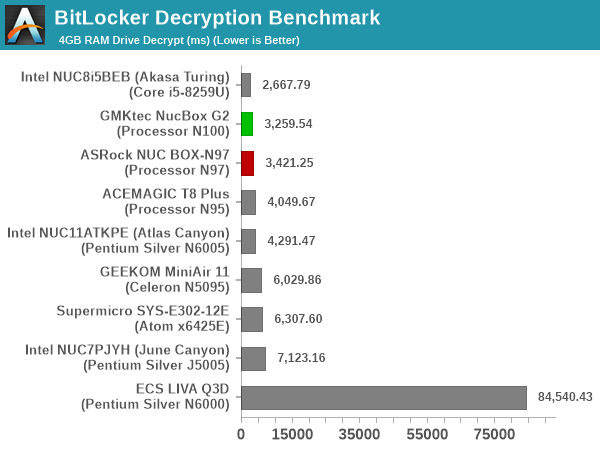
Hardware acceleration is available for the operations in all of the systems. The time taken for processing is directly dependent on the available power budget and the RAM speed, which gives the NucBox G2 a slight edge.
The integrated GPU in Alder Lake-N is a pared-down version of the one used in Alder Lake. Both the N97 and N100 have the 24EU version, but the N97 clocks it at 1.2 GHz compared to the 750 MHz N100 configuration. However, DDR4 vs. LPDDR5 may also impact GPU performance. Keeping these aspects in mind, the GPU performance has to be evaluated in the context of each workload. We put the systems through some standard 3D workloads to get an idea of what they have to offer for GPU-intensive tasks. Prior to that, a detailed look at the capabilities of the GPU is warranted.
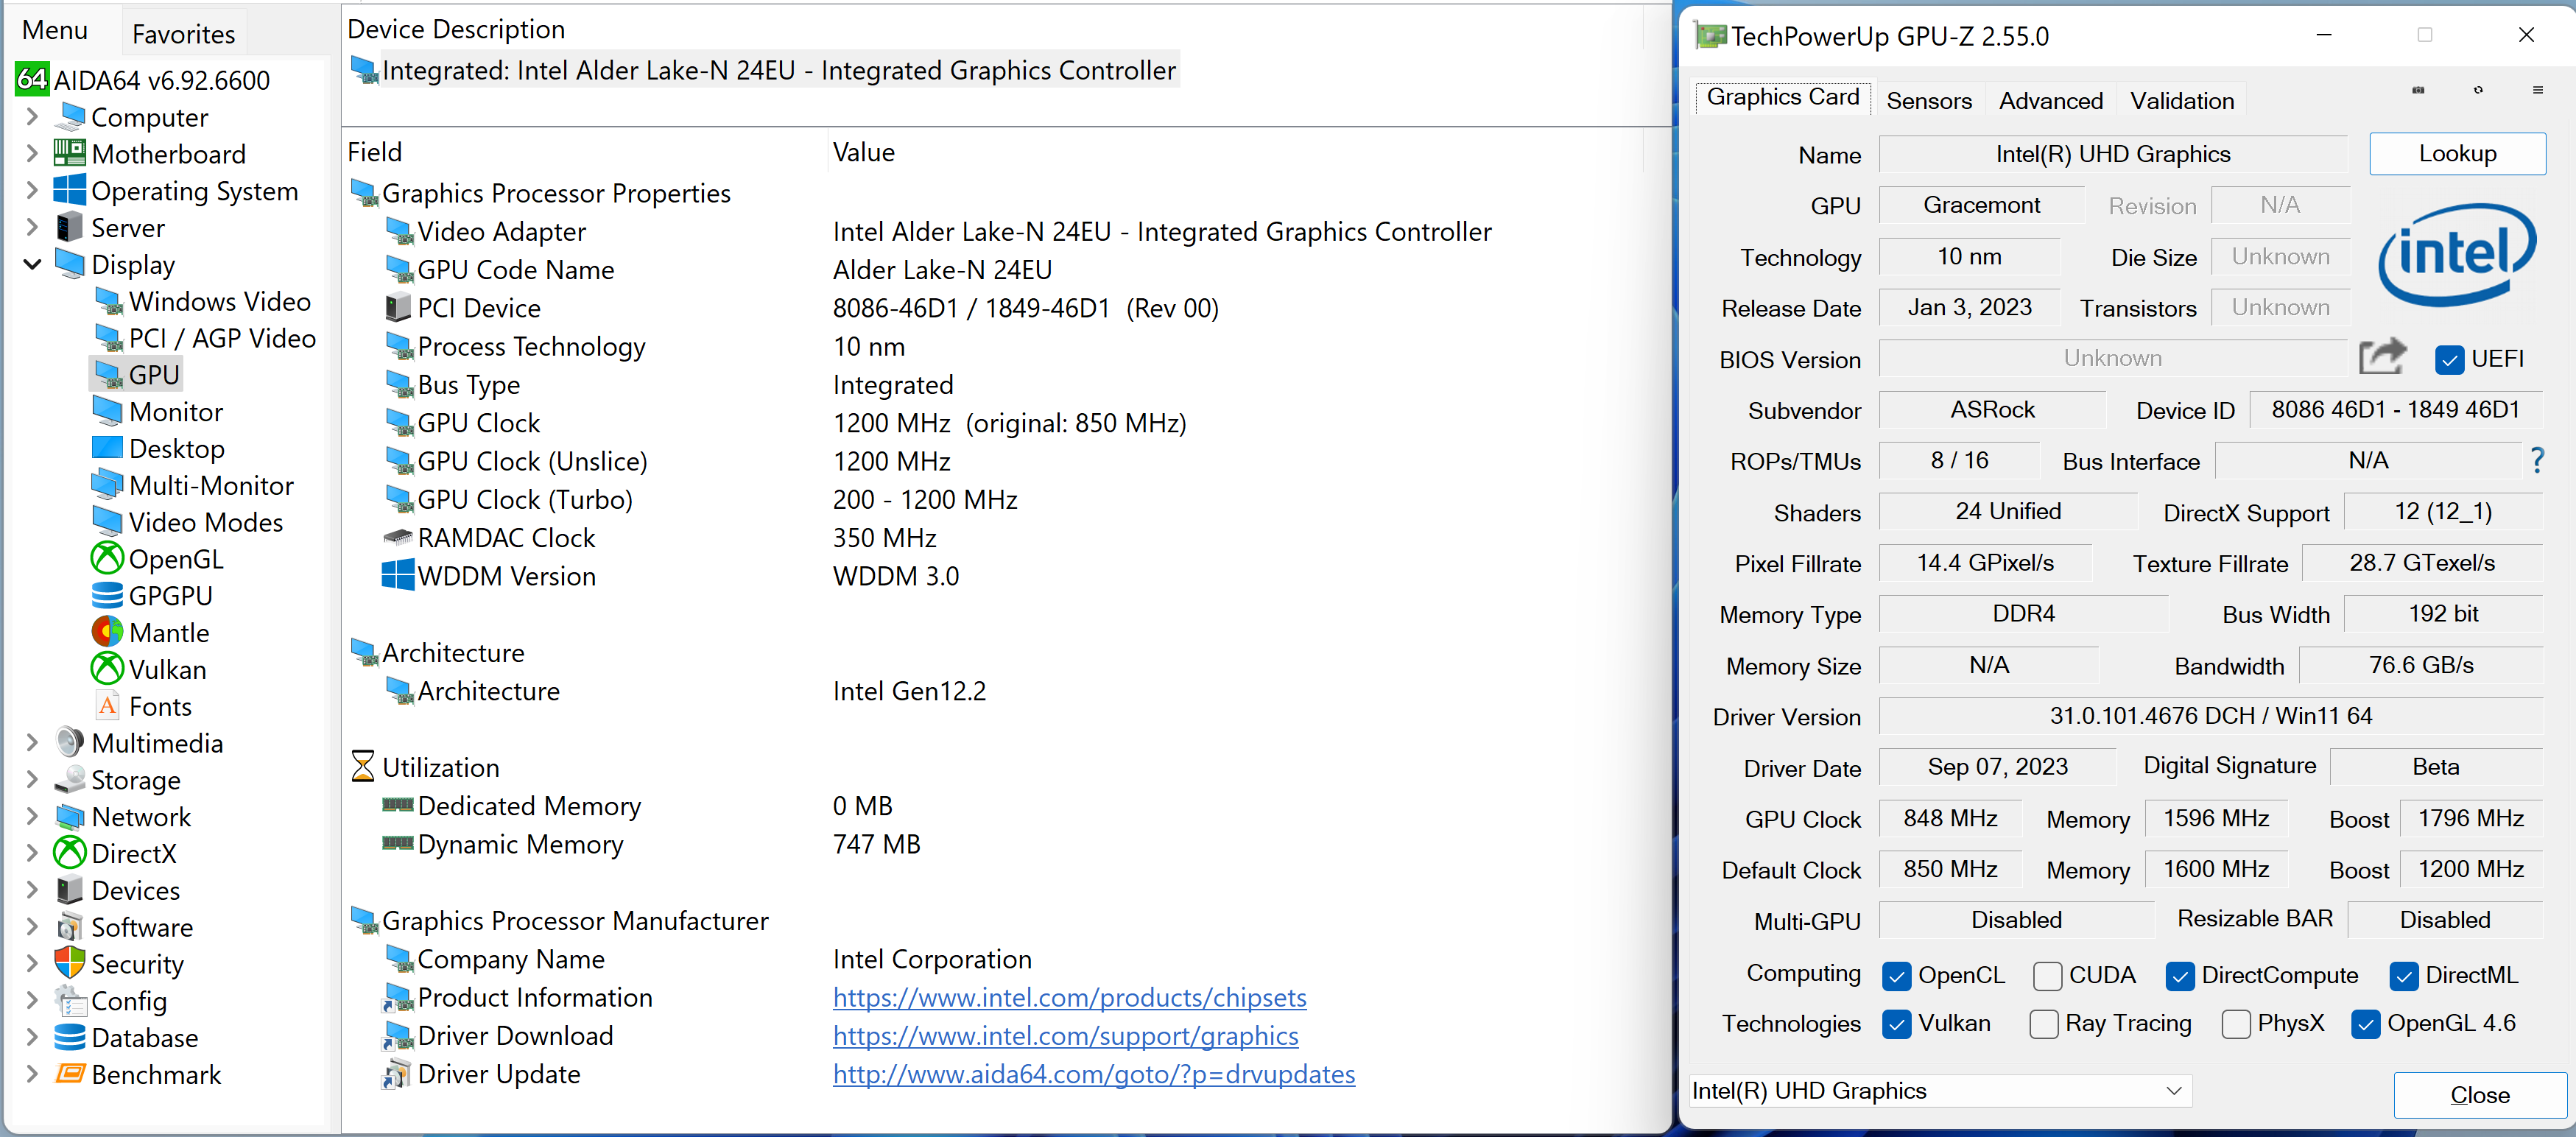
NUC BOX-N97 AIDA64 and GPU-Z GPU Information
The 1200 MHz boos clock in the NUC BOX-N97’s iGPU allows for pixel and texture fillrates of 14.4 Gpix/s and 28.7 GTex/s despite the DDR4 memory limiting memory bandwidth to 76.6 GBps.
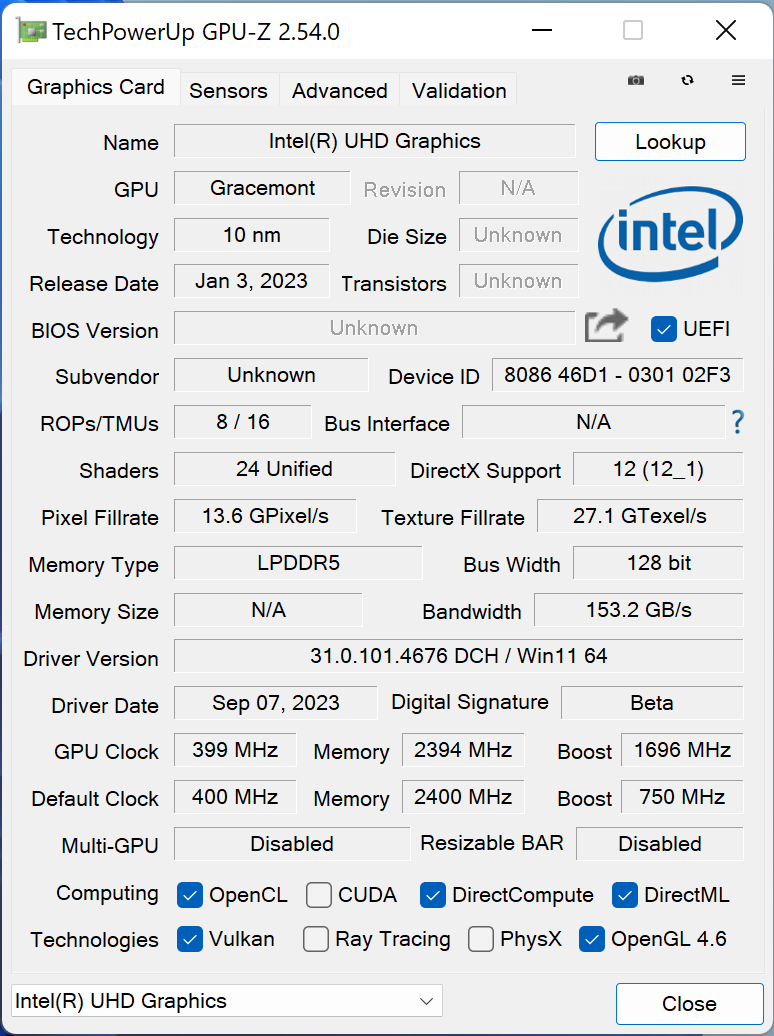
GMKtec NucBox G2 GPU-Z GPU Information
On the other hand, the 750 MHz clock of the N100’s iGPU lowers the pixel and texture fillrates despite the massive jump in the memory bandwidth to 153.2 GBps.
GFXBench
The DirectX 12-based GFXBench tests from Kishonti are cross-platform, and available all the way down to smartphones. As such, they are not very taxing for discrete GPUs and modern integrated GPUs. We processed the offscreen versions of the ‘Aztec Ruins’ benchmark.
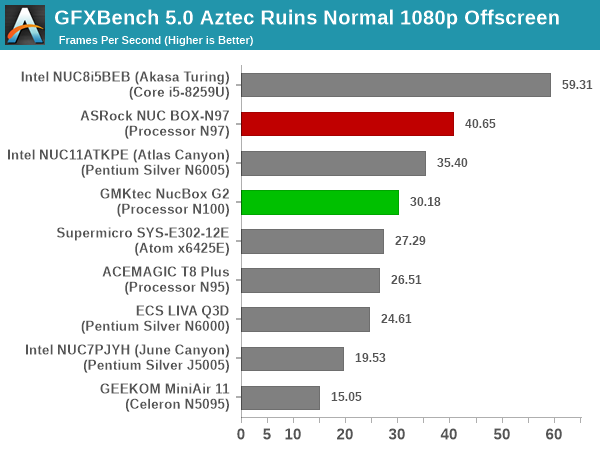

The N97’s faster iGPU clock enables a healthy lead for the NUC BOX-N97 over the other systems in both cases.
UL 3DMark
Four different workload sets were processed in 3DMark – Fire Strike, Time Spy, Night Raid, and Wild Life.
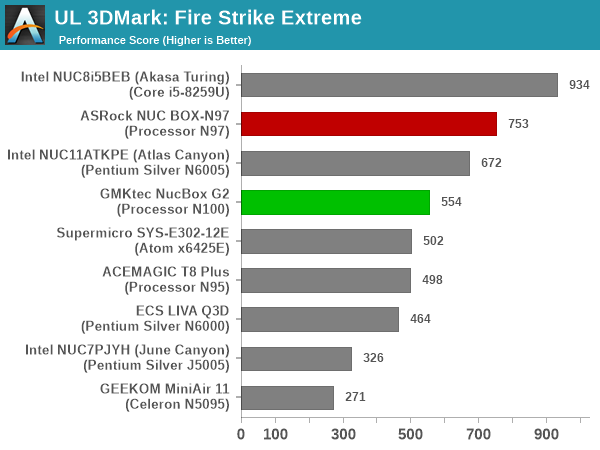
The Fire Strike benchmark has three workloads. The base version is meant for high-performance gaming PCs. It uses DirectX 11 (feature level 11) to render frames at 1920 x 1080. The Extreme version targets 1440p gaming requirements, while the Ultra version targets 4K gaming system, and renders at 3840 x 2160. The graph below presents the overall score for the Fire Strike Extreme and Fire Strike Ultra benchmark across all the systems that are being compared.
| UL 3DMark – Fire Strike Workloads | |||
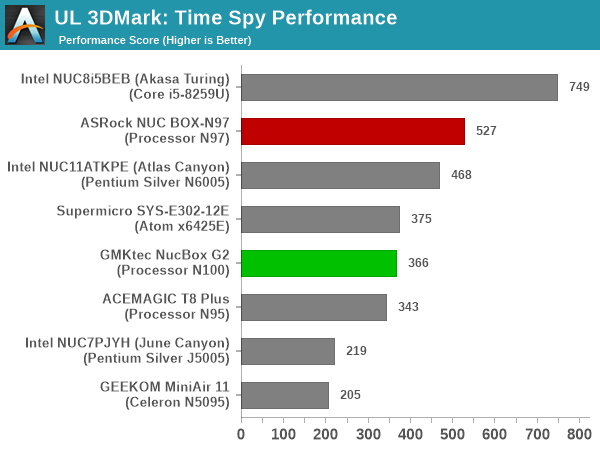
The Time Spy workload has two levels with different complexities. Both use DirectX 12 (feature level 11). However, the plain version targets high-performance gaming PCs with a 2560 x 1440 render resolution, while the Extreme version renders at 3840 x 2160 resolution. The graphs below present both numbers for all the systems that are being compared in this review.
| UL 3DMark – Time Spy Workloads | |||
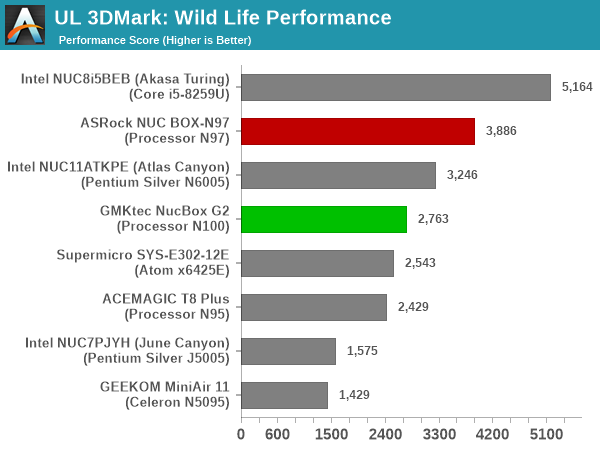
The Wild Life workload was initially introduced as a cross-platform GPU benchmark in 2020. It renders at a 2560 x 1440 resolution using Vulkan 1.1 APIs on Windows. It is a relatively short-running test, reflective of mobile GPU usage. In mid-2021, UL released the Wild Life Extreme workload that was a more demanding version that renders at 3840 x 2160 and runs for a much longer duration reflective of typical desktop gaming usage.
| UL 3DMark – Wild Life Workloads | |||
The Night Raid workload is a DirectX 12 benchmark test. It is less demanding than Time Spy, and is optimized for integrated graphics. The graph below presents the overall score in this workload for different system configurations.
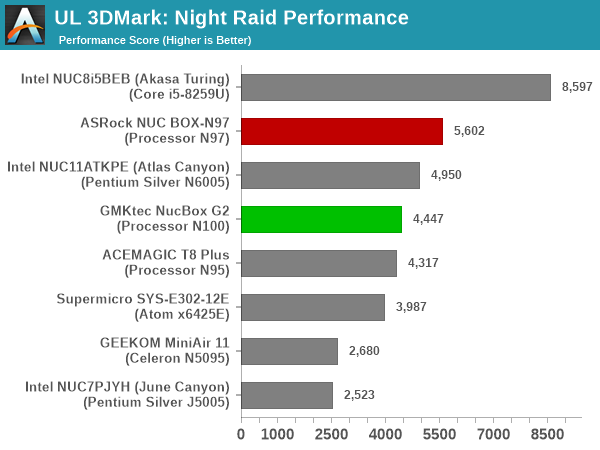
The relative performance of the different systems doesn’t change with workload or resolution. The 1.2 GHz iGPU in the NUC BOX-N97 takes the honors despite the weaker DDR4 memory subsystem. The Atlas Canyon NUC based on Jasper Lake manages to sneak in-between the NUC BOX-N97 and the NucBox G2 due to its higher EU count and 900 MHz clock, despite its previous-generation architecture.
One of the key drivers of advancements in computing systems is multi-tasking. On mobile devices, this is quite lightweight – cases such as background email checks while the user is playing a mobile game are quite common. Towards optimizing user experience in those types of scenarios, mobile SoC manufacturers started integrating heterogenous CPU cores – some with high performance for demanding workloads, while others were frugal in terms of both power consumption / die area and performance. This trend is now slowly making its way into the desktop PC space.
Multi-tasking in typical PC usage is much more demanding compared to phones and tablets. Desktop OSes allow users to launch and utilize a large number of demanding programs simultaneously. Responsiveness is dictated largely by the OS scheduler allowing different tasks to move to the background. The processor is required to work closely with the OS thread scheduler to optimize performance in these cases. Keeping these aspects in mind, the evaluation of multi-tasking performance is an interesting subject to tackle.
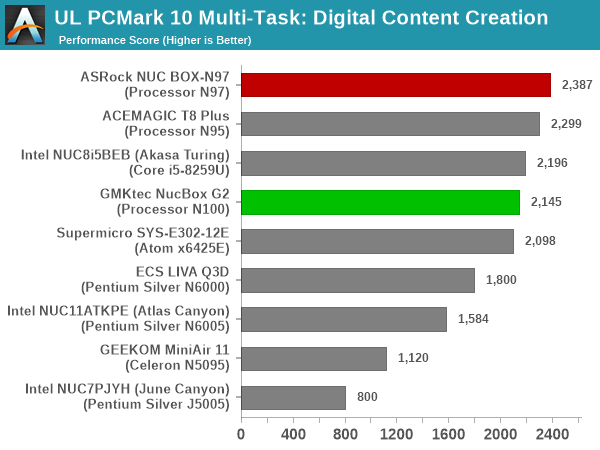
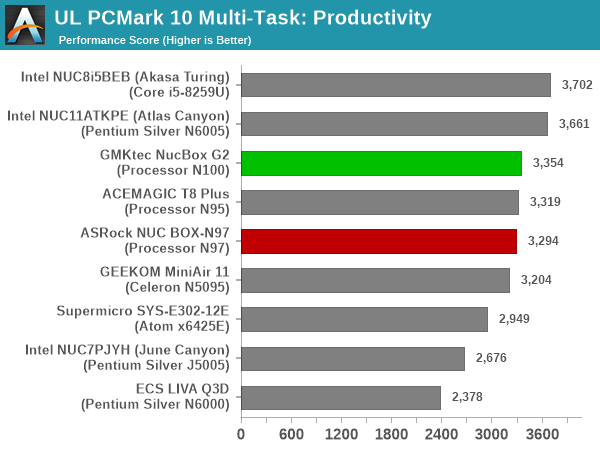
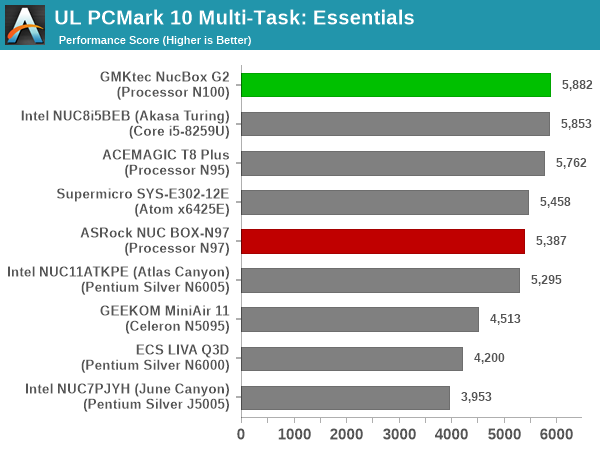
We have augmented our systems benchmarking suite to quantitatively analyze the multi-tasking performance of various platforms. The evaluation involves triggering a ffmpeg transcoding task to transform 1716 3840×1714 frames encoded as a 24fps AVC video (Blender Project’s ‘Tears of Steel’ 4K version) into a 1080p HEVC version in a loop. The transcoding rate is monitored continuously. One complete transcoding pass is allowed to complete before starting the first multi-tasking workload – the PCMark 10 Extended bench suite. A comparative view of the PCMark 10 scores for various scenarios is presented in the graphs below. Also available for concurrent viewing are scores in the normal case where the benchmark was processed without any concurrent load, and a graph presenting the loss in performance.
| UL PCMark 10 Load Testing – Digital Content Creation Scores | |||
| UL PCMark 10 Load Testing – Productivity Scores | |||
| UL PCMark 10 Load Testing – Essentials Scores | |||
| UL PCMark 10 Load Testing – Gaming Scores | |||

| UL PCMark 10 Load Testing – Overall Scores | |||
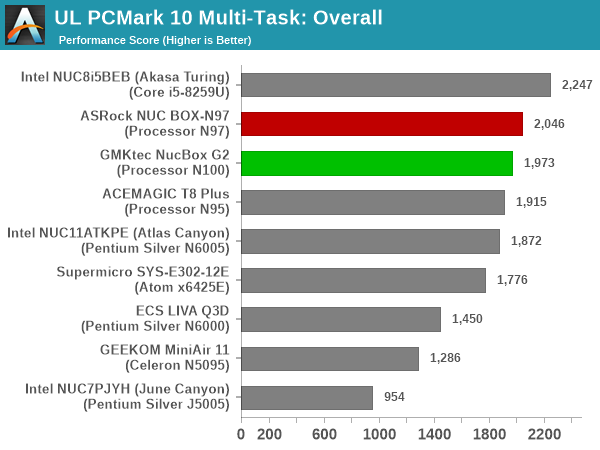
Since none of the systems being considered in the graph above have heterogeneous cores, it is no surprise that the relative ordering of various systems remains the same irrespective of the presence of concurrent loading.
Following the completion of the PCMark 10 benchmark, a short delay is introduced prior to the processing of Principled Technologies WebXPRT4 on MS Edge. Similar to the PCMark 10 results presentation, the graph below show the scores recorded with the transcoding load active. Available for comparison are the dedicated CPU power scores and a measure of the performance loss.
| Principled Technologies WebXPRT4 Load Testing Scores (MS Edge) | |||
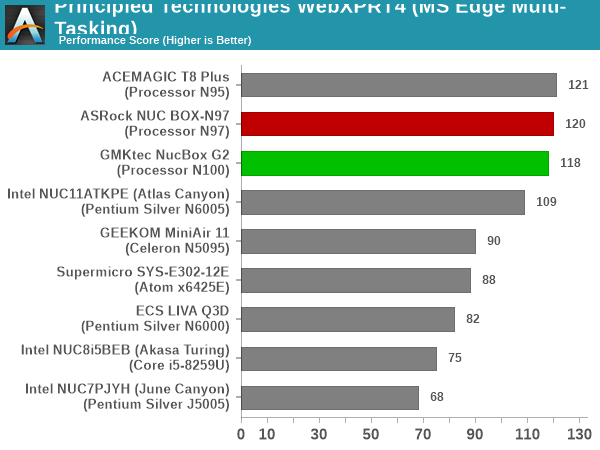
In the absence of thermal throttling, the systems have minimal performance loss. The ones with a higher PL1 / PL2 value fare better in that aspect.
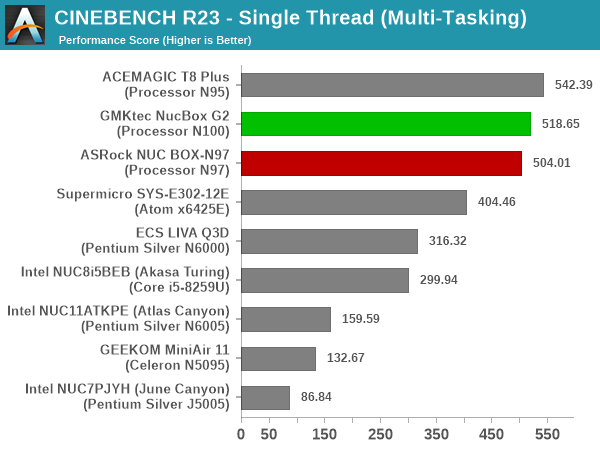
The final workload tested as part of the multitasking evaluation routine is CINEBENCH R23.
| 3D Rendering – CINEBENCH R23 Load Testing – Single Thread Score | |||
| 3D Rendering – CINEBENCH R23 Load Testing – Multiple Thread Score | |||
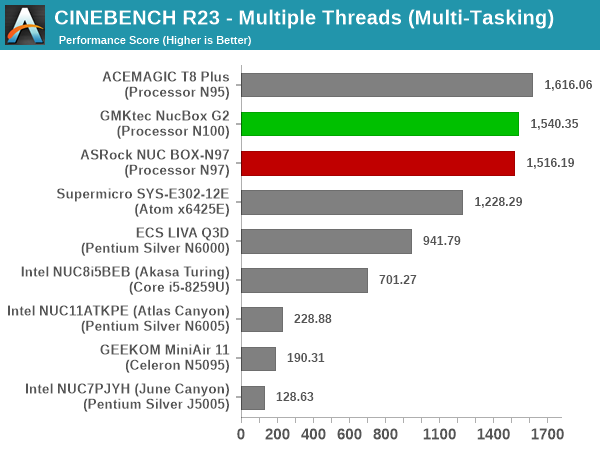
Similar to software transcoding, rendering is also quite CPU intensive with barely any recovery time possible for the CPU between operations. Therefore, it is no surprise that loss in performance ranges from 35% to 90%. A look at the impact to the transcoding rate during this segment would provide more insight on how the system handles concurrent workloads.
After the completion of all the workloads, we let the transcoding routine run to completion. The monitored transcoding rate throughout the above evaluation routine (in terms of frames per second) is graphed below.

| ASRock Industrial NUC BOX-N97 (Intel Processor N97) ffmpeg Transcoding Rate (Multi-Tasking Test) | |||
| Task Segment | Transcoding Rate (FPS) | ||
| Minimum | Average | Maximum | |
| Transcode Start Pass | 0 | 3.5 | 21.5 |
| PCMark 10 | 0 | 2.6 | 12.5 |
| WebXPRT 4 | 0 | 3.05 | 7 |
| Cinebench R23 | 0 | 1.81 | 7 |
| Transcode End Pass | 0 | 3.49 | 15 |
A similar set of results for the GMKtec NucBox G2 is presented below.
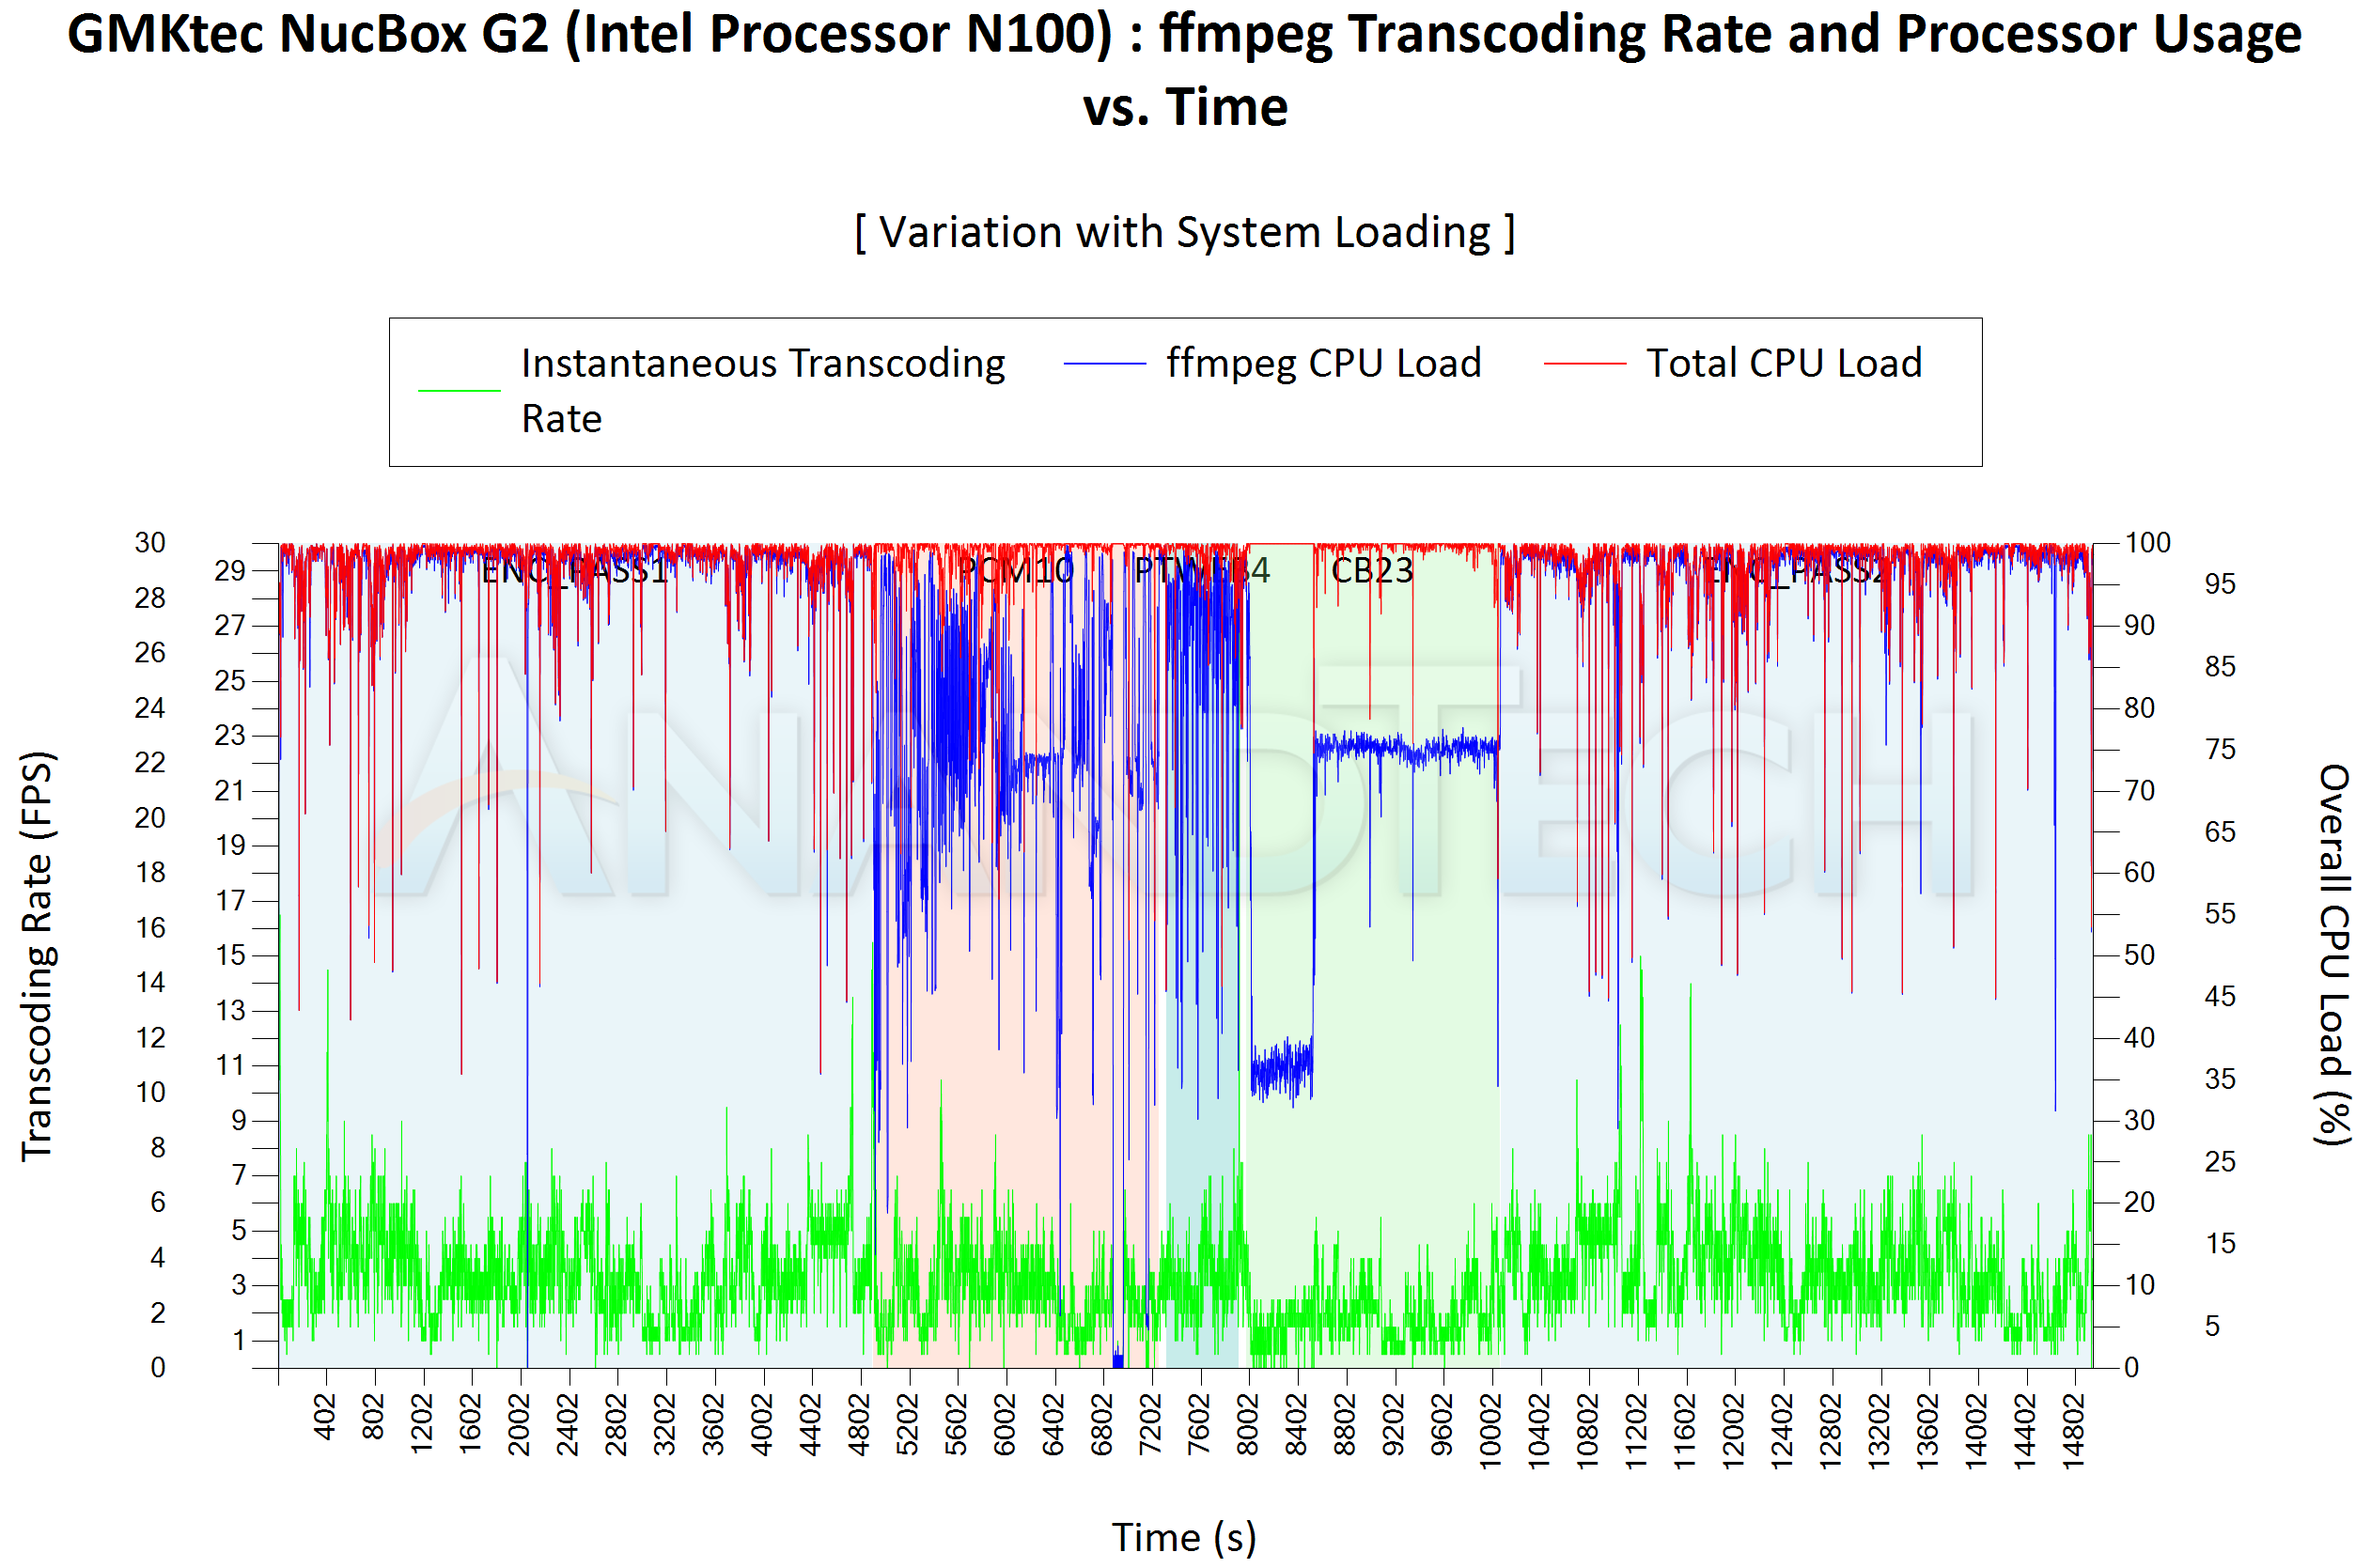
| GMKtec NucBox G2 (Intel Processor N100) ffmpeg Transcoding Rate (Multi-Tasking Test) | |||
| Task Segment | Transcoding Rate (FPS) | ||
| Minimum | Average | Maximum | |
| Transcode Start Pass | 0 | 3.6 | 22 |
| PCMark 10 | 0 | 2.75 | 11.5 |
| WebXPRT 4 | 0.5 | 3.3 | 8 |
| Cinebench R23 | 0 | 1.9 | 6 |
| Transcode End Pass | 0 | 3.61 | 15 |
The impact of concurrent loading on both the NUC BOX-N97 and the NucBox G2 is largely similar. This is not a surprise given the same core counts and similar PL1 / PL2 values.
The 2022 Q4 update to our system reviews brings an updated HTPC evaluation suite for systems. After doing away with the evaluation of display refresh rate stability and Netflix streaming evaluation, the local media playback configurations have also seen a revamp. This section details each of the workloads processed on the ASRock NUC BOX-N97 and the GMKtec NucBox G2 as part of the HTPC suite.
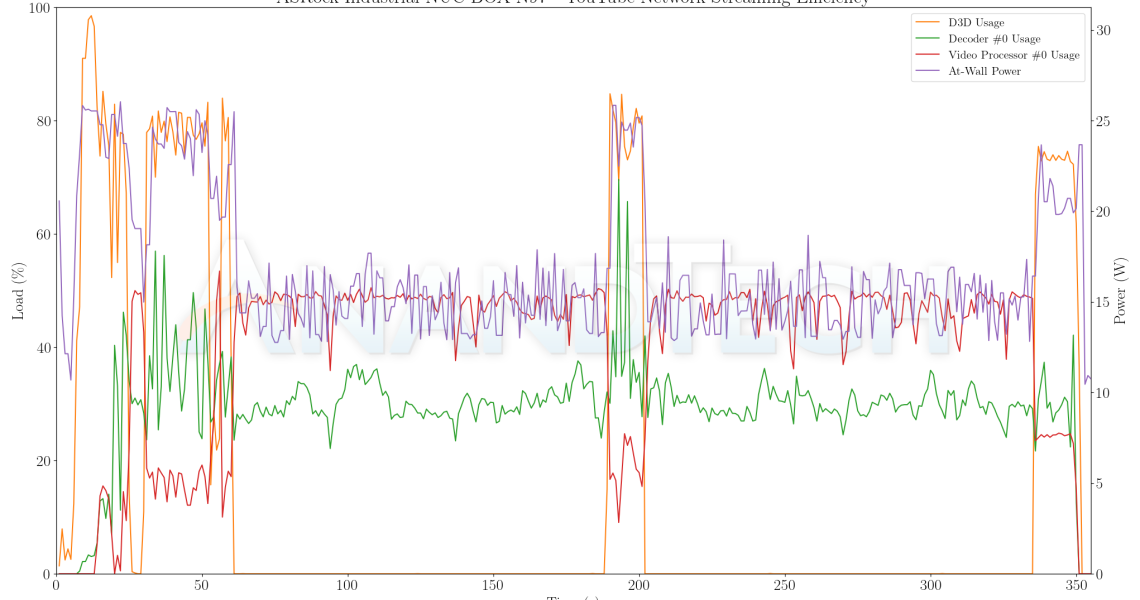
YouTube Streaming Efficiency
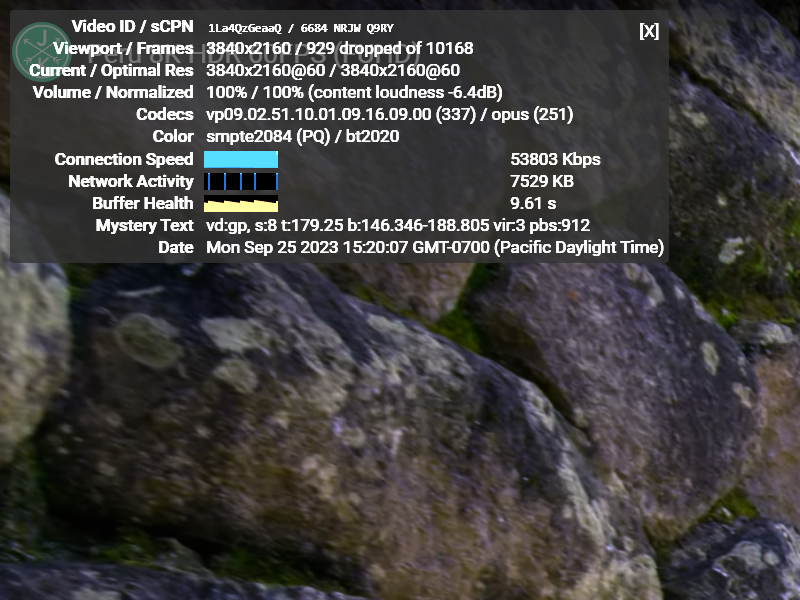
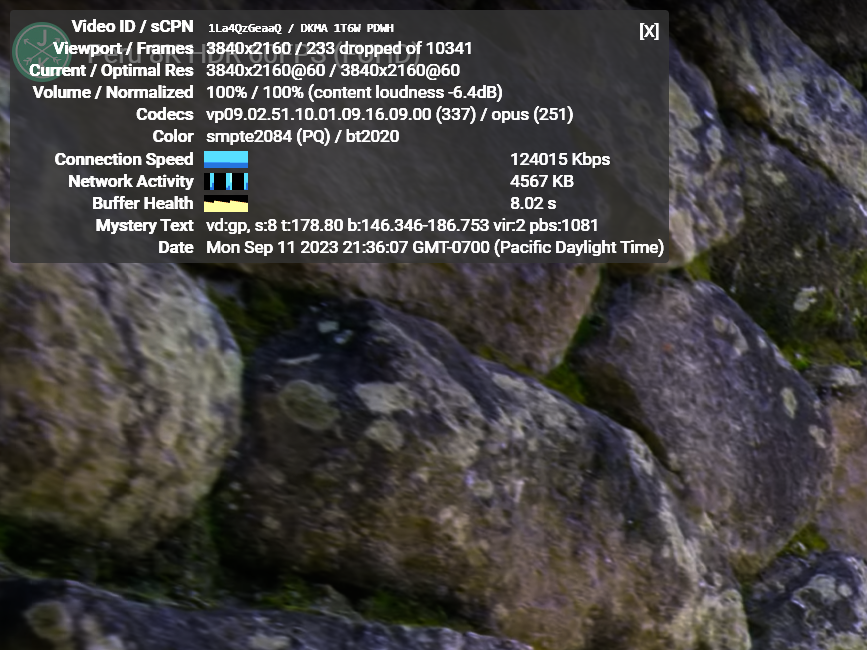
YouTube continues to remain one of the top OTT platforms, primarily due to its free ad-supported tier. Our HTPC test suite update retains YouTube streaming efficiency evaluation as a metric of OTT support in different systems. Mystery Box’s Peru 8K HDR 60FPS video is the chosen test sample. On PCs running Windows, it is recommended that HDR streaming videos be viewed using the Microsoft Edge browser after putting the desktop in HDR mode.
ASRock Industrial NUC BOX-N97 Plus YouTube Streaming Statistics
GMKtec NucBox G2 YouTube Streaming Statistics
The iGPUs in both systems support the hardware decoding of VP9 Profile 2, and we see the stream encoded with that codec being played back. The streaming is perfect, thanks to the powerful GPU and hardware decoding support, but it needs to be noted that activation of overlays of any sort triggers dropped frames.
The streaming efficiency-related aspects such as GPU usage and at-wall power consumption are also graphed below.
| YouTube Network Streaming Efficiency | |||
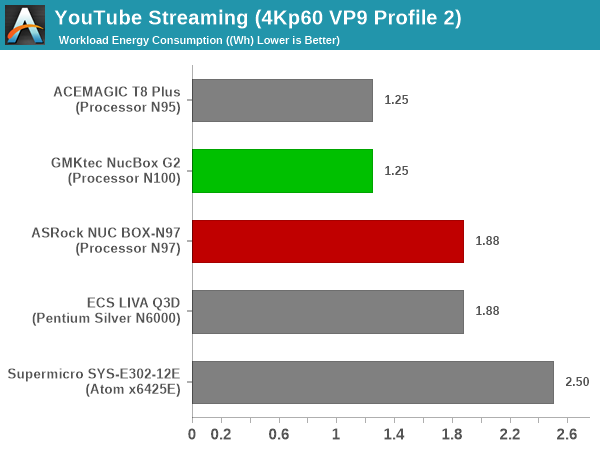
The lower-clocked iGPU in the NucBox G2 is sufficient to ensure seamless playback. A welcome side-effect is that it ends up consuming lesser energy for the whole playback compared to the NUC BOX-N97 with its faster iGPU.
Hardware-Accelerated Encoding and Decoding
The transcoding benchmarks in the systems performance section presented results from evaluating the QuickSync encoder within Handbrake’s framework. The capabilities of the decoder engine are brought out by DXVAChecker. The output is the same for both systems.
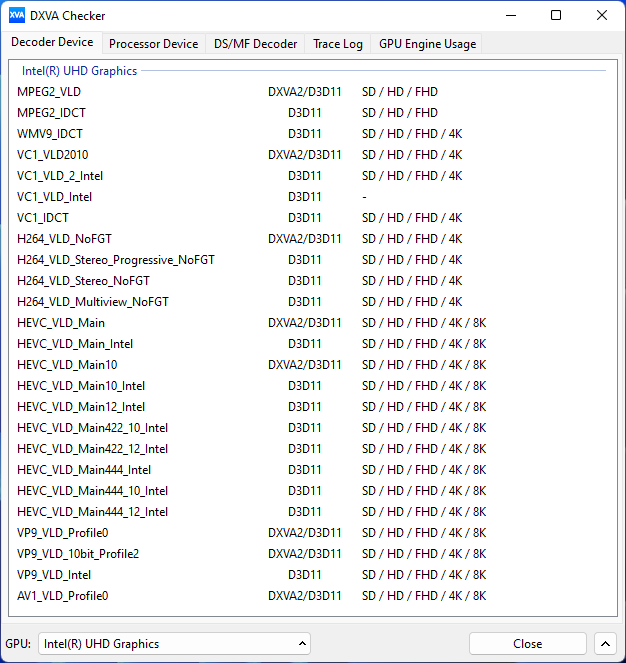
Video Decoding Hardware Acceleration in the ASRock Industrial NUC BOX-N97 and the GMKtec NucBox G2
ADL-N includes HEVC 4:2:2 and 4:4:4 12-bit decode support. It also supports AV1.
Local Media Playback
Evaluation of local media playback and video processing is done by playing back files encompassing a range of relevant codecs, containers, resolutions, and frame rates. A note of the efficiency is also made by tracking GPU usage and power consumption of the system at the wall. Users have their own preference for the playback software / decoder / renderer, and our aim is to have numbers representative of commonly encountered scenarios. Our Q4 2022 test suite update replaces MPC-HC (in LAV filters / madVR modes) with mpv. In addition to being cross-platform and open-source, the player allows easy control via the command-line to enable different shader-based post-processing algorithms. From a benchmarking perspective, the more attractive aspect is the real-time reporting of dropped frames in an easily parseable manner. The players / configurations considered in this subsection include:
- VLC 3.0.18
- Kodi 20.0b1
- mpv 0.35 (hwdec auto, vo=gpu-next)
- mpv 0.35 (hwdec auto, vo=gpu-next, profile=gpu-hq)
Fourteen test streams (each of 90s duration) were played back from the local disk with an interval of 30 seconds in-between. Various metrics including GPU usage, at-wall power consumption, and total energy consumption were recorded during the course of this playback.
All our playback tests were done with the desktop HDR setting turned on. It is possible for certain system configurations to automatically turn on/off the HDR capabilities prior to the playback of a HDR video, but, we didn’t take advantage of that in our testing.
| VLC 3.0.18 Playback Efficiency | |||
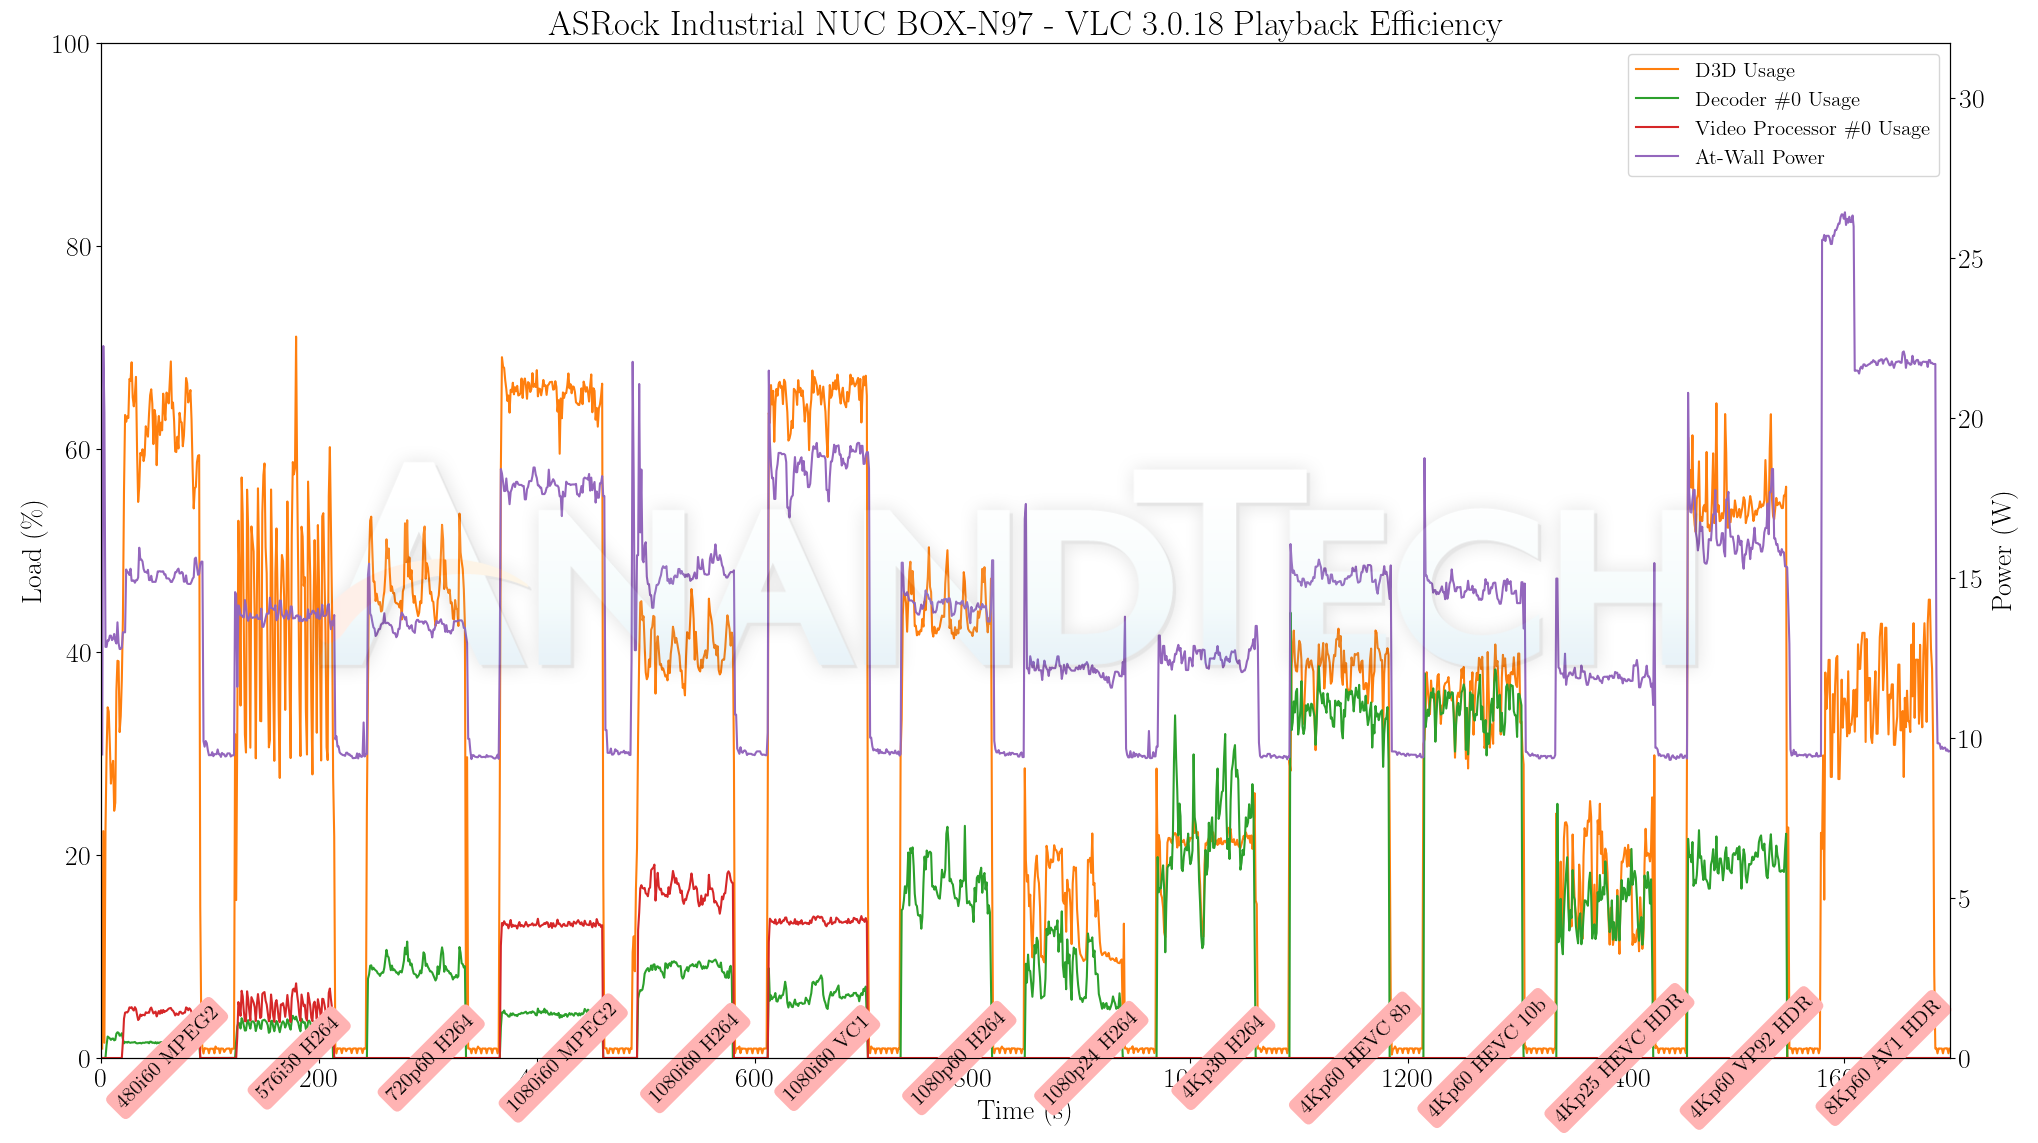
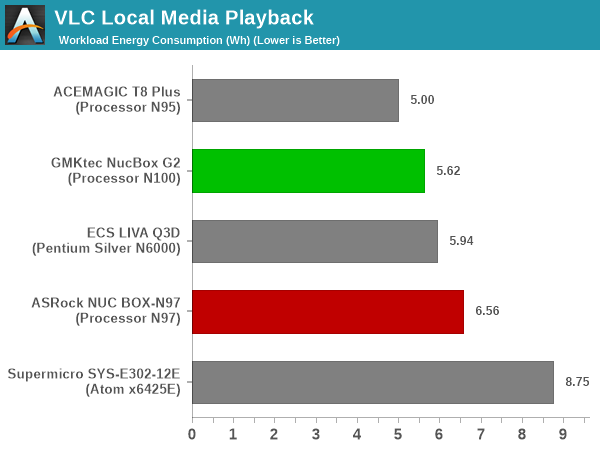
It must be kept in mind that the T8 Plus number graphed above is for non-HDR playback. Despite AV1 acceleration being reported in DXVAChecker, the decoding of the AV1 clip in software resulted in a slideshow with more than 50% of the frames getting dropped. In terms of energy consumption, it is no surprise that the lower clock rate in the iGPU of the NucBox G2 helps it achieve low numbers compared to the rest.
| Kodi 20.2 Playback Efficiency | |||
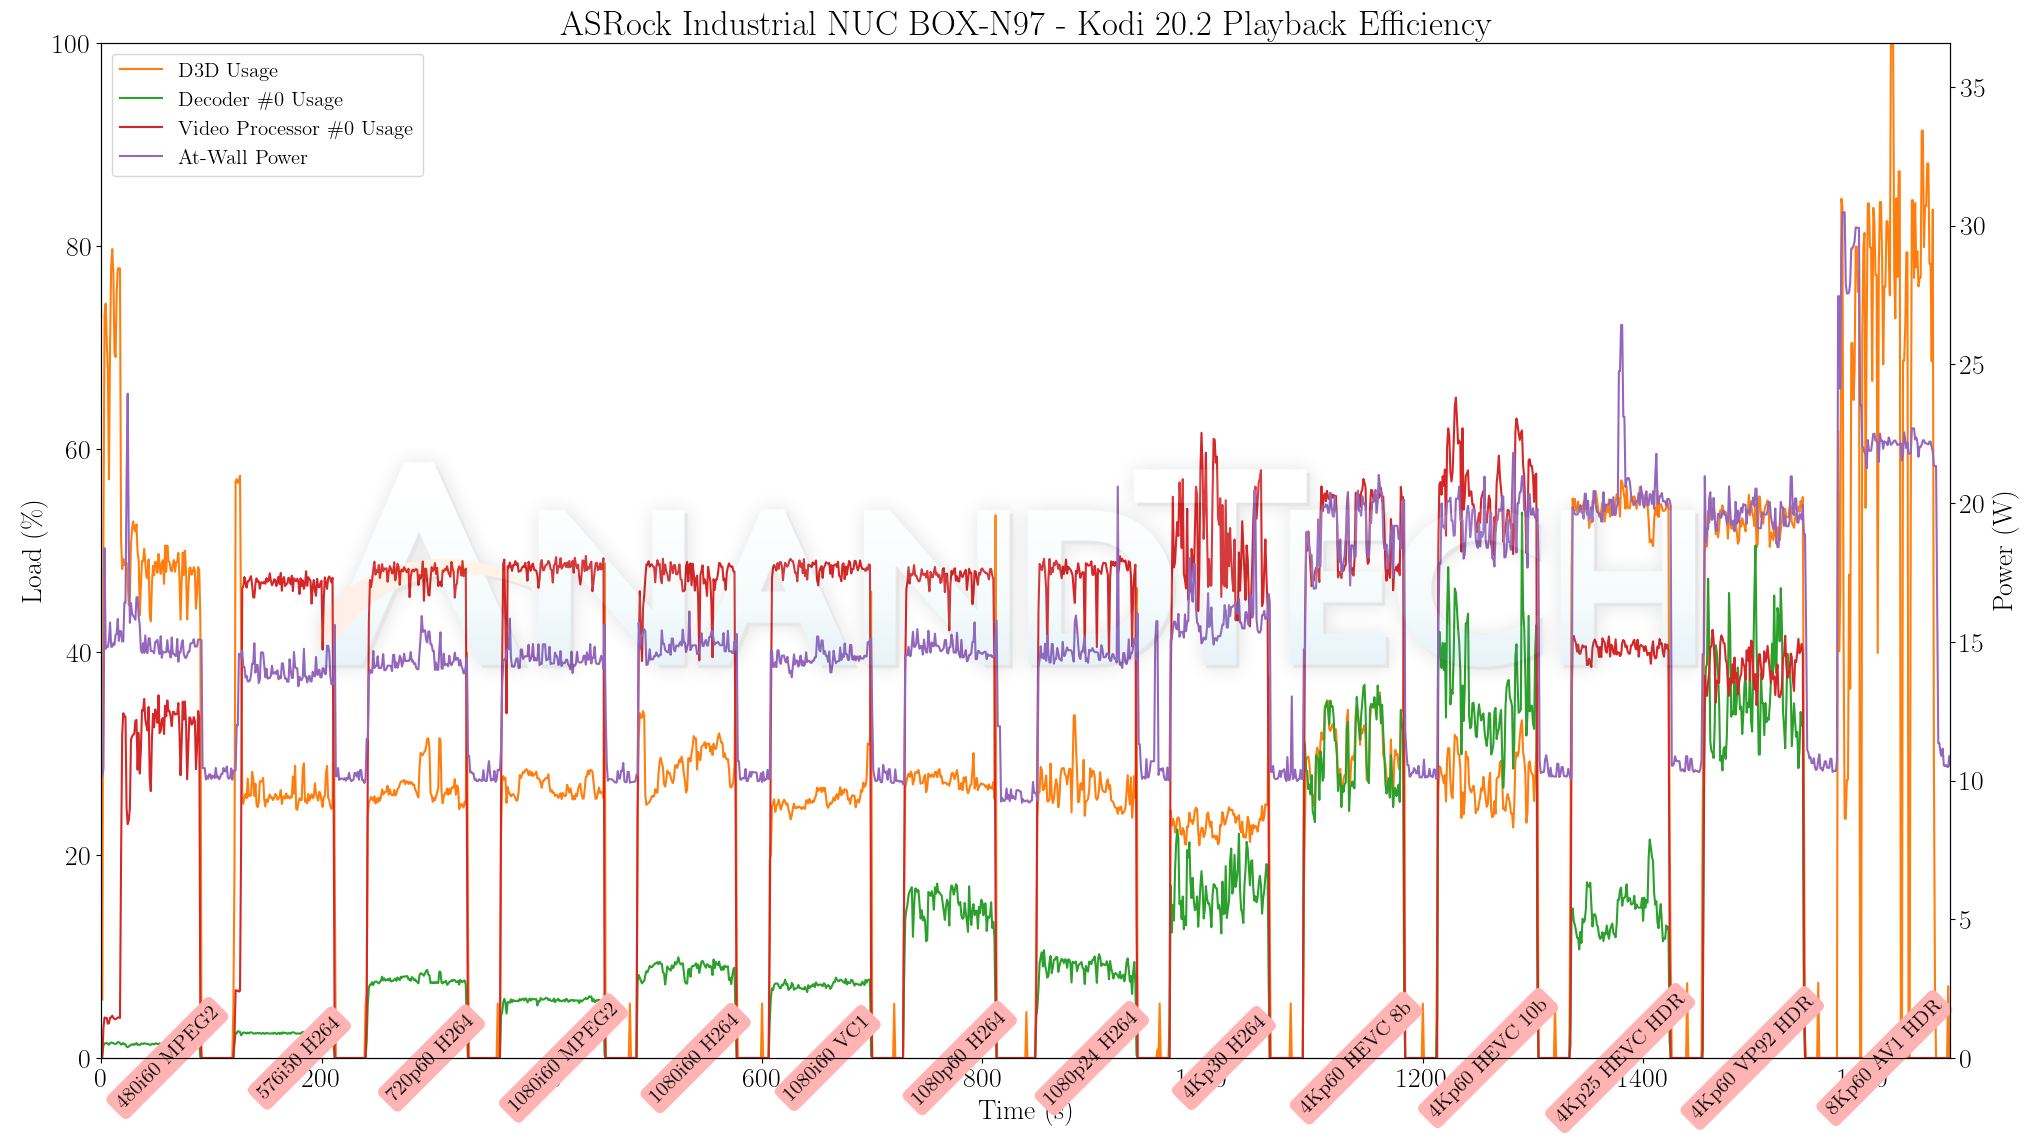
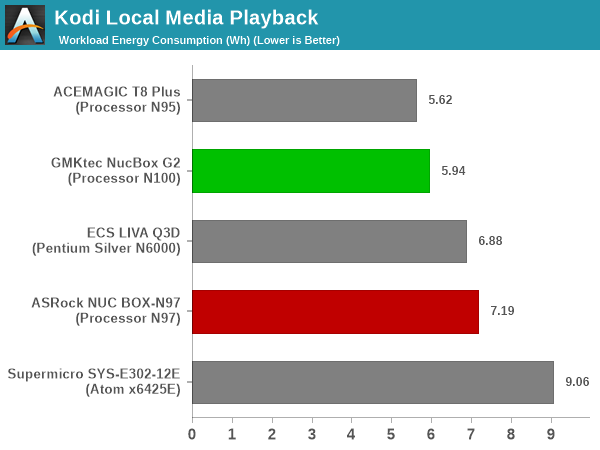
Kodi is also yet to take advantage of AV1 decode acceleration in ADL-N. Other than that clip, the rest played back successfully. The NucBox G2 turns out to be the most energy-efficient of the HDR lot.
| mpv 0.35.1 Playback Efficiency | |||
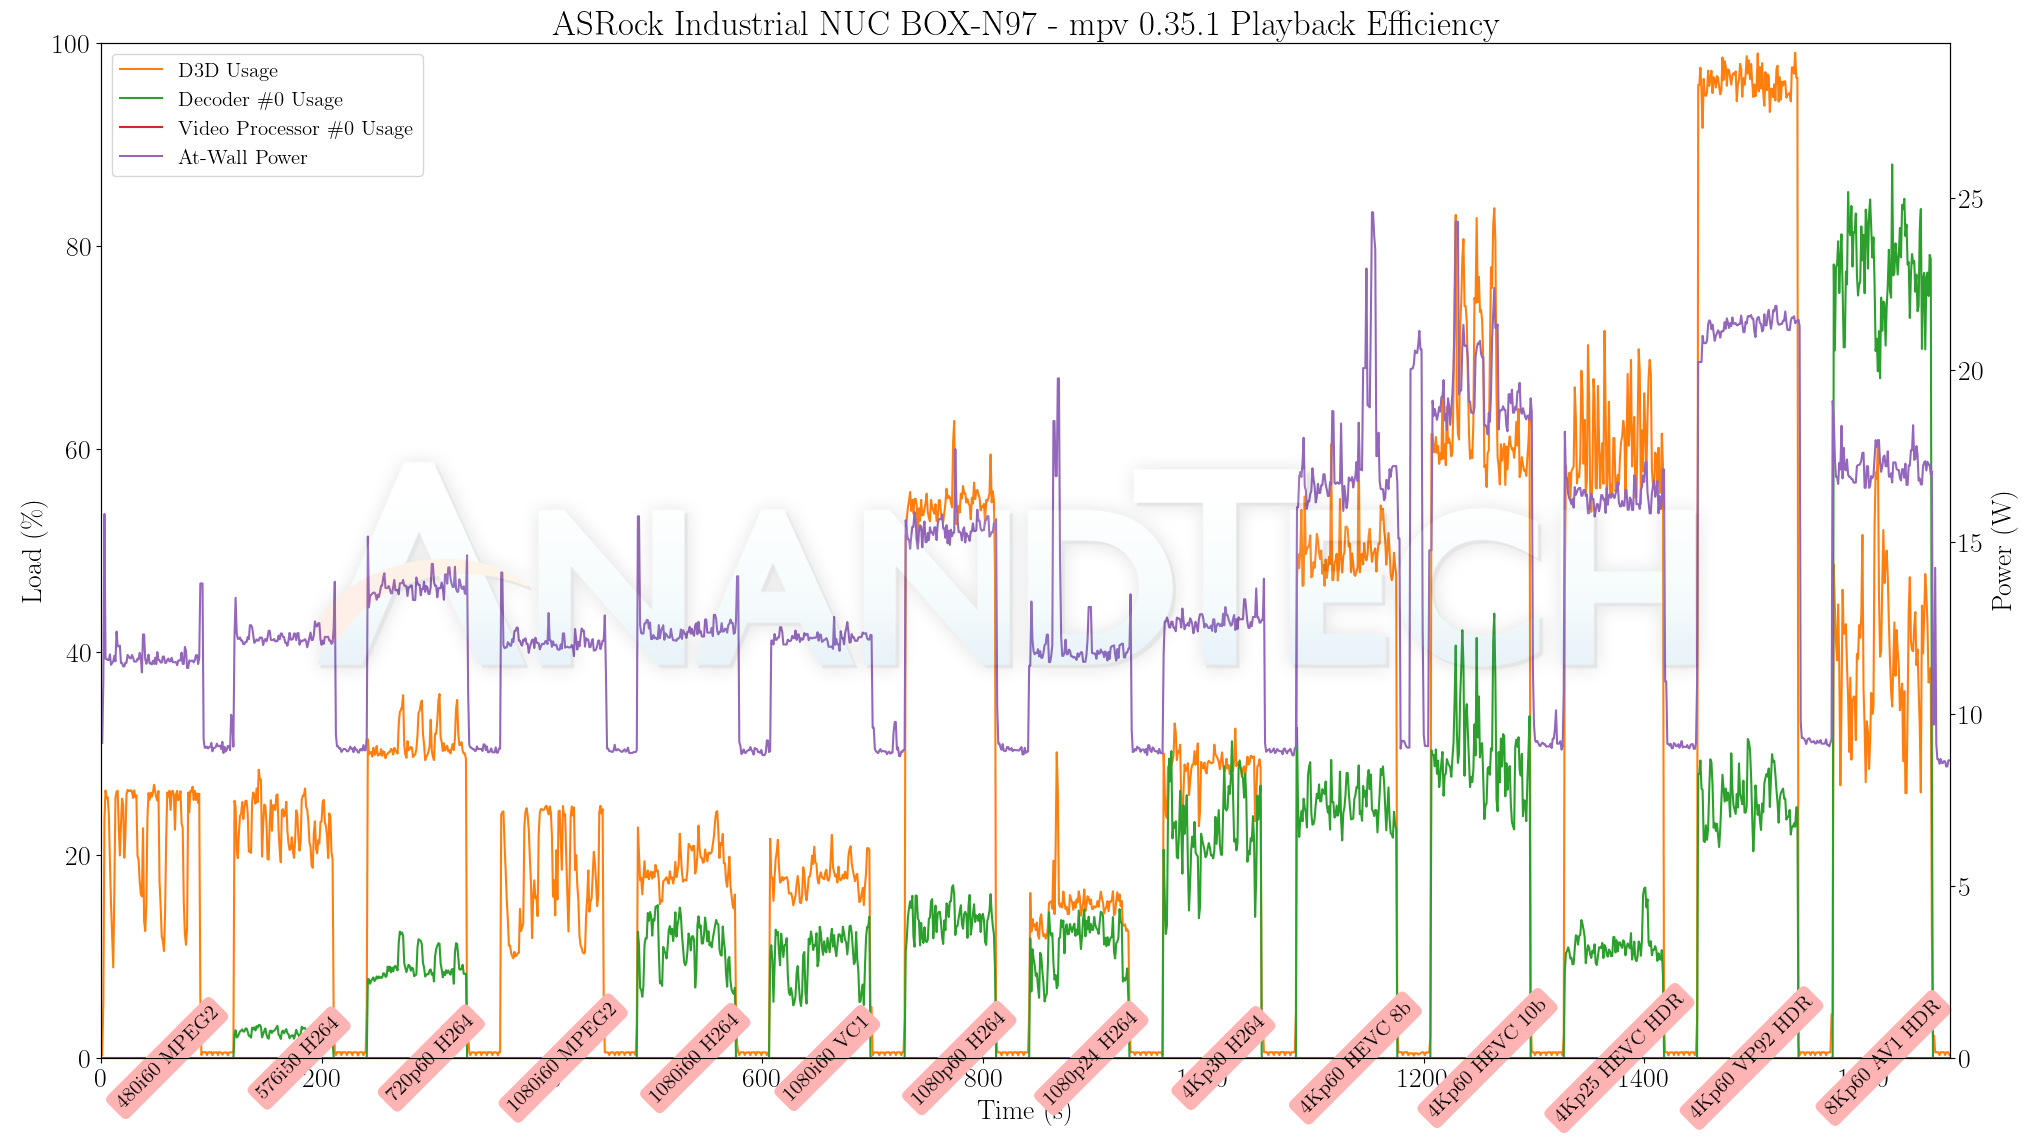
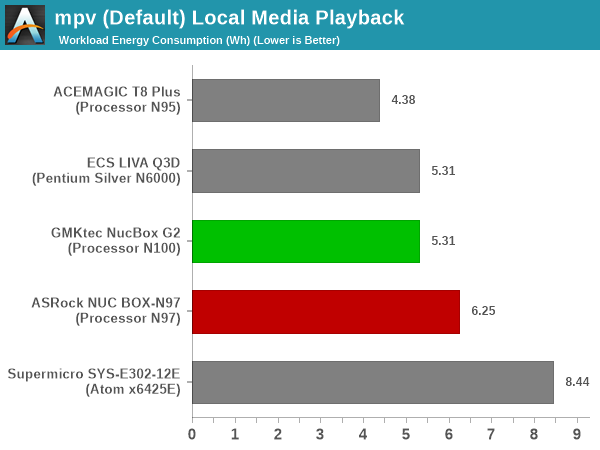
AV1 hardware decode is selected and activated, but some rendering issues prevent the actual presentation on screen. The 8Kp60 AV1 clip dropped approximately half the frames, but it is clearly a software issue that needs to be overcome.
| mpv 0.35.1 (GPU-HQ) Playback Efficiency | |||
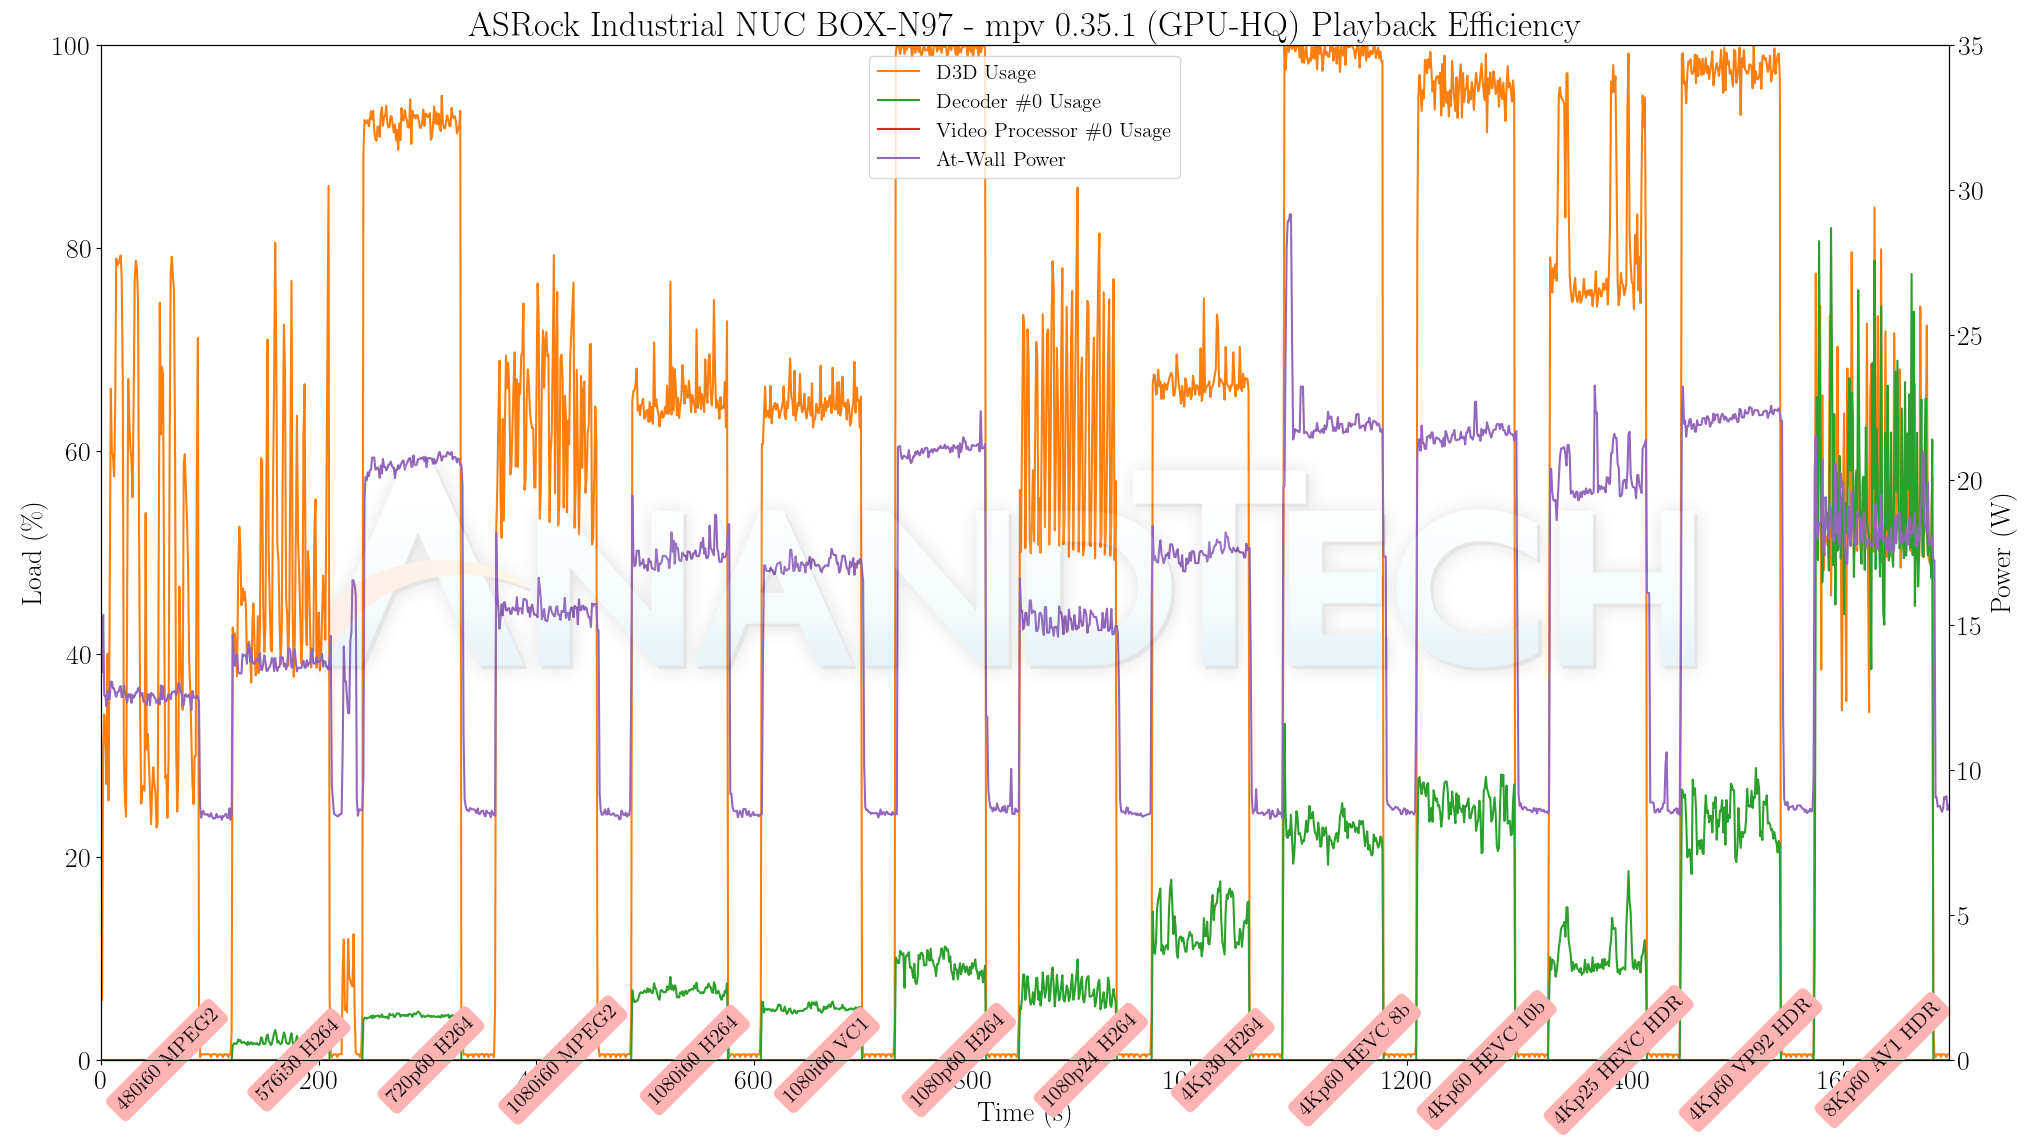
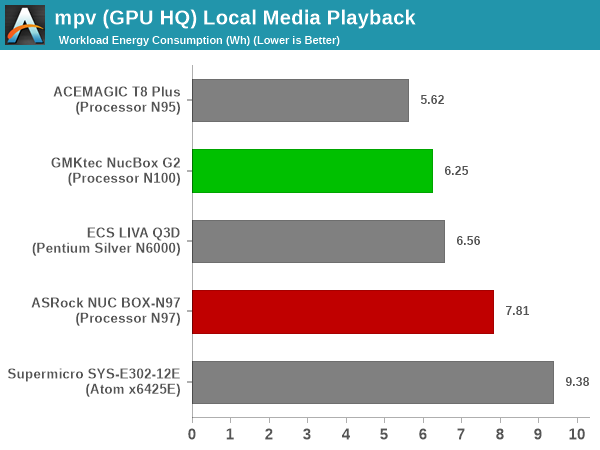
With GPU shader activity in the picture, the playback of most streams with the GPU-HQ profile in mpv 0.35.1 ended up being unwatchable due to the unreasonable D3D usage graphed above.
The power consumption at the wall was measured with a 4K display being driven through the HDMI port of the system. In the graph below, we compare the idle and load power of the ASRock Industrial NUC BOX-N97 and the GMKtec NucBox G2 with other systems evaluated before. For load power consumption, we ran the AIDA64 System Stability Test with various stress components, as well as our custom stress test with Prime95 / Furmark, and noted the peak as well as idling power consumption at the wall.
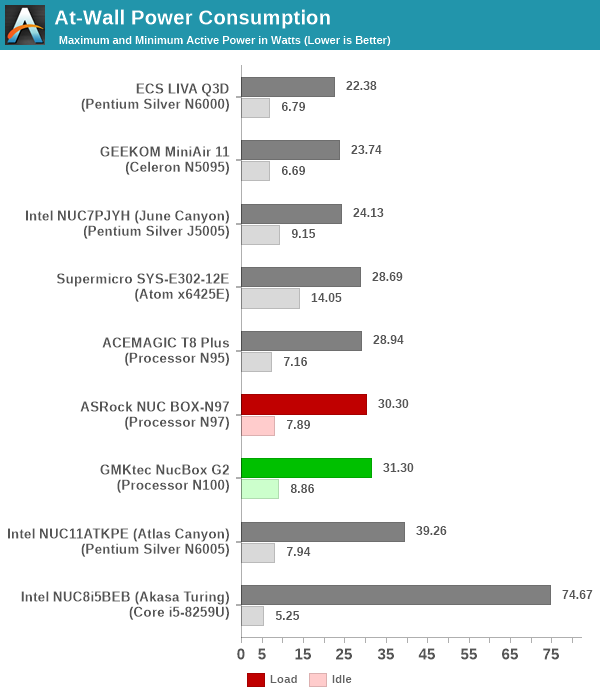
The numbers are consistent with the TDP and suggested PL1 / PL2 values for the processors in the systems, and do not come as any surprise. The idling numbers are reasonable, but for some reason, they are not as good as what Intel was able to achieve in their Wall Street Canyon and Arena Canyon NUCs (around 5W).
Stress Testing
Our thermal stress routine is a combination of Prime95, Furmark, and Finalwire’s AIDA64 System Stability Test. The following 9-step sequence is followed, starting with the system at idle:
- Start with the Prime95 stress test configured for maximum power consumption
- After 30 minutes, add Furmark GPU stress workload
- After 30 minutes, terminate the Prime95 workload
- After 30 minutes, terminate the Furmark workload and let the system idle
- After 30 minutes of idling, start the AIDA64 System Stress Test (SST) with CPU, caches, and RAM activated
- After 30 minutes, terminate the previous AIDA64 SST and start a new one with the GPU, CPU, caches, and RAM activated
- After 30 minutes, terminate the previous AIDA64 SST and start a new one with only the GPU activated
- After 30 minutes, terminate the previous AIDA64 SST and start a new one with the CPU, GPU, caches, RAM, and SSD activated
- After 30 minutes, terminate the AIDA64 SST and let the system idle for 30 minutes
Traditionally, this test used to record the clock frequencies – however, with the increasing number of cores in modern processors and fine-grained clock control, frequency information makes the graphs cluttered and doesn’t contribute much to understanding the thermal performance of the system. The focus is now on the power consumption and temperature profiles to determine if throttling is in play.
| Custom Stress Test – Power Consumption Profile | |||
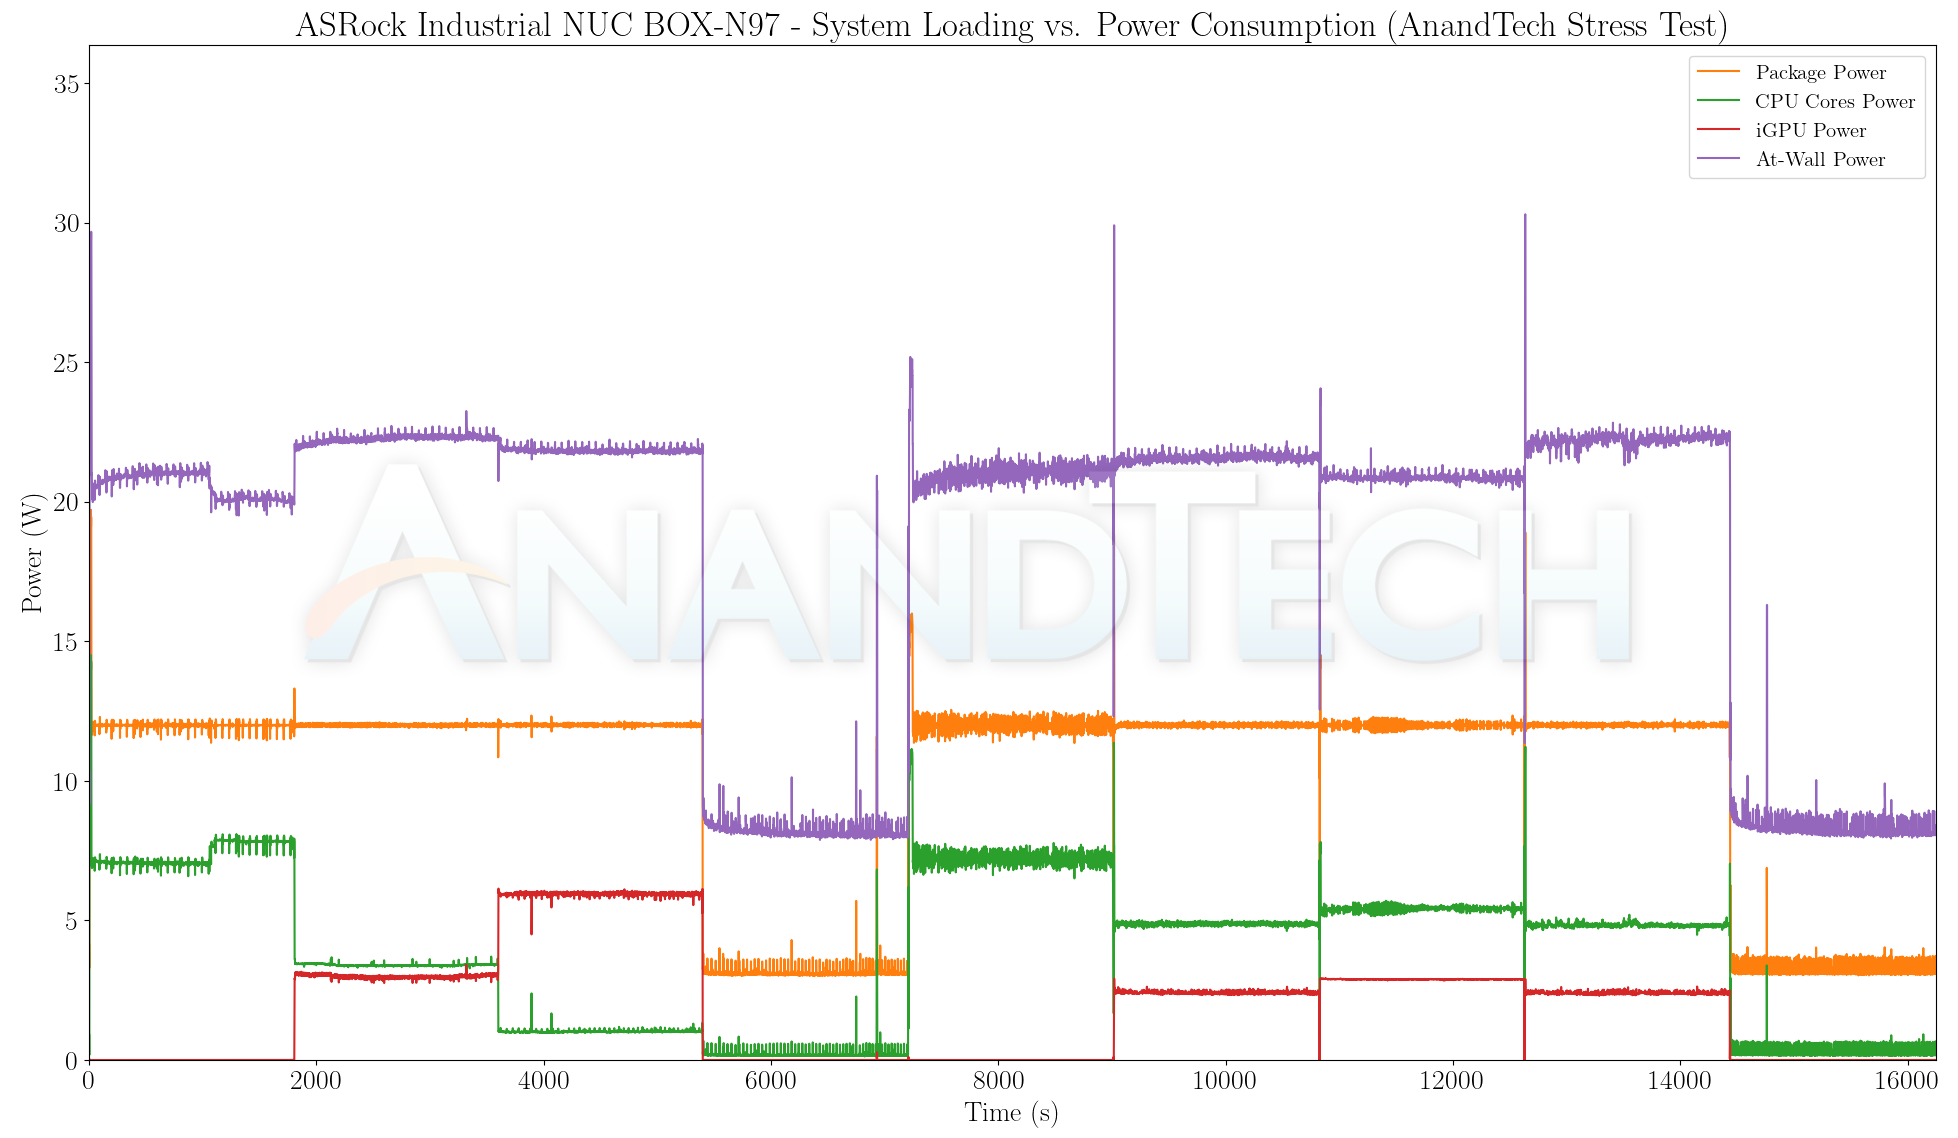
We can see spikes to PL2 values for a very brief period in both systems before the package power stabilizes at the configured PL1 values – 12W for the ASRock NUC BOX-N97 and 10W for the GMKtec NucBox G2. Of additional interest is the maximum allowed iGPU power consumption. The N97 budgets 6W, while the N100 budgets 5W in the two evaluated systems.
| Custom Stress Test – Temperature Profile | |||
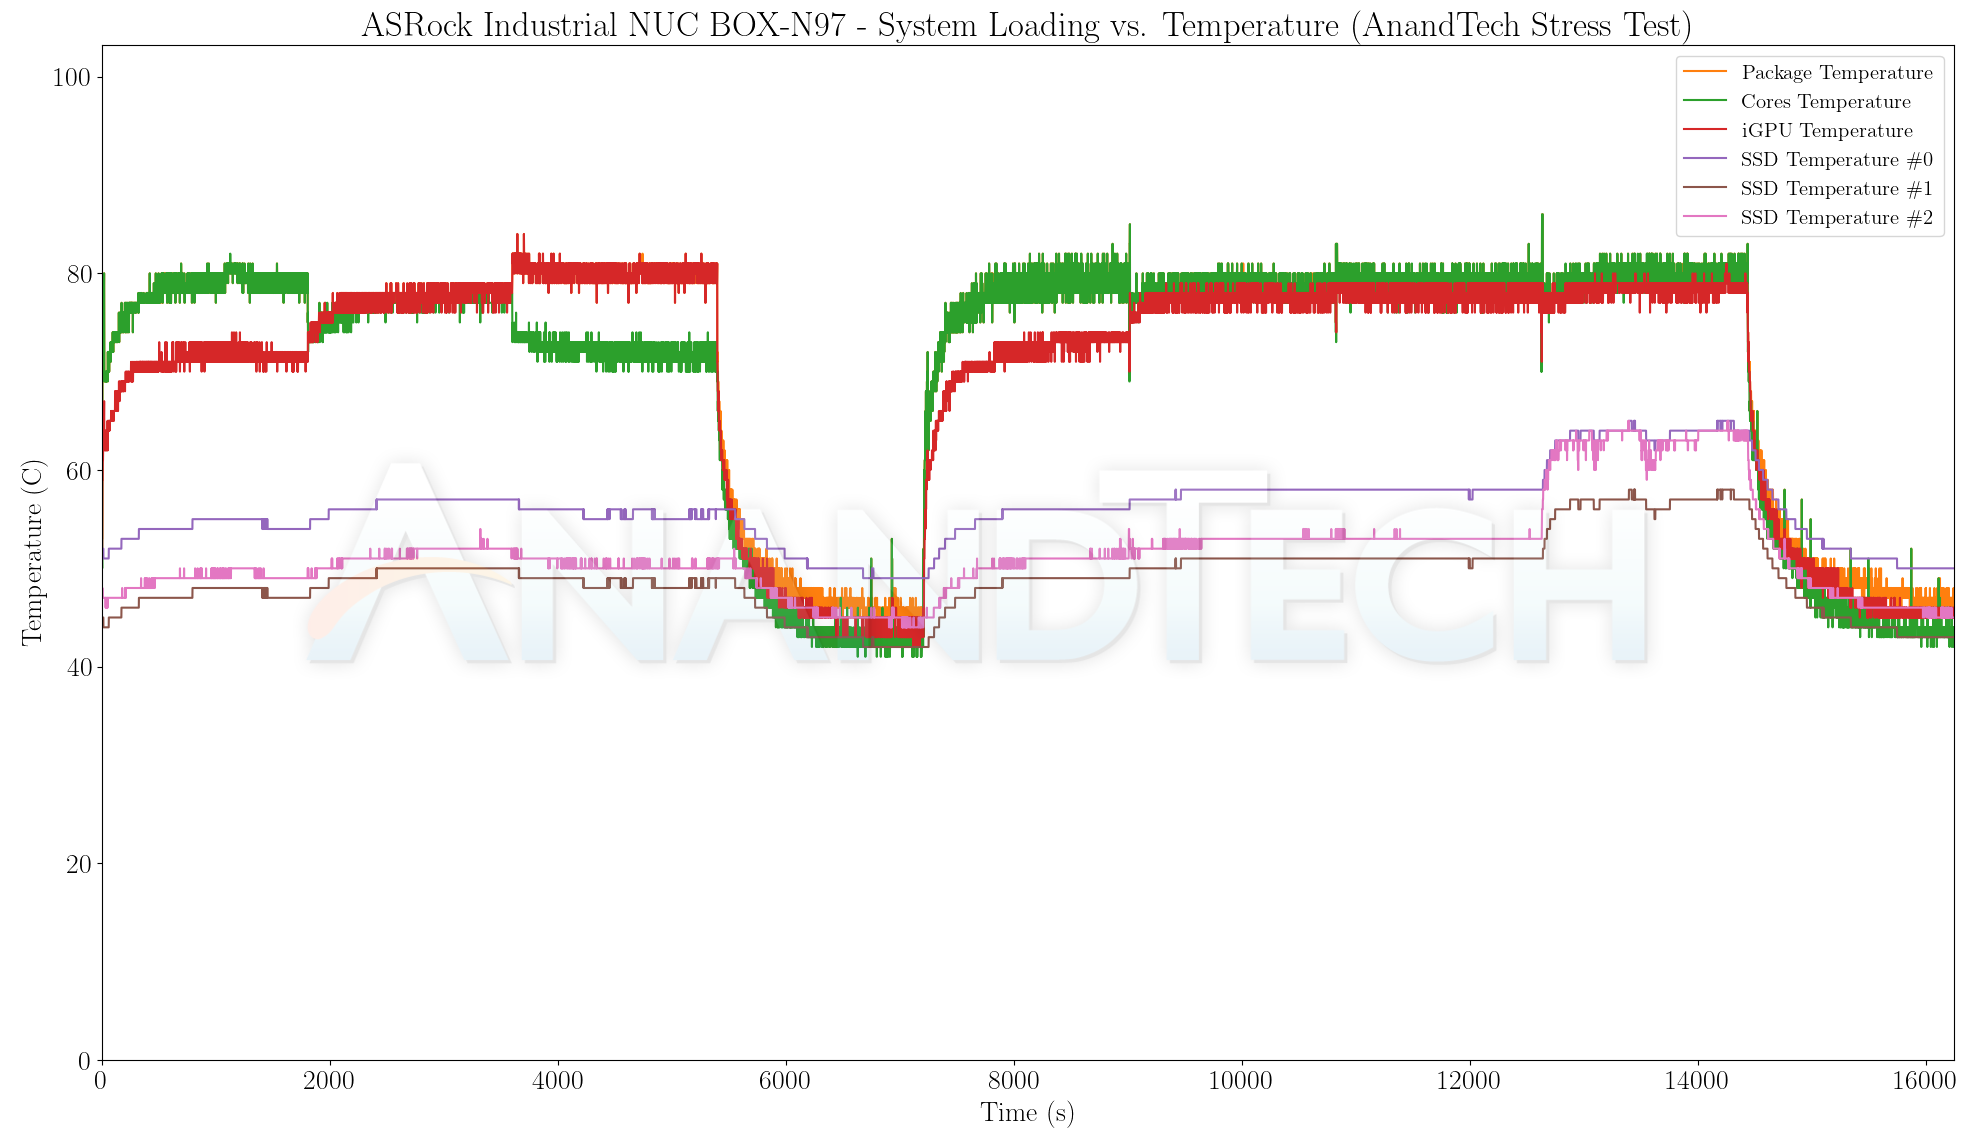
The thermal solution of both systems is excellent. The package temperature stabilizes around 80C at the configured PL1 numbers. The GMKtec NucBox G2 is more compact, but the package temperature ends up being almost the same as the NUC BOX-N97’s under long-term stress. This is due to the lower PL1 value in the system with a smaller physical footprint.
Networking and storage are aspects that may be of vital importance in specific PC use-cases. The GMKtec NucBox G2 comes with dual LAN ports backed by Realtek Gigabit Ethernet network controllers, while the ASRock Industrial NUC BOX-N97’s dual LAN ports are backed by Realtek 2.5 GbE Ethernet network controllers. Both controllers uplink to the processor via x1 PCIe links. So, that is a definitely plus point for the NUC BOX-N97. The Wi-Fi support in both systems is similar – 2T2R 802.11ax (Wi-Fi 6) with 80 MHz channels, even though the vendors are Mediatek for the NUC BOX-N97 and Realtek for the NucBox G2.
On the storage side, the GMKtec NucBox G2 employs a M.2 2242 SATA SSD. We installed the SK hynix Gold P31 in the NUC BOX-N97. Even though the SSD itself has a PCIe 3.0 x4 link, the M.2 SSD slot in the system has only a single lane available for uplink. From a benchmarking perspective, we provide results from the WPCstorage test of SPECworkstation 3.1. This benchmark replays access traces from various programs used in different verticals and compares the score against the one obtained with a 2017 SanDisk 512GB SATA SSD in the SPECworkstation 3.1 reference system.
| SPECworkstation 3.1.0 – WPCstorage SPEC Ratio Scores | |||
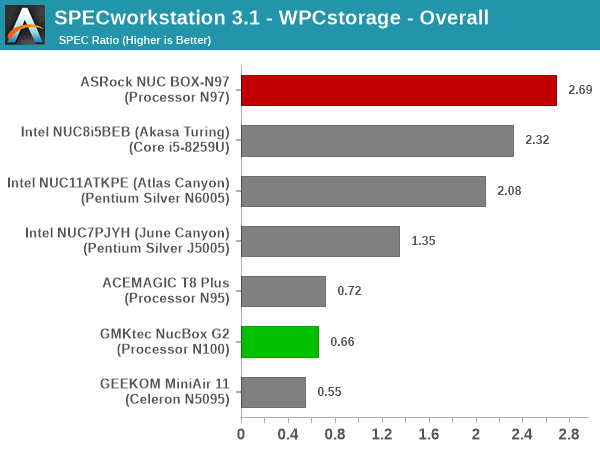
The graphs above present results for different verticals, as grouped by SPECworkstation 3.1. The storage workload consists of 60 subtests. Access traces from CFD solvers and programs such as Catia, Creo, and Soidworks come under ‘Product Development’. Storage access traces from the NAMD and LAMMPS molecular dynamics simulator are under the ‘Life Sciences’ category. ‘General Operations’ includes access traces from 7-Zip and Mozilla programs. The ‘Energy’ category replays traces from the energy-02 SPECviewperf workload. The ‘Media and Entertainment’ vertical includes Handbrake, Maya, and 3dsmax. Given that the comparison is between a wide range of SSDs in the systems – including both SATA and NVMe drives with different number of lanes, the relative numbers for most workloads are not surprising. The SK hynix Gold P31 behind the PCIe 3.0 x1 link of the NUC BOX-N97 comes out on top by a comfortable margin. The NucBox G2’s SATA SSD is a passable solution, but users with disk-intensive use-cases should probably steer away.
Closing Thoughts
Intel introduced the Alder Lake-N lineup of processors primarily for entry-level systems. The ACEMAGIC T8 Plus reviewed last week was one such system that managed to hit a sub-$200 price point for the full configuration put together inclusive of the RAM, SSD, and OS. The two systems reviewed in this piece show that it is possible for vendors to create relatively mid-range and high-end options using the processor family.
The ASRock Industrial NUC BOX-N97 goes for the high end of the market. The review configuration comes in at $353, with the barebones version at $260. Thanks to their business focus, the company can afford to do so. The NUC BOX-N97 comes with official in-band ECC support – a feature not available in any other system in a similar price range. All the USB ports are USB 3.2 Gen 2 (10 Gbps), and the LAN ports are both 2.5 Gbps-capable. The WLAN subsystem is reasonably high-end. Within the limitations imposed by the Alder Lake-N platform, the company has managed to create a system with plenty of high-speed I/O interfaces.
The chassis and thermal solution used by ASRock Industrial is capable of handling much higher TDPs. In terms of scope for improvement, it would have been nice to have a Core i3-N305 octa-core option to take advantage of the headroom available. ASRock Industrial should also attempt to start using GaN power adapters / USB-C PD for their systems. Other than that, any other improvements at the current price point are all purely in Intel’s court. Consumers may start looking for features like Thunderbolt support (something that has been deliberately kept away from the Atom-class products) in this price range soon. Additional PCIe lanes may also give more freedom for vendors to experiment.
The GMKtec NucBox G2 targets a completely different market at a much lower price point. It is only a very small step-up in price from the ACEMAGIC T8 Plus, but it provides compelling features such as 3x 10 Gbps USB Type-A ports (compared to the 3x 5 Gbps in the T8 Plus). The SSD has a higher capacity, and the WLAN component is a huge upgrade (from 1×1 Wi-Fi 5 to 2×2 Wi-Fi 6). The LED lighting in the base and the interchangeable case tops may be interesting features to certain market segments. The presence of dual LAN ports at this price point opens up a wide range of use-cases for the system.

There is always scope for improvement. Fixing the Type-C power input to be USB-C compliant and moving to a USB-PD solution should be on top of the agenda for GMKtec. Other than that, the company can just look at the ASRock Industrial NUC BOX-N97 to figure out possible I/O upgrades (the 2.5GBASE-T LAN ports, and Type-C data ports for example). At the same time, the discerning consumer will recognize that the NucBox G2 has aimed for a particular price point and tried to cram in features without going over the budget. From that perspective, GMKtec has done a creditable job.
At $230 for the complete system, the GMKtec NucBox G2 opens itself up as a low-cost PC for a variety of use-cases in both home and office scenarios. The ASRock Industrial NUC BOX-N97 demands a premium at $260 for the barebones version. The justification is the inclusion of features that are simply not present in the ADL-N systems from other vendors. The value proposition of both systems is excellent, but it is important to realize that the choice is completely dependent on the end-user requirements and deployment use-cases.