Intel Core i9-14900K, Core i7-14700K and Core i5-14600K Review: Raptor Lake Refreshed
2023-10-17In what is to be the last of Intel’s processor families to use the well-established Core i9, i7, i5, and i3 naming scheme, Intel has released its 14th Generation Core series of desktop processors, aptly codenamed Raptor Lake Refresh (RPL-R). Building upon the already laid foundations of the 13th Gen Core series family, Intel has announced a variety of overclockable K and KF (no iGPU) SKUs, including the flagship Core i9-14900K, the reconfigured Core i7-14700K, and the cheaper, yet capable Core i5-14600K.
The new flagship model for Intel’s client desktop products is the Core i9-14900K, which looks to build upon the Core i9-13900K, although it’s more comparable to the special edition Core i9-13900KS. Not only are the Core i9-14900K and Core i9-13900KS similar in specifications, but the Core i9-14900K/KF are the second and third chips consecutively to hit 6.0 GHz core frequencies out of the box.
Perhaps the most interesting chip within Intel’s new 14th Gen Core series family is the Core i7-14700K, which is the only chip to receive an uplift in cores over the previous SKU, the Core i7-13700K. Intel has added four more E-cores, giving the Core i7-13700K a total of 8 P-cores and 12 E-cores (28 threads), with up to a 5.6 GHz P-core turbo and a 125 W base TDP; the same TDP across all of Intel’s K and KF series 14th Gen core chips.
Also being released and reviewed today is the Intel Core i5-14600K, which has a more modest 6P+8E/20T configuration and has the same configuration 5.3 GHz boost frequency and 3.5 GHz base frequency on the P-cores as the Core i5-13600K. Intel has only boosted the E-core boost frequency by 100 MHz to justify the Core i5-14600K, which means it should perform similarly to its predecessor.
Despite being a refreshed selection of Intel’s 13th Gen Raptor Lake platform, the biggest question, aside from the performance, is what are the differences, and are there any nuances to speak of, and how do they correlate regarding performance to 13th Gen? We aim to answer these questions and more in our review of the Intel 14th Gen Core i9-14900K, Core i7-14700K and Core i5-14600K processors.
Being as frank and open as possible from the outset, Intel’s 14th Gen Series – or Raptor Lake Refresh – is precisely what it says on the tin: a refreshed variant of the previous 13th Gen Core series, AKA Raptor Lake. Regarding the underlying architecture, all bar the Core i7 series have the exact core count, core configuration, and number of hardware threads as their now replaced counterparts. Under the IHS of the 14th Gen is an identical core architecture on both the P and E-cores, with Raptor Cove P-cores and Gracemont E-cores; Gracemont has been the E-core of choice for Intel’s hybrid architecture, starting from the 12th Gen Core, AKA Alder Lake.
Given that Intel’s 14th Gen Core family shares and uses the same underlying architecture as the previous generation, the Core 13th Gen Core family, we have a more detailed analysis of the Raptor Cove P-cores within our dedicated Core i9-13900K and Core i5-13600K review.
Intel Core i7-14700K processor with 8P+12E cores
Despite refreshing the same Raptor Cove P-cores and Gracemont E-Cores as the 13th Gen chips, theoretically, we should see more performance through the increase in P-core turbo clock speeds on the refreshed 14th Gen chips, especially when comparing the Core i9-14900K to the Core i9-13900K. The 14900K has a blazing fast 6.0 GHz P-core maximum boost frequency, whereas the 13900K topped out at up to 5.8 GHz using Intel’s Thermal Velocity Boost (TVB) technology. That would certainly be more impressive to boast about if Intel hadn’t already given the market a glimpse of 6.0 GHz out of the box with the Core i9-13900KS.
The primary thing to highlight from our Core i9-13900KS review, which was the first Raptor Lake chip to hit 6.0 GHz, is that we hit thermal limits in many situations where the extra performance should have been more beneficial, which caused the clocks to dial back. It’s all good having a 6.0 GHz maximum frequency, but if it can’t be sustained for a meaningful period, it makes it a little moot. It should also be noted that harnessing all this extra performance and, ultimately, higher power draw does mean that users will need to factor in good quality cooling, with Intel specifying that their testing was done on a 360 mm AIO closed loop cooler. The deciding factor in performance is keeping the Raptor Cove (P) cores as cool as possible, which isn’t an easy task.

The Intel Core i9-14900K in CPU-Z
On the surface, this is the third generation of Intel’s Core family to use Gracemont-based E-cores, and the adage ‘if it’s not broken, don’t fix it’ shouldn’t apply to full generational refreshes. In the grand scheme of things, many users should expect Intel to at least make sweeping improvements to performance in any way it can. Although Intel does offer faster clock speeds across the board in both turbo and all-core, Intel is claiming gains in both compute and gaming performance. Interestingly, from having briefings with Intel and within their comparisons in slides from the deck, they weren’t done directly against 13th Gen Core.
Regarding memory support, Intel’s 14th Gen Core series processors support DDR5 and DDR4, much like their Alder Lake (12th Gen) and Raptor Lake (13th Gen) counterparts. This includes official support for JEDEC-standard memory speeds up to DDR5-5600B and DDR4-3200, respectively. As we have highlighted in multiple reviews, including the Alder Lake and Raptor Lake reviews, motherboards can only support either/or DDR5 and DDR4, and not both within the same motherboard. Allowing users to opt for more affordable DDR4 memory makes things cheaper, but DDR5 does perform better. As DDR5 memory has matured over the last year (and prices dropped), there are more performance benefits to DDR5 than DDR4.
| Intel 14th Gen Core, Raptor Lake-R (K/KF Series) | ||||||||||
| AnandTech | Cores P+E/T |
P-Core Base |
P-Core Turbo |
E-Core Base |
E-Core Turbo |
L3 Cache (MB) |
iGPU | Base W |
Turbo W |
Retail Price ($) |
| i9-14900K | 8+16/32 | 3200 | 6000 | 2400 | 4400 | 36 | 770 | 125 | 253 | $599 |
| i9-14900KF | 8+16/32 | 3200 | 6000 | 2400 | 4400 | 36 | – | 125 | 253 | $574 |
| i9-13900K | 8+16/32 | 3000 | 5800 | 2200 | 4300 | 36 | 770 | 125 | 253 | $537 |
| i7-14700K | 8+12/28 | 3400 | 5600 | 2500 | 4300 | 30 | 770 | 125 | 253 | $419 |
| i7-14700KF | 8+12/28 | 3400 | 5600 | 2500 | 4300 | – | 253 | $394 | ||
| i7-13700K | 8+8/24 | 3400 | 5400 | 2500 | 4200 | 30 | 770 | 125 | 253 | $365 |
| i5-14600K | 6+8/20 | 3500 | 5300 | 2600 | 4000 | 24 | 770 | 125 | 181 | $329 |
| i5-14600KF | 6+8/20 | 3500 | 5300 | 2600 | 4000 | 24 | – | 125 | 181 | $304 |
| i5-13600K | 6+8/20 | 3500 | 5300 | 2600 | 3900 | 24 | 770 | 125 | 181 | $285 |
While it is fair to say on paper there are likely to be similar performance levels when comparing some chips; the Core i9-14900K should technically beat the Core i9-13900K in single-thread and multi-threaded burst scenarios. The critical takeaway and thing to note here is that Intel isn’t expecting users to upgrade from the previous generation but instead is targeting users on even older generations, such as the 10th and 11th generation parts (Comet Lake and Rocket Lake). While users will benefit from upgrading to a Core i9-14900K from say, a Core i5-13600K in terms of compute performance, but about gaming, it’s likely that unless a specific title is optimized beyond 8-16-cores, users would see more benefits from an upgrade in graphics.

The Intel Core i9-14900K and Core i5-14600K processors
Comparing the Core i9 series specifications, the Core i9-14900K (MSRP $589) and KF (MSRP $564) have a 6.0 GHz max turbo boost clock speed, which is a 200 MHz bump over the Core i9-13900K and is the same as the Core i9-13900KS special edition processor. Subtle improvements have been made to both P and E-core clock speeds, with a 200 MHz bump to both the P-core and E-core base frequencies over the Core i9-13900K, while the E-core boost frequency is up 100 MHz to 4.4 GHz.
Everything else remains the same, from the 36 MB of L3 Intel Smart Cache, the same underlying Raptor Cove P-cores and Gracemont-based E-cores, and even the TDPs (PL1 = 125 W and PL2 = 253 W) remain unchanged. Intel has added a new ‘Extreme’ Power Delivery Profile, implemented through the firmware on capable boards, and increases the ICCMax to 400 A, up from the default 307 A value. Even with PL1 and PL2 values defined at 253 W, motherboards, especially premium models with over-engineered power deliveries, will likely ignore these through implementations such as Multi-Core Enhancement (MCE) or other derivatives.

CPU-Z Screenshot of the Core i5-14600K processor
Moving onto the Core i5-14600K (MSRP $319), it has a 6P+8E/20T configuration. It represents a more affordable option, with ample power under the IHS to be a competent addition to a mid-range gaming system. With our review of the Intel Core i9-13900K and Core i5-13600K back at launch in October 2022, the Core i5-13600K did well and represented a good balance of cost to performance. We would expect the Core i5-14600K to be running along the same lines as the 13th Gen counterpart; at least, we wouldn’t expect any levels of regression, which would make the upgrade path moot. The only difference between the Core i5-14600K and the previous Core i5-13600K is that the Core i5-14600K has a 100 MHz faster E-core boost frequency (up to 4 GHz), and that’s it. Nothing else has been added or changed in relation to the specifications.
Intel Core i7-14700K: A Definitive Upgrade Over 13th Gen
Much of what has been said can also be attributed to the Core i7-14700K (MSRP $409), which, when compared directly to the Core i7-13700K, is the only area where Intel has made a meaningful hardware configuration change. Specifically, Intel has upped the E-core count to 12 cores, versus the 8 found in the Core i7-13700K, bringing the total to 8P+12E/28T. Not only an increase to the E-cores, but Intel has also opted for a 200 MHz bump to P-core turbo clock speeds, which gives the Core i7-14700K a P-core turbo of up to 5.6 GHz and a base P-core frequency of 3.5 GHz.

Intel Core i7-14700K processor in CPU-Z
If anything, the Intel 14th Gen series doesn’t scream an upgrade for preexisting 12th or 13th Gen adopters. However, going from a Core i3 to a Core i9 would undoubtedly yield a significant gain in computational and even improvements in gaming performance, regardless of what frame rate the graphics card being used is capable of.
As Intel has given the Core i7-14700K four additional E-cores over its predecessor, the question could and should be asked, why not give other models in the family more of the same treatment? We have posed this question to Intel, but we’ve not (at the time of writing) had a response. Whether or not the new Core i7-14700K are recycled i9-14900K’s with cut-down E-cores, which may have potentially failed the binning process, or if something else exists, we will update below once we’ve received a response from Intel.
Intel 14th Gen Core Series: Intel AI Assist Overclocking & Application Optimizer
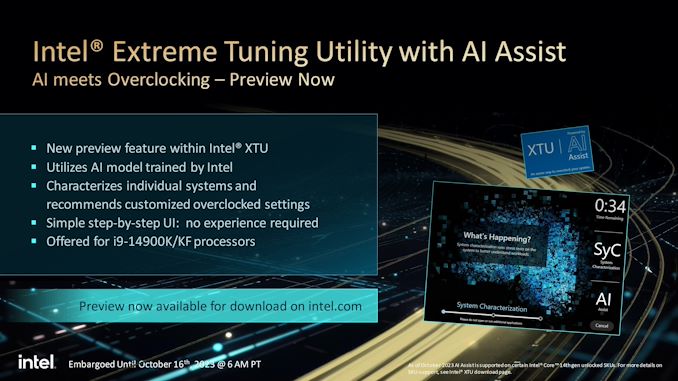
So, aside from the subtle changes we’ve highlighted above, Intel does have a couple of new ‘tricks’ up their sleeve, so to speak, to add some further functionality and pizazz. The first one is what Intel calls AI Assist for overclocking, which is more or less exactly what the name says on the tin. This is an automatic, AI-assisted overclocking tool that attempts to ascertain what a reasonable overclock for the installed chip would be, and is accessed via their Extreme Tuning Utility (XTU).
Initially introduced to offer AI assist to the Core i9-14900K and K/F SKUs, Intel isn’t explicitly saying it won’t be coming to support other K series processors. However, they did go as far as saying it is a 14th-generation feature, which sort of gatekeeps users with 13th-generation processors. It’s also worth noting that AI Assist isn’t replacing Intel Speed Optimizer, and there are substantial differences between the two technologies.
A simple rundown of how Intel AI Assist works goes something like this:
-
AI Assist measures specific system characteristics, including telemetry from integrated sensors such as temperatures, and operates a set of tests to determine a baseline of performance and potential overclocking headroom.
-
The data collected from the tests is fed into an AI model trained at Intel’s lab on many systems comprised of various combinations of processor, motherboard, memory, and cooling.
-
The AI model, through AI assist, which has been trained, responds with a list of ‘estimated’ overclocking settings, including CPU ratios that the system should be capable of doing.
-
The user is then given the option to apply the estimated values suggested by the AI model or manually fine-tune if the user wants to or disagrees with Intel AI Assist’s settings.
Although this sounds simple in principle, we have to explicitly remind users that overclocking, even just through the memory, is technically a breach of the warranty and, as such, would mean the processor wouldn’t be viable for replacement if an accident happened or the chip was to die. Although this is very unlikely, it should be noted that regardless of what Intel AI Assist suggests can be used as a rough guide to what the processor may or may not be capable of, the onus on whether or not the user applies these settings is on them, and as such, will likely bare the brunt of the consequences if something did happen to go wrong.
Whether that potential scenario is one that many are willing to swallow is subjective and down to individual opinion. Still, the idea of assisted AI using a trained AI model to determine overclocking headroom (albeit safely) is something I like. It’s something different, but it’s another implementation of AI in a way that might even squeeze out more performance.
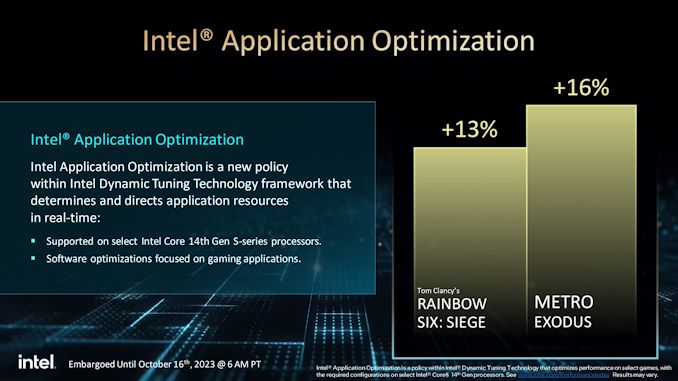
Meanwhile, we also have Intel’s new Application Optimizer, and this is where things get a little bit complicated. The way Intel describes the new feature leaves a little to be desired, but in short, it is designed to ‘optimize’ system settings to increase performance in games that have been whitelisted. At the time of writing, only two titles, Rainbow 6 Siege and Metro Exodus, can take advantage of this. The Intel Application Optimizer is preloaded via Intel’s current Dynamic Tuning Technology (DTT).
My first thought is that this is akin to the whitelists we’ve seen with mobile device manufacturers. If a specific benchmark, test, or application runs, it changes the parameters based on the benchmark and offers more aggressive settings to score higher. On the surface, we believe additional performance is good, especially if the situation allows it. What we aren’t so keen on is a whitelist that boosts performance with some applications but doesn’t apply to others.
On the mobile side, SoC vendors have previously used whitelists as a means of cheating as performance in specific synthetic benchmarks didn’t match real-world performance by violating a device’s thermal/power constraints. But this analogy admittedly breaks down some for high-end desktop chips, as these are generally not TDP-constrained devices, especially in games, which rarely light up more than the P-cores. Put another way, if it was just TDP holding back performance, Intel has previously shown no problem just increasing PL2 (again) and calling it a day.
What that means, however, is that for today’s launch we don’t have a clue what knobs Intel is turning to optimize gaming performance with Intel Application Optimizer. We’ve reached out to Intel for a comprehensive understanding of what it’s meant to achieve (other than higher performance) and how it works. We’ll update this segment once we have received their response.
Intel LGA1700: 600/700 Series Support For 14th Gen: New Z790 Boards on the Market
Something more of a surprise from Intel, without sounding like a backhanded compliment, is that Intel’s previous two high-performance motherboard chipsets, the Z690 and Z790 chipset, both support Intel’s 14th Gen Core series. Intel always intended for 600-series chipsets to support 14th Gen upon launch. It has to be taken into consideration that architecturally, there’s very little difference between 12th, 13th, and 14th Gen, with the flagship Core i9 and premium Core i7 series receiving notable upgrades, either going from Golden Cove to Raptor Cove for the P-cores or bumps to core count and frequency in the way the Core i7-14700K has received when compared to its predecessor.

The MSI MEG Z790 Ace Max motherboard (We are using this board for Intel 14th Gen CPU testing)
It wouldn’t be a processor launch if motherboard vendors didn’t get to announce and release a wave of new boards, which are more recent designs based on the Z790 chipset. Some vendors, such as MSI, call it Z790 MAX, while GIGABYTE has opted for the Z790 X moniker to differentiate the new boards from the preexisting ones.
Although the chipset remains the same, many new boards have implemented Wi-Fi 7 support via discrete adapters. This means foregoing the Wi-Fi 6E MAC integrated into the chipset for CNVi, but the reality is that the world has moved on in only the span of a year, and Wi-Fi 6E is no longer the latest or greatest for Wi-Fi connectivity. So motherboard makers are instead back to using discrete adapters here.
Over the following few pages, we’ll highlight updates to our CPU test suite for 2024 and the current rest bed for Intel’s 14th Gen Core series. This also includes performance in various elements such as SPEC2017 1T and nT, encoding, rendering, scientific, and AI/inferencing workloads.
Read on for our extended analysis.
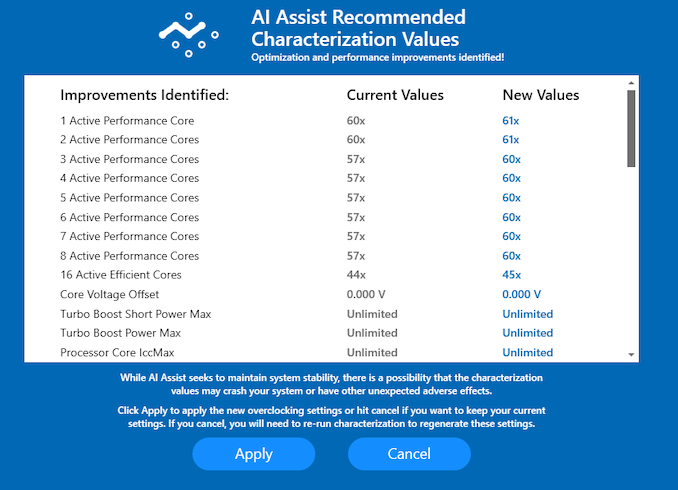
Below, we’ll give Intel’s latest AI Assist feature via the Extreme Tuning Utility (XTU) software to see what it believes is the best overclock for our system and how it compares to default settings. After applying Intel’s AI Assist to our Core i9-14900K, it concluded that the following settings are suitable for our test setup:
Intel’s AI Assist believes our system and Core i9-14900K is capable of 6.1 GHz on the two of the P-cores and 6.0 GHz on the remaining 6 P-cores, which, based on some preliminary testing with XTU, is very ambitious, to say the least. When running a CineBench R23 MT, the system was as stable as a kite in a hurricane; not very stable at all. We did manage to get a couple of CineBench R23 MT runs in, but with thermal throttling happening instantaneously, we saw some regression in performance with a score of 39445; temperatures went straight into the red, and the system dialed back the core frequencies and CPU V-Core.
The feature is a good idea in principle, but once enabled, even though it’s an Intel-marketed feature, it voids the CPU’s warranty. The other element is that the additional heat and power make the applied settings under intense workloads unstable. While this is still an early feature, we would have expected more stability with the applied settings than we saw in our testing.
As per our processor testing policy, we take a premium category motherboard suitable for the socket, and equip the system with a suitable amount of memory running at the manufacturer’s highest officially-supported frequency. This is also typically run at JEDEC subtimings where possible. It is noted that some users are not keen on this policy, stating that sometimes the highest official frequency is quite low, or faster memory is available at a similar price, or that the JEDEC speeds can be prohibitive for performance.
While these comments make sense, ultimately very few users apply memory profiles (either XMP or other) as they require interaction with the BIOS, and most users will fall back on JEDEC-supported speeds – this includes home users as well as industry who might want to shave off a cent or two from the cost or stay within the margins set by the manufacturer. Where possible, we will extend out testing to include faster memory modules either at the same time as the review or a later date.
The Current CPU Test Suite
For our Intel Core i9-14900K, Core i7-14700K, and Core i5-14600K testing, we are using the following test system:
| Intel 14th Gen Core System (DDR5) | |
| CPU | Core i9-14900K ($589) 24 Cores, 32 Threads 125 W TDP Core i7-14700K ($409) Core i5-14600K ($319) |
| Motherboard | MSI MEG Z790 Ace Max (BIOS 7D86vA0) |
| Memory | SK Hynix 2×16 GB DDR5-5600B CL46 |
| Cooling | MSI MAG Coreliquid E360 360mm AIO |
| Storage | SK Hynix Platinum P41 2TB PCIe 4.0 x4 |
| Power Supply | MSI A1000G 1000W |
| GPUs | AMD Radeon RX 6950 XT, 31.0.12019 |
| Operating Systems | Windows 11 22H2 |
Our CPU 2024 Suite: What to Expect
We recently updated the CPU test suite to our 2023, but we’ve decided to update it again as we head into 2024. Our new suite has a more diverse selection of tests and benchmarks, focusing on real-world instruction sets and newer encoding and decoding libraries such as AV1, VP9, and HVEC. We have also included a range of AI-focused workloads and benchmarks, as we’re seeing a direct shift from manufacturers to incorporate some form of on-chip AI processing, such as Ryzen AI and Intel’s Meteor Lake AI NPU.
While we’ve kept some of the more popular ones, such as CineBench R23, we’ve added Maxon’s latest CineBench 2024 benchmark to our test suite. We have also updated to the latest versions (at the time of incorporating the suite) in benchmarks such as Blender, V-Ray, and y-Cruncher.
With our processor reviews, especially on a new generational product such as Intel’s Core i9-13900K/14900K, we also include SPEC2017 data to account for any increases (or decreases) to generational single-threaded and multi-threaded performance. It should be noted that per the terms of the SPEC license because our benchmark results are not vetted directly by the SPEC consortium, it is officially classified as an ‘estimated’ score.
We’ve also carried over some older (but still relevant/enlightening) benchmarks from our CPU 2023 suite. This includes benchmarks such as Dwarf Fortress, Factorio, Dr. Ian Cutress’s 3DPMv2 benchmark, Blender 3.3, C-Ray 1.1 rendering, SciMark 2.0, and Primesieve 1.9.0. We’ve also kept UL’s Procyon suite as a more holisitc system-wide test.
As for gaming, we’re currently still revamping our CPU 2024 games suite, and as a result, we’ve tested gaming against our CPU 2023 suite. You can rest assured that our CPU 2024 games suite will be uploaded to the latest titles and will include even more technical aspects in play, such as Ray-Tracing, as this directly impacts CPU performance and frame rates. We will also include a similar methodology in terms of resolutions, including 720p/lower, 1080p, 1440p, and 4K.
The CPU-focused tests featured specifically in this review are as follows:
SPEC (Estimated)
- SPEC2017 rate-1T
- SPEC2017 rate-nT
Power
- Peak Power (y-Cruncher using AVX)
- Power analysis with y-Cruncher and CineBench R23
Office & Web
- UL Procyon Office: Various office-based tasks using various Microsoft Office applications
- UL Procyon Video Editing: Scores video editing performance on various parameters using Adobe Premiere software
- LibreOffice: Time taken to convert 20 documents to PDF
- JetStream 2.1 Benchmark: Measures various levels of web performance within a browser (we use the latest available Chrome)
- Timed Linux Kernel Compilation: How long it takes to compile a Linux build with the standard settings
- Timed PHP Compilation: How long does it take to compile PHP
- Timed Node.js Compilation: Same as above, but with Node.js
- MariaDB: A MySQL database benchmark using mysqlslap
Encoding
- WebP2 Image Encode: Encoding benchmark using the WebP2 format
- SVT AV1 Encoding: Encoding using AV1 at both 1080p and 4K, at different settings
- Dav1D AV1 Benchmark: A simple AV1 based benchmark
- SVT-HEVC Encoding: Same as SVT AV1, but with HEVC, at both 1080p and 4K
- SVT-VP9 Encoding: Same as other SVT benchmarks, but using VP9, both at 1080p and 4K
- FFmpeg 6.0 Benchmark: Benchmarking with x264 and x265 using a live scenario
- FLAC Audio Encoding: Benchmarking audio encoding from WAV to FLAC
- 7-Zip: A fabled benchmark we’ve used before, but updated to the latest version
Rendering
- Blender 3.6: Popular rendering program
- CineBench R23: The fabled Cinema4D Rendering engine
- CineBench 2024: The latest Cinema4D Rendering engine
- C-Ray: A popular render
- V-Ray: Another popular renderer
- POV-Ray: A persistence of ray-tracing benchmark
Science & Simulation
- y-Cruncher 0.8.2.9523: Calculating Pi to 5M digits, both ST and MT
- 3D Particle Movement v2.1 (Non-AVX + AVX2/AVX512)
- Primesieve 1.9.0: This test generates prime numbers using an optimized sieve of Eratosthenes implementation
- Montage Astro Image Mosaic Engine: Benchmarking of an open-sourced mosaic engine via California Institute of Technology
- OpenFOAM: A Computational Fluid Dynamics (CFD) benchmark using drivaerFastback test case to analyze automotive aerodynamics.
- Dwarf Fortress 0.44.12: Fantasy world creation and time passage
- Factorio v1.1.26 Test: A game-based benchmark that is largely consistent for measuring overall CPU and memory performance
- 3D Mark CPU Profile: Benchmark testing just the CPU with multiple levels of thread usage
AI and Inferencing
- ONNX Runtime: A Microsoft developed open source machine learning and inferencing accelarator
- DeepSpeech: A Mozilla based speech-to-text engine benchmark powered by TensorFlow
- TensorFlow 2.12: A TensorFlow benchmark using the deep learning framework
- UL Procyon WIndows AI Inference: A benchmark by UL measuring total inference counts across multiple libaries
We are currently using our games from our CPU 2023 suite. Our current games in our CPU testing and those featured in this review are as follows:
- Civilization VI: 480p, 1080p, 1440p and 4K (both avg and 95% percentile)
- World of Tanks: 768p, 1080p, and 4K (both avg and 95% percentile)
- Borderlands 3: 360p, 1080p, 1440p, and 4K (both avg and 95th percentile)
- Grand Theft Auto V: 720p, 1080p, 1440p, and 4K (both avg and 95th percentile)
- Red Dead Redemption 2: 384p, 1080p, 1440p, and 4K (both avg and 95th percentile)
- F1 2022: 720p, 1080p, 1440p, and 4K (both avg and 95th percentile)
- Hitman 3: 720p, 1080p, 1440p, and 4K (both avg and 95th percentile)
- Total War Warhammer 3: 720p, 1080p, 1440p and 4K (only avg fps measured)
As we have mentioned, we are updating our CPU 2024 suite with new games and the latest titles, and this will come before the next CPU review we publish.
While we normally analyze Core-to-Core latency on new CPUs, the fact that Intel’s 14th and 13th Gen are identical architecturally, we opted to omit this from our testing.
SPEC2017 is a series of standardized tests used to probe the overall performance between different systems, different architectures, different microarchitectures, and setups. The code has to be compiled, and then the results can be submitted to an online database for comparison. It covers a range of integer and floating point workloads, and can be very optimized for each CPU, so it is important to check how the benchmarks are being compiled and run.
We run the tests in a harness built through Windows Subsystem for Linux, developed by Andrei Frumusanu. WSL has some odd quirks, with one test not running due to a WSL fixed stack size, but for like-for-like testing it is good enough. Because our scores aren’t official submissions, as per SPEC guidelines we have to declare them as internal estimates on our part.
For compilers, we use LLVM both for C/C++ and Fortan tests, and for Fortran we’re using the Flang compiler. The rationale of using LLVM over GCC is better cross-platform comparisons to platforms that have only have LLVM support and future articles where we’ll investigate this aspect more. We’re not considering closed-source compilers such as MSVC or ICC.
clang version 10.0.0

clang version 7.0.1 (ssh://git@github.com/flang-compiler/flang-driver.git

 24bd54da5c41af04838bbe7b68f830840d47fc03)
-Ofast -fomit-frame-pointer

-march=x86-64

-mtune=core-avx2

-mfma -mavx -mavx2
Our compiler flags are straightforward, with basic –Ofast and relevant ISA switches to allow for AVX2 instructions.
To note, the requirements for the SPEC licence state that any benchmark results from SPEC have to be labeled ‘estimated’ until they are verified on the SPEC website as a meaningful representation of the expected performance. This is most often done by the big companies and OEMs to showcase performance to customers, however is quite over the top for what we do as reviewers.
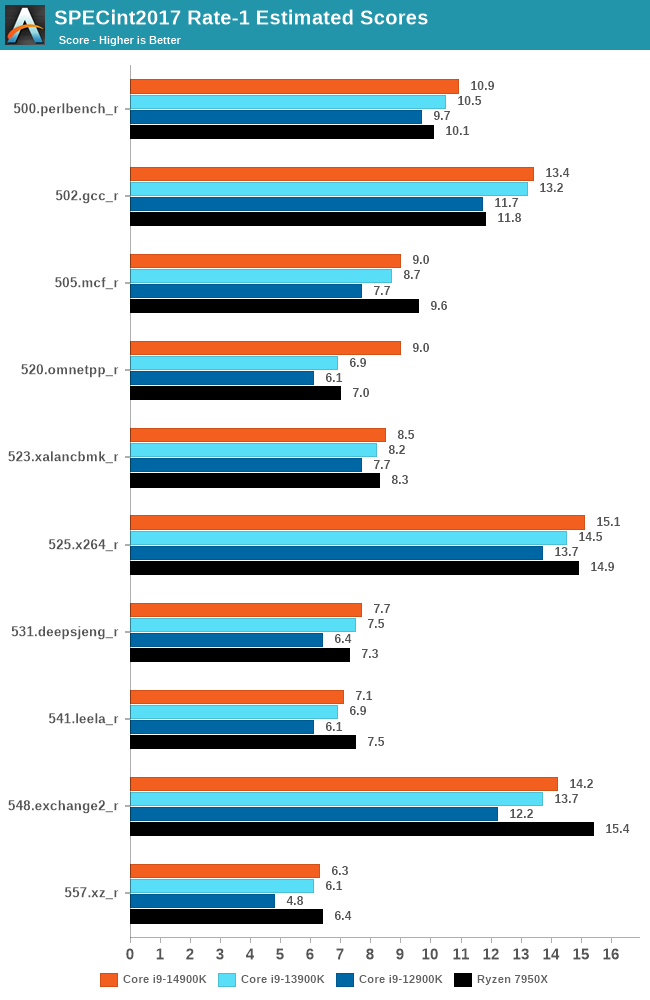
As we typically do when Intel or AMD releases a new generation, we compare both single and multi-threaded improvements using the SPEC2017 benchmark. Starting with SPECint2017 single-threaded performance, we can see very little benefit from opting for Intel’s Core i9-14900K in most of the tests when compared against the previous generation’s Core i9-13900K. The only test we did see a noticeable bump in performance was in 520.omnetpp_r, which simulates discrete events of a large 10 Gigabit Ethernet network. There was a bump of around 23% in terms of ST performance in this test, likely due to the increased ST clock speed to 6.0 GHz, up 200 MHz from the 5.8 GHz ST turbo on the Core i9-13900K.
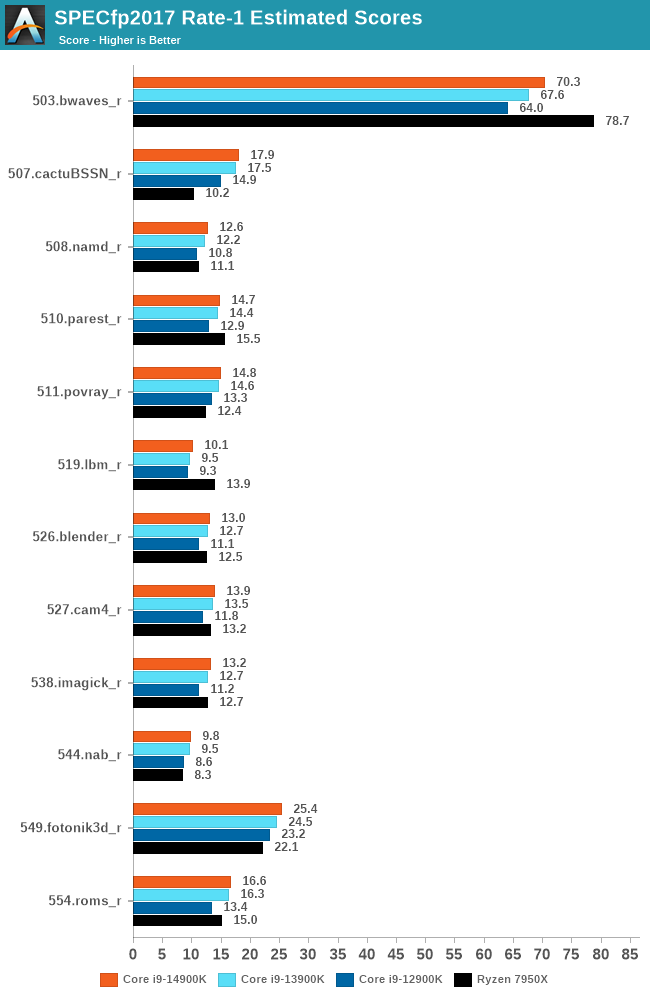
Onto the second half of the SPEC2017 1T-tests is the SPECfp2017 suite, and again, we’re seeing very marginal differences in performance; certainly nothing that represents a large paradigm shift in relation to ST performance. Comparing the 14th Gen and 13th Gen core series directly to each other, there isn’t anything new architecturally other than an increase in clock speeds. As we can see in a single-threaded scenario with the Core i9 flagships, there is little to no difference in workload and application performance. Even with 200 MHz more grunt in relation to maximum turbo clock speed, it wasn’t enough to shape performance in a way that directly resulted in a significant jump in performance.
Single-threaded performance is only one element in regard to performance on a multi-core processor, and it’s time to look at multi-threaded performance in SPEC2017. Although things in the single-threaded SPEC2017 testing showed that both Zen 4 and Raptor Lake were consistently at loggerheads, let’s look at data in the Rate-N multi-threaded section.
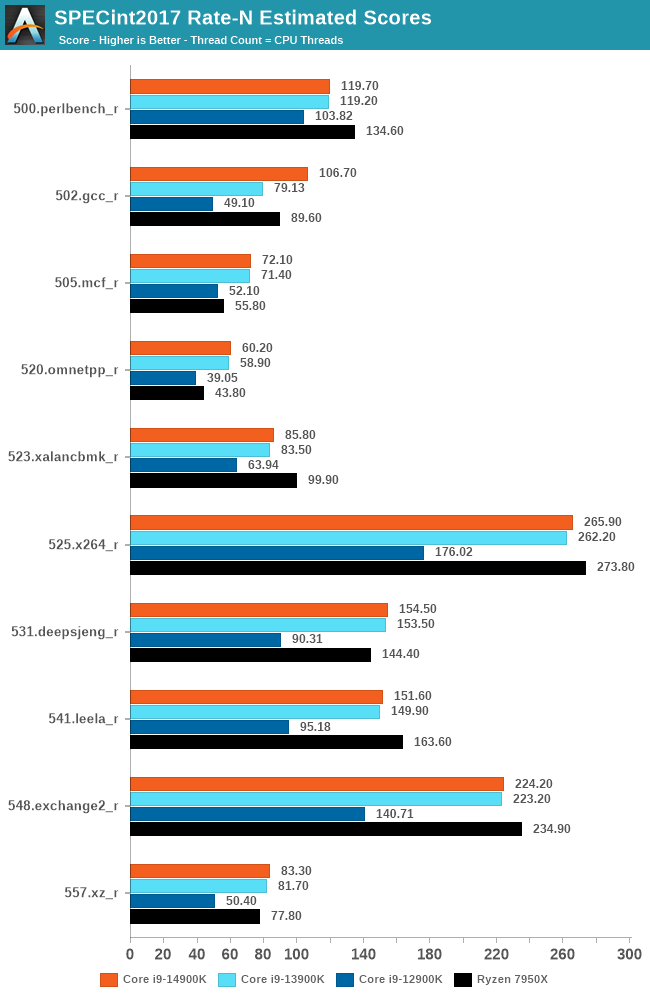
Looking at multi-threaded performance in SPECint2017, the only test that seemed to benefit from the increased core clock speeds of the Core i9-14900K was in 502.gcc_r, which is a simulation based on the GNU C compiler that analyzes source code inputs and compiles a few large files instead of many different small files. In this instance, we saw 34% more performance with the Core i9-14900K than the Core i9-13900K, but we are currently re-testing to ensure this isn’t an anomaly and is an accurate representation.
Of course, it’s also fair to assume that the clock speed increase yields a benefit, although we aren’t seeing this translate to more performance in other tests within the SPECint2017 MT suite.
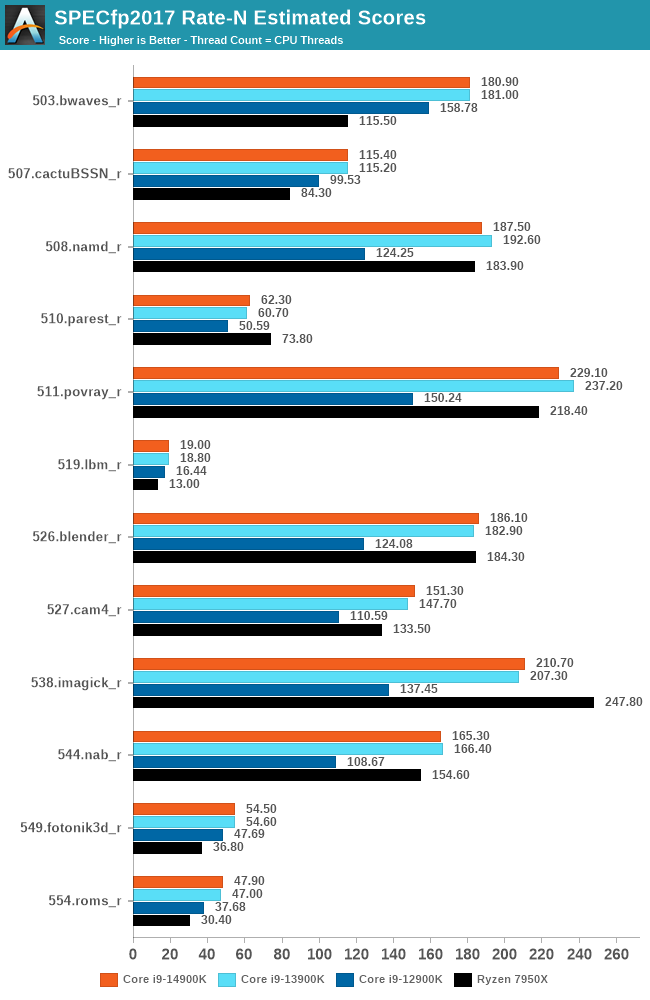
The last section of our SPEC2017 testing is the SPECfp2017 MT, and once again, we are seeing some gains, but they are very marginal at most. We did actually see some regression in one test, 511.povray_r, which represents a 2560 x 2048 pixel rendering of a chess board and is saved as a Targa (.tga) file extension. Given that we also run a specific Persistence of Ray tracing (POVRay) test in our suite, and we didn’t see this regression here, it could be an anomaly, and as we’ve stated, we are re-testing SPEC to eliminate any of these anomalies or variations.
Overall, in both ST and MT SPEC2017 suite performance, the Intel Core i9-14900K doesn’t represent significant gains in performance over the Core i9-13900K.
Our previous sets of ‘office’ benchmarks have often been a mix of science and synthetics, so this time, we wanted to keep our office and productivity section purely based on real-world performance. We’ve also incorporated our power testing into this section.
The biggest update to our Office-focused tests for 2024 and beyond includes UL’s Procyon software, which is the successor to PCMark. Procyon benchmarks office performance using Microsoft Office applications and Adobe Premier Pro’s video editing capabilities.
We are using DDR5 memory on the Core i9-14900K, Core i7-14700K, Core i5-14600K, and Intel’s 13th Gen at the relative JEDEC settings. The same methodology is also used for the AMD Ryzen 7000 series and Intel’s 12th Gen (Alder Lake) processors. Below are the settings we have used for each platform:
- DDR5-5600B CL46 – Intel 14th & 13th Gen
- DDR5-5200 CL44 – Ryzen 7000
- DDR5-4800 (B) CL40 – Intel 12th Gen
Note: As we are running with a completely refreshed CPU test suite, this means we are currently re-testing other processors for our data sets. These will be added to the below graphs as soon as we have more results, and these will also be added to our Bench database. Thanks for your understanding.
Power
The nature of reporting processor power consumption has become, in part, a bit of a nightmare. Historically the peak power consumption of a processor, as purchased, is given by its Thermal Design Power (TDP, or PL1). For many markets, such as embedded processors, that value of TDP still signifies the peak power consumption. For the processors we test at AnandTech, either desktop, notebook, or enterprise, this is not always the case.
Modern high-performance processors implement a feature called Turbo. This allows, usually for a limited time, a processor to go beyond its rated frequency. Exactly how far the processor goes depends on a few factors, such as the Turbo Power Limit (PL2), whether the peak frequency is hard coded, the thermals, and the power delivery. Turbo can sometimes be very aggressive, allowing power values 2.5x above the rated TDP.
AMD and Intel have different definitions for TDP that are, broadly speaking, applied the same. The difference comes from turbo modes, turbo limits, turbo budgets, and how the processors manage that power balance. These topics are 10000-12000 word articles in their own right, and we’ve got a few articles worth reading on the topic.
- Why Intel Processors Draw More Power Than Expected: TDP and Turbo Explained
- Talking TDP, Turbo and Overclocking: An Interview with Intel Fellow Guy Therien
- Reaching for Turbo: Aligning Perception with AMD’s Frequency Metrics
- Intel’s TDP Shenanigans Hurts Everyone
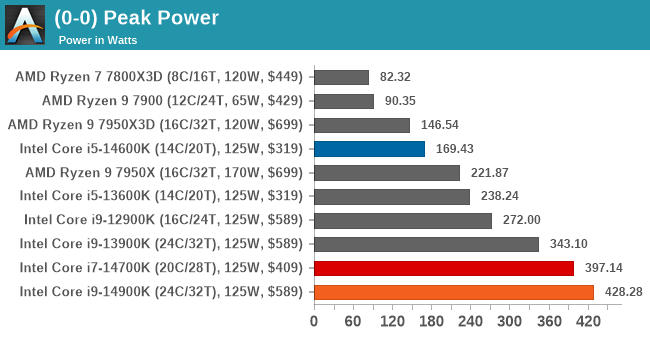
First off, we somehow managed to pull 428 W with the Core i9-14900K, which for a processor that hasn’t been manually overclocked or pushed beyond what the motherboard is doing through the firmware is just ridiculous – and this is not a compliment. Compared to the Core i9-13900K, which we re-tested on the same MSI MEG Z790 Ace MAX motherboard, our peak power tests pulled 343 W of power from the CPU. We’ve reached out to MSI directly to figure out what’s going on, and although it could have been a power spike, one that high isn’t ideal nor safe for the silicon.
Looking at the peak power values on the Core i7-14700K and Core i5-14600K, the Core i7-14700K was also quite power-hungry with a peak power of 397 W on our MSI MEG Z790 Ace MAX motherboard. The Core i5-14600K, on the other hand, actually pulled 169 W, which was around 28% lower than the Core i5-13600K. This is a marked improvement comparing the two Core i5 processors, especially when comparing the Core i9-14900K to the Core i9-13900K, which tells a much different story.
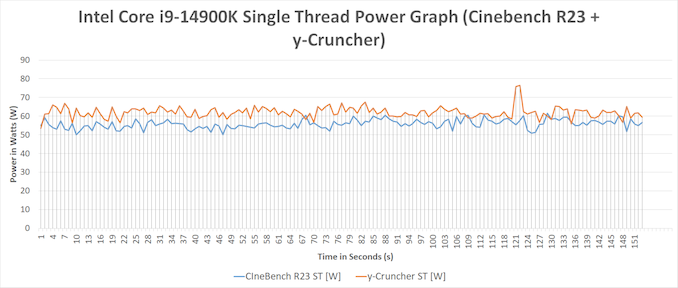
Taking a slightly deeper look at power, we’ve split our Core i9-14900K power analysis into two areas: single-threaded and multi-threaded. Using two different benchmarks from our suite to look at power (CineBench R23 and y-Cruncher), we can see different load variations between the two. While y-Cruncher is inherently more intensive than CineBench R23, both represent different load intensities on a single thread. As we can see in our single-threaded power graph, we observed between 50 and 70 W of general power consumption with one thread loaded to the maximum. In y-Cruncher, we did observe a spike in power of 78 W. Typically, single-threaded loads don’t come close to enabling power limits such as PL1 and PL2, but we can see what a single-threaded application with low and high-intensity workloads.
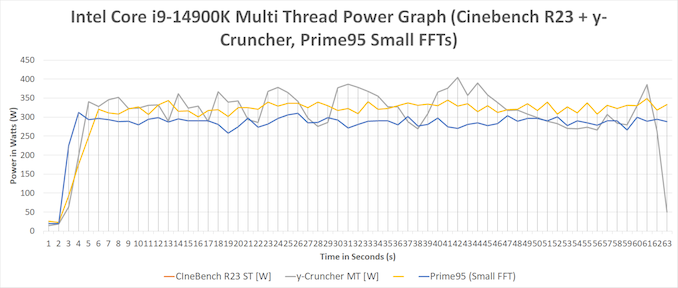
Moving onto multi-threaded power consumption, we’ve also thrown a Prime95 stress test with small FFTs into the equation. As we can see, y-Cruncher pulls more power and spikes more furiously than CineBench 23 MT and Prime95 again. Even though the Core i9-14900K has a PL1 and PL2 value of 253 W (same as the Core i9-13900K), motherboard vendors at default settings typically push more power through the processor, making TDP and power limits something of a moot point. Of course, users can opt to run settings specifically at Intel’s default specification, but no Z790 motherboard applies these by default as they race for the performance crown.
In our MT power testing, we observed between 250 W and 400 W across all three workloads, which is a very wide variation with all the cores and threads loaded up. As we know, y-Cruncher is more unpredictable, more overzealous, and more intensive, which caused a peak of 401 W; this wasn’t uncommon throughout our testing, and it’s clear that the Core i9-14900K isn’t only faster in clock speeds than the Core i9-13900K, but with a peak of 428 W in our peak power test, it can draw much more power too. This is something to bear in mind, especially when it comes to selecting optimal cooling, as, once again, Intel’s platforms pull a lot of power and generate a considerable amount of heat, too.
Productivity and Web
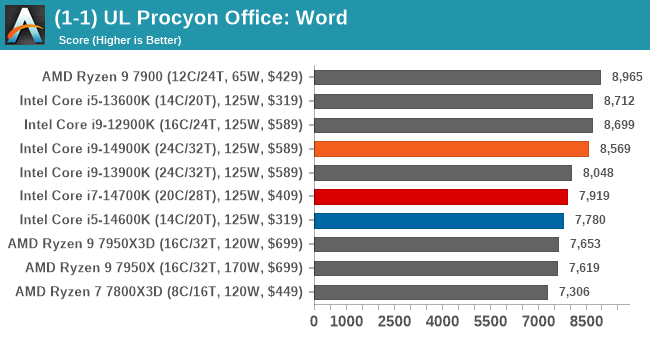
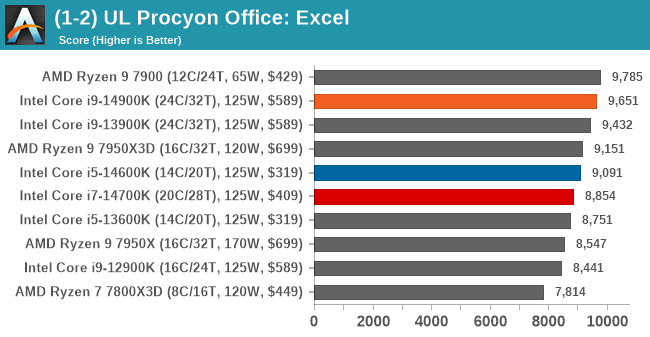
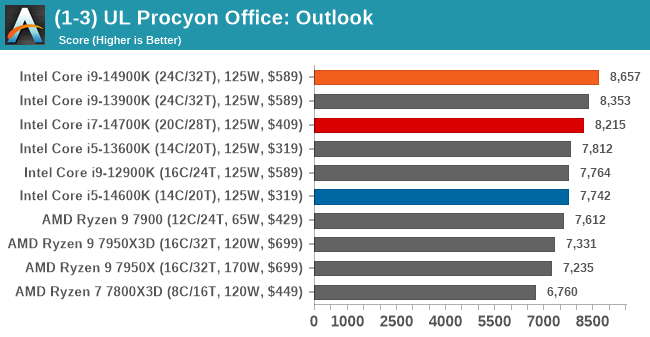
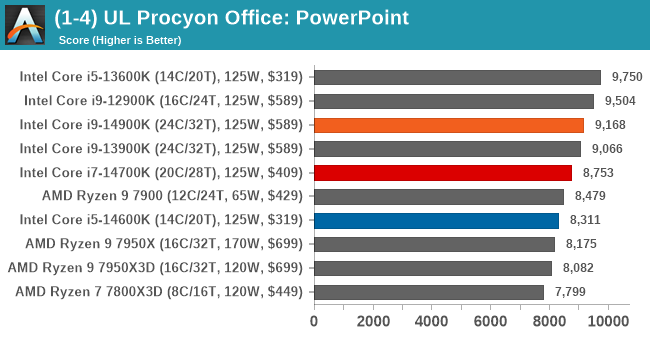
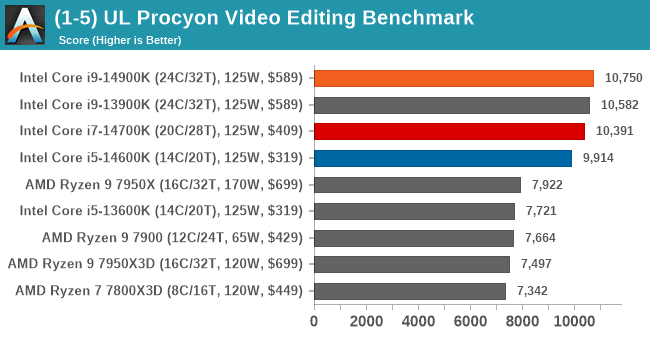
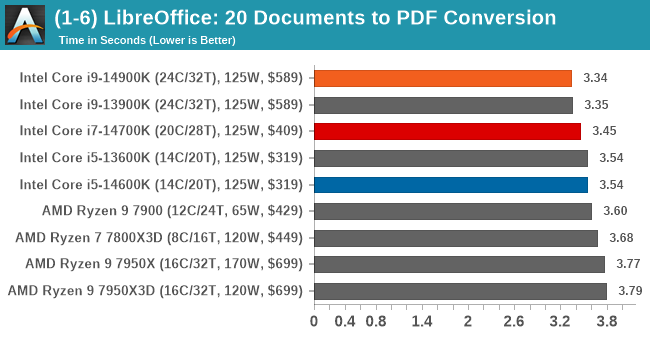
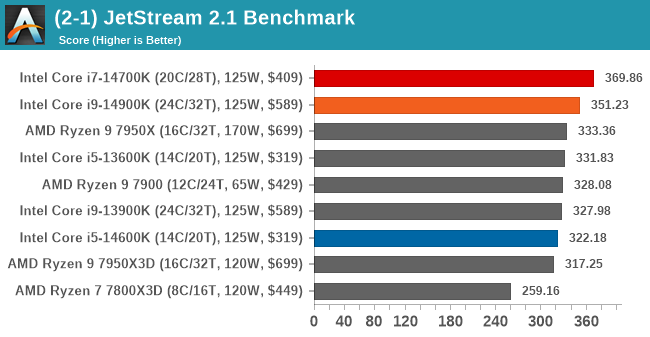
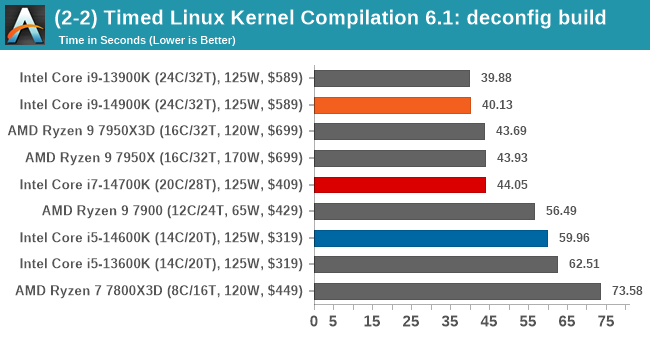
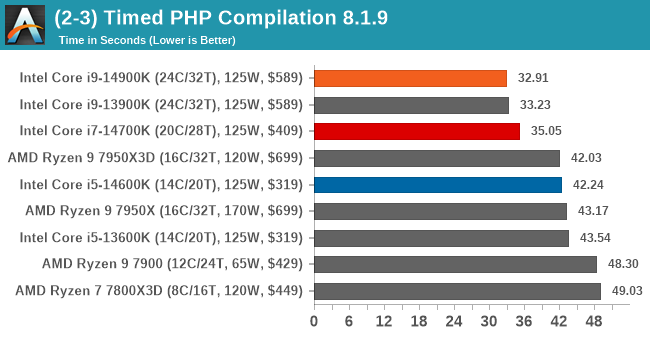
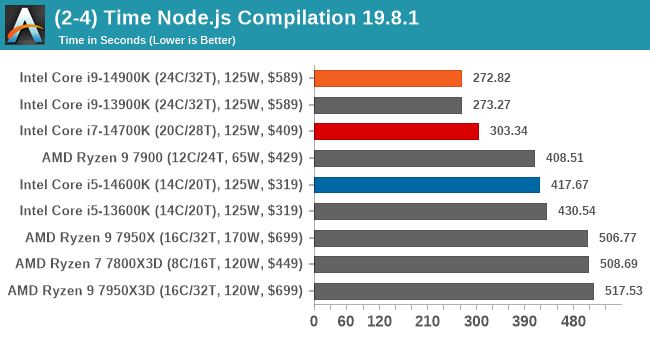
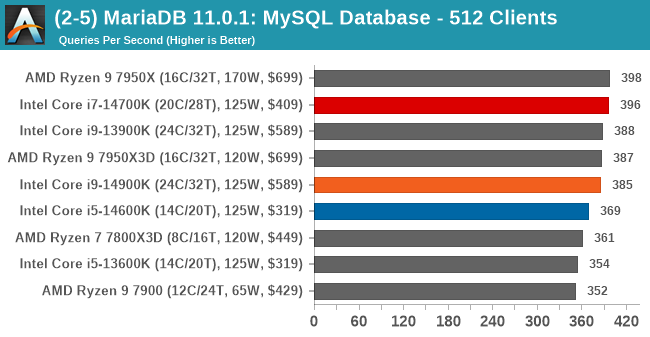
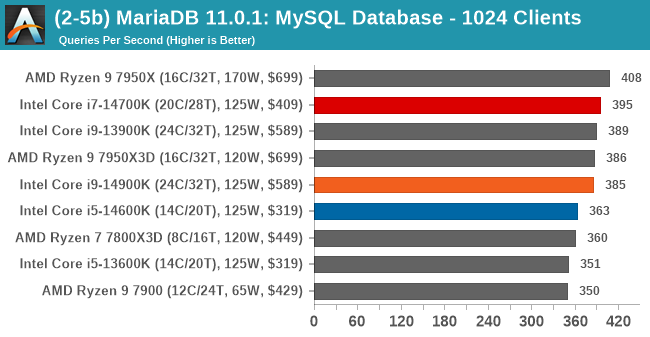
In our office and productivity suite, the Intel Core i9-14900K and the Core i9-13900K consistently trade blows. The real surprise is the Core i7-14700K, which, given it only has four fewer E-cores than both Core i9s, is consistently up there in terms of performance. Looking at how the Core i5-14600K compares against the previous Core i5-13600K, the newer 14th Gen Core i5 is consistently ahead, but only marginally.
One of the interesting elements of modern processors is encoding performance. This covers two main areas: encryption/decryption for secure data transfer and video transcoding from one video format to another.
In the encrypt/decrypt scenario, how data is transferred and by what mechanism is pertinent to on-the-fly encryption of sensitive data – a process by which more modern devices are leaning towards for improving software security.
We’ve updated our list of encoding benchmarks for our 2024 CPU suite to include some of the most relevant and recent codecs, such as AV1, HEVC, and VP9. Not only this, but we have also included FLAC audio encoding as well as WebP2 image encoding into the mix to show not only how the latest processors perform with these codecs but also to show discrepancies in performance throughout the different segments.
We are using DDR5 memory on the Core i9-14900K, Core i7-14700K, Core i5-14600K, and Intel’s 13th Gen at the relative JEDEC settings. The same methodology is also used for the AMD Ryzen 7000 series and Intel’s 12th Gen (Alder Lake) processors. Below are the settings we have used for each platform:
- DDR5-5600B CL46 – Intel 14th & 13th Gen
- DDR5-5200 CL44 – Ryzen 7000
- DDR5-4800 (B) CL40 – Intel 12th Gen
Note: As we are running with a completely refreshed CPU test suite, this means we are currently re-testing other processors for our data sets. These will be added to the below graphs as soon as we have more results, and these will also be added to our Bench database. Thanks for your understanding.
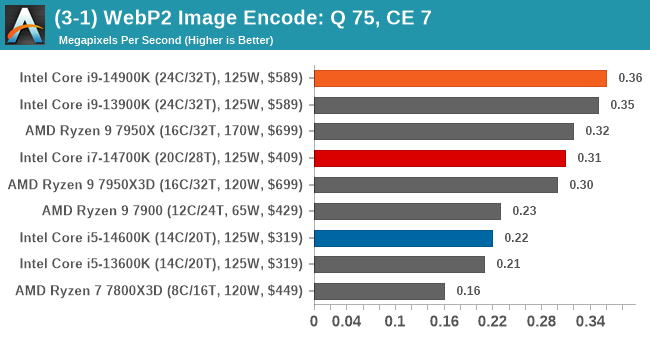
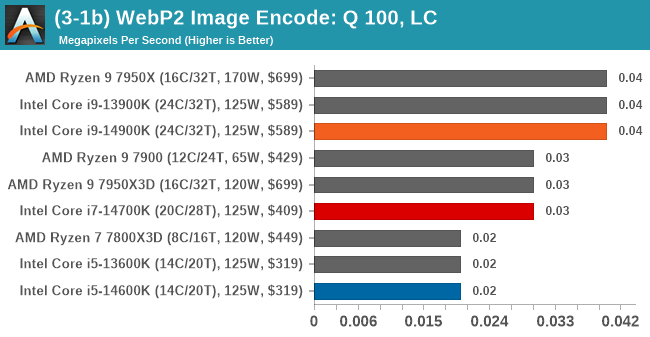
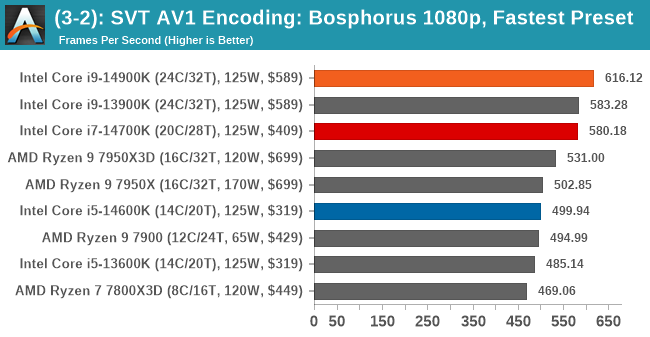
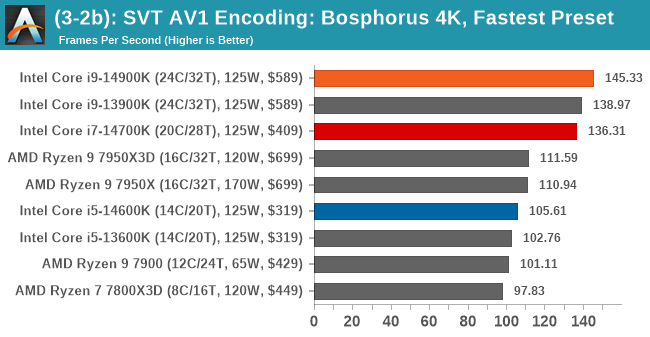
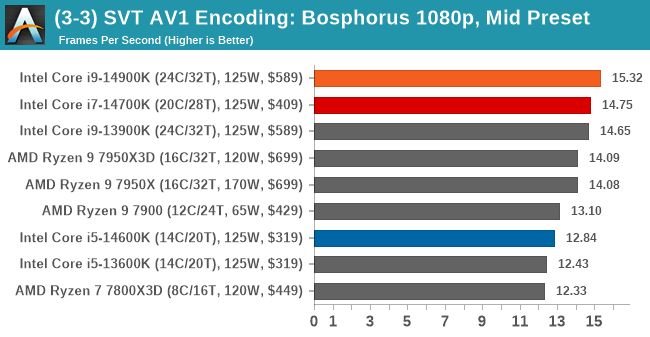
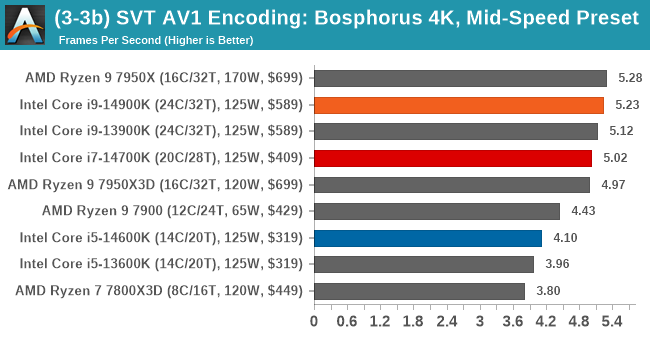
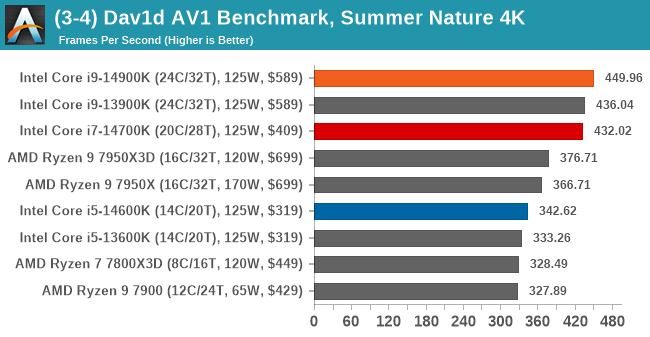
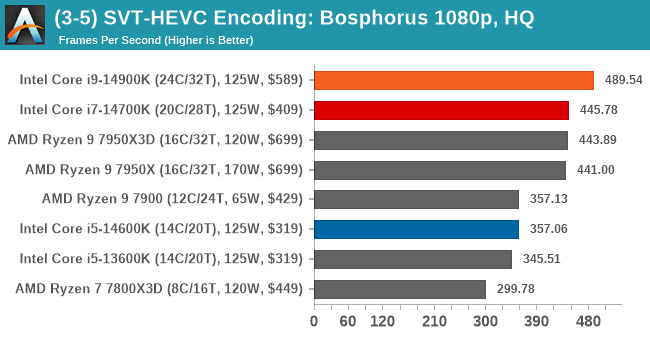
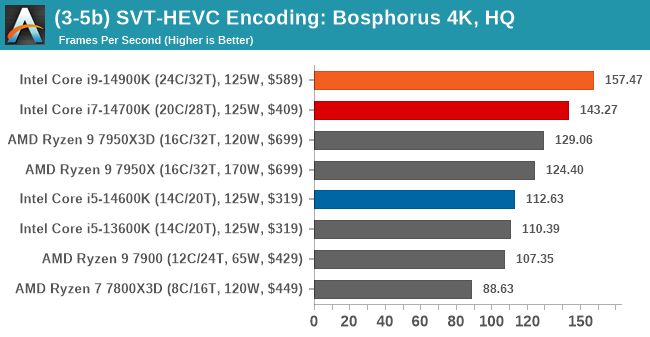
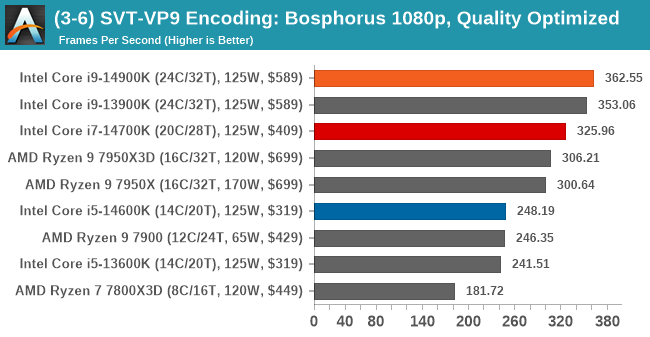
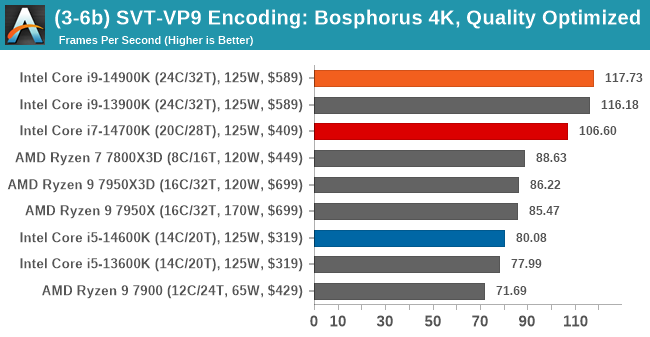
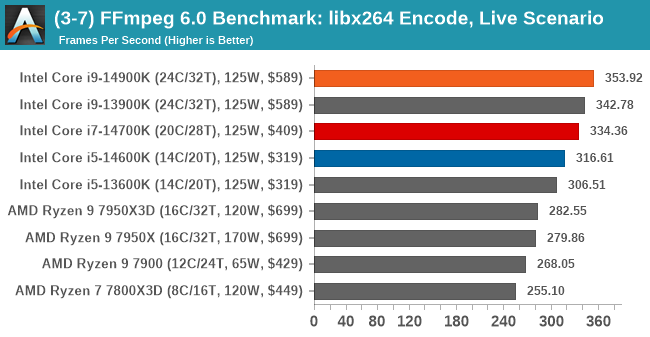
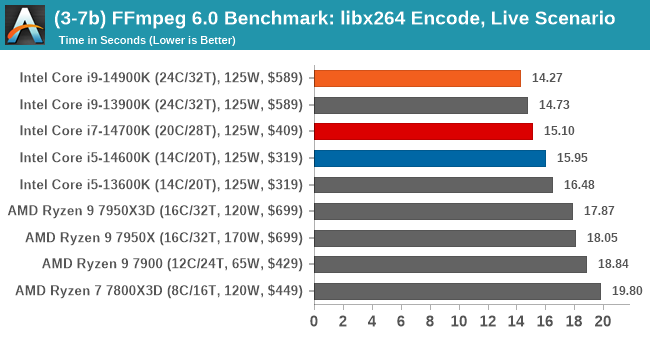
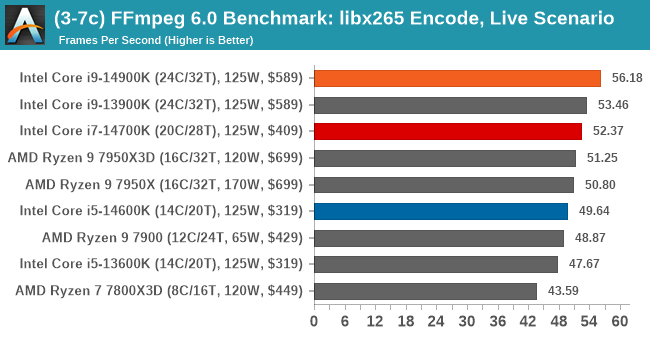
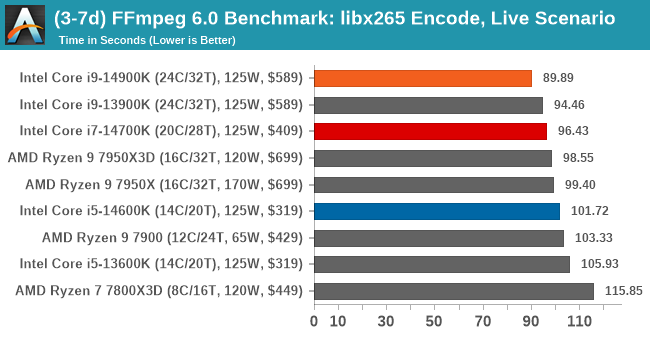
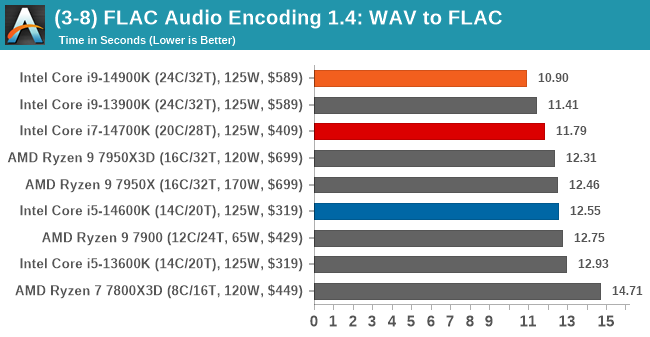
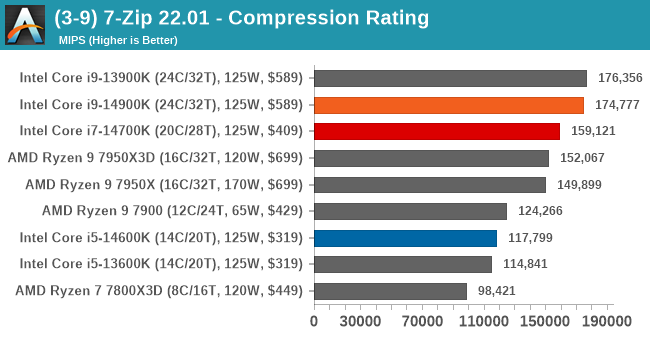
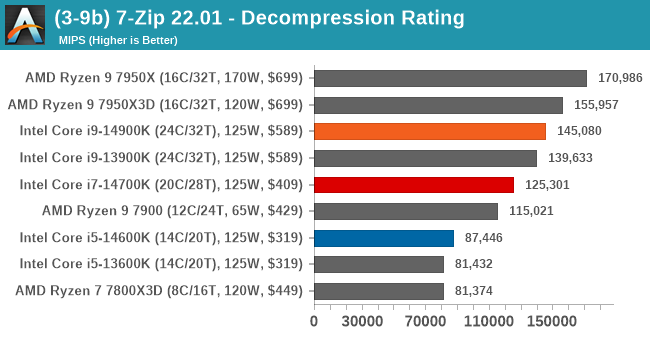
Moving onto encode and decode performance, there’s not much difference between the Core i9-14900K and the Core i9-13900K. What’s clear from our testing is that in encoding, Intel has the advantage over AMD with their flagship processors. The Core i7-14700K is also right up there in terms of performance, while the cheaper and less powerful Core i5-14600K trades blows with the AMD Ryzen 9 7900.
Rendering tests, compared to others, are often a little more simple to digest and automate. All the tests put out some sort of score or time, usually in an obtainable way that makes it fairly easy to extract. These tests are some of the most strenuous in our list, due to the highly threaded nature of rendering and ray-tracing, and can draw a lot of power.
If a system is not properly configured to deal with the thermal requirements of the processor, the rendering benchmarks are where it would show most easily as the frequency drops over a sustained period of time. Most benchmarks, in this case, are re-run several times, and the key to this is having an appropriate idle/wait time between benchmarks to allow for temperatures to normalize from the last test.
Some of the notable rendering-focused benchmarks we’ve included for 2024 include the latest CineBench 2024 benchmark and an update to Blender 3.6 and V-Ray 5.0.2.
We are using DDR5 memory on the Core i9-14900K, Core i7-14700K, Core i5-14600K, and Intel’s 13th Gen at the relative JEDEC settings. The same methodology is also used for the AMD Ryzen 7000 series and Intel’s 12th Gen (Alder Lake) processors. Below are the settings we have used for each platform:
- DDR5-5600B CL46 – Intel 14th & 13th Gen
- DDR5-5200 CL44 – Ryzen 7000
- DDR5-4800 (B) CL40 – Intel 12th Gen
Note: As we are running with a completely refreshed CPU test suite, this means we are currently re-testing other processors for our data sets. These will be added to the below graphs as soon as we have more results, and these will also be added to our Bench database. Thanks for your understanding.
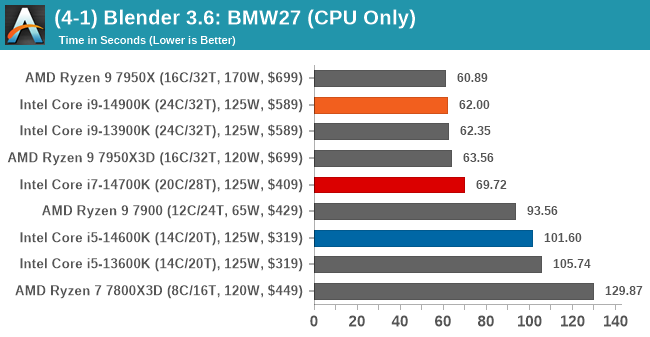
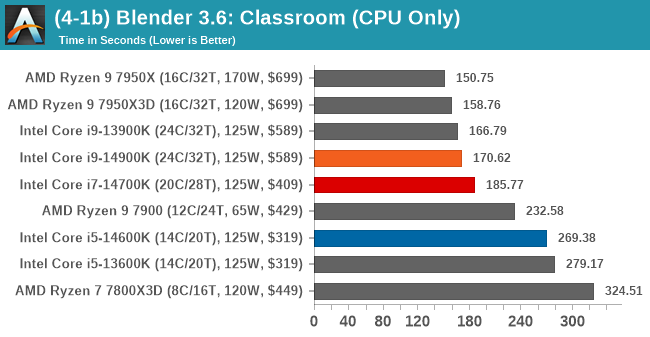
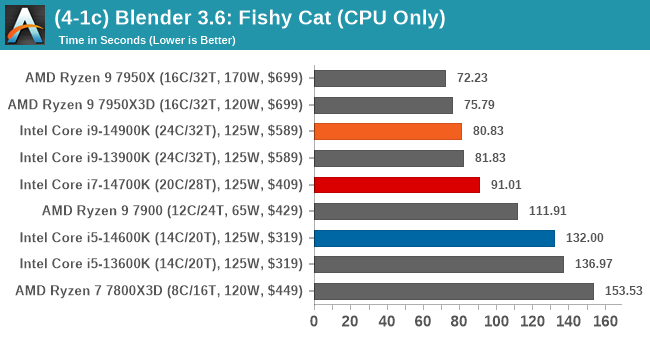
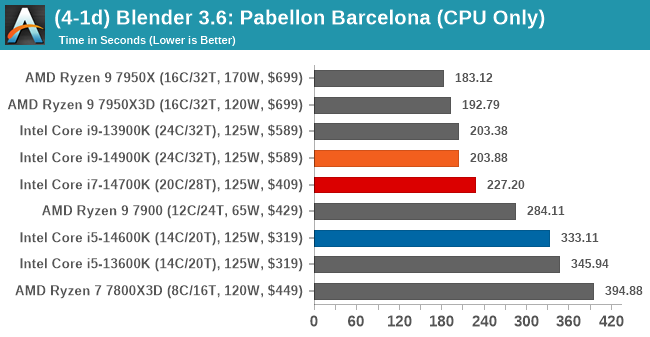
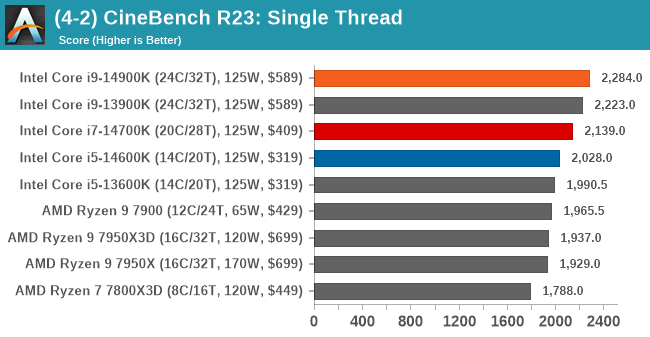
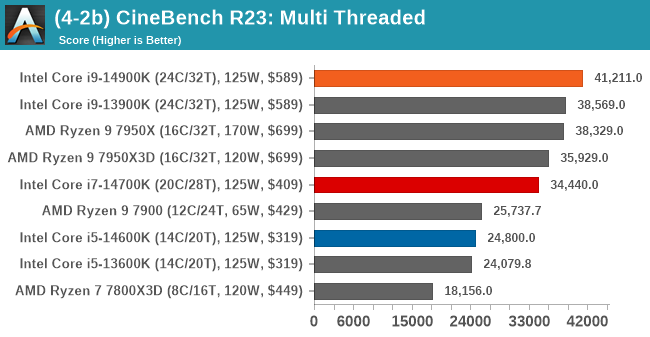
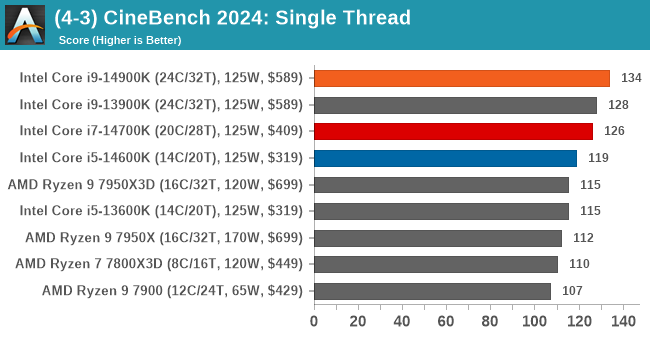
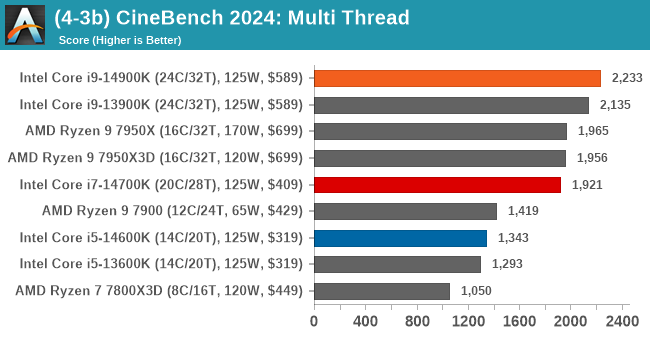
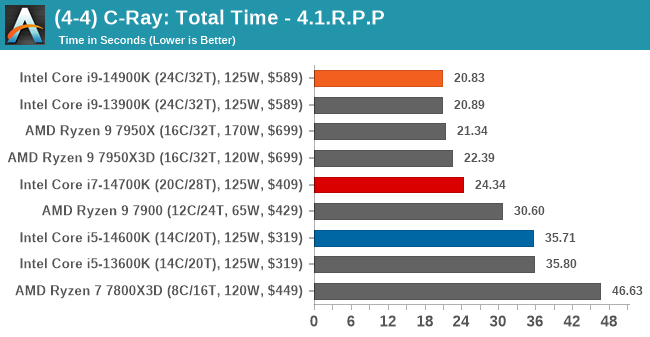
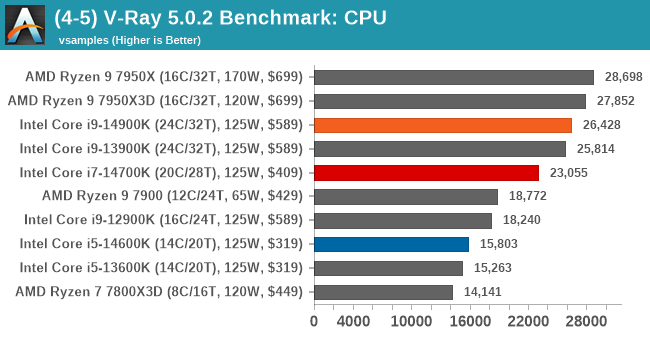
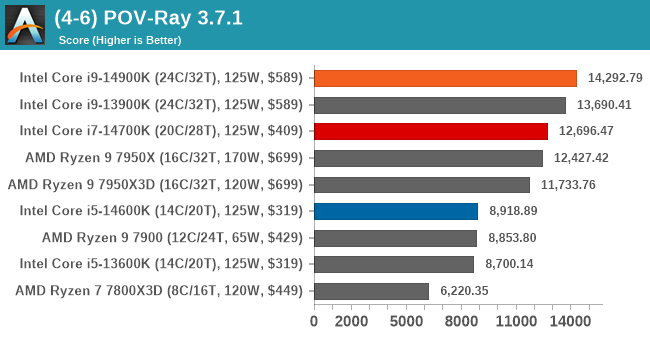
Although the Ryzen 9 7950X holds the top spot in Blender 3.6, the Core i9-14900K is clearly ahead in ST and MT performance in CineBench R23 and CineBench 2024. Per our encoding performance testing, the Core i5-14600K trades blows with the Ryzen 9 7900 again and is on level terms with the Core i5-14600K. The Core i7-14700K is again closer to the flagship chips and, in both CineBench MT tests, is close to AMD’s Ryzen 9 7950X3D.
Our Science section covers all the tests that typically resemble more scientific-based workloads and instruction sets. Simulation and Science have a lot of overlap in the benchmarking world. The benchmarks that fall under Science have a distinct use for the data they output – in our Simulation section, these act more like synthetics but, at some level, are still trying to simulate a given environment.
In the encrypt/decrypt scenario, how data is transferred and by what mechanism is pertinent to on-the-fly encryption of sensitive data – a process by which more modern devices are leaning to for software security.
Adding to our 2024 CPU suite, we’ve included the Montage Astronomical Image Mosaic Engine (MAIM) benchmark and OpenFOAM 1.2 and retained our gaming simulation benchmarks, including our Dwarf Fortress and Factorio benchmarks.
We are using DDR5 memory on the Core i9-14900K, Core i7-14700K, Core i5-14600K, and Intel’s 13th Gen at the relative JEDEC settings. The same methodology is also used for the AMD Ryzen 7000 series and Intel’s 12th Gen (Alder Lake) processors. Below are the settings we have used for each platform:
- DDR5-5600B CL46 – Intel 14th & 13th Gen
- DDR5-5200 CL44 – Ryzen 7000
- DDR5-4800 (B) CL40 – Intel 12th Gen
Note: As we are running with a completely refreshed CPU test suite, this means we are currently re-testing other processors for our data sets. These will be added to the below graphs as soon as we have more results, and these will also be added to our Bench database. Thanks for your understanding.
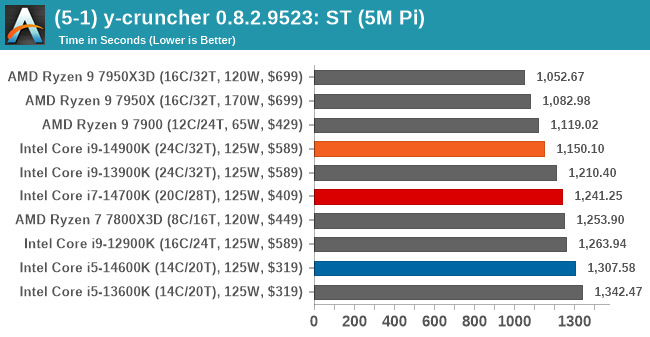
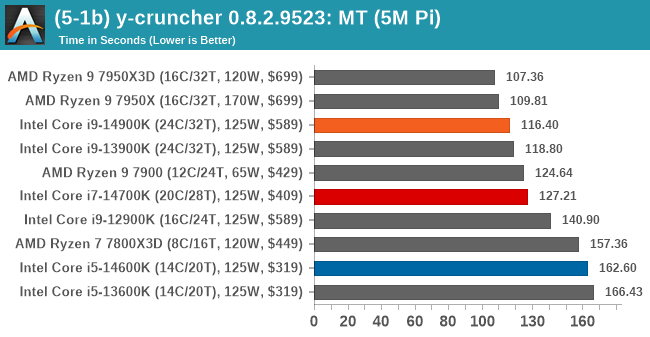
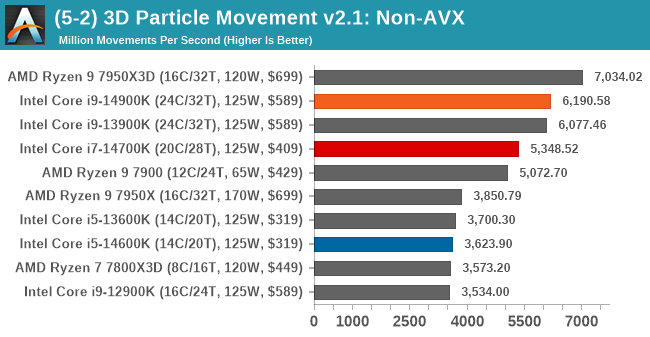
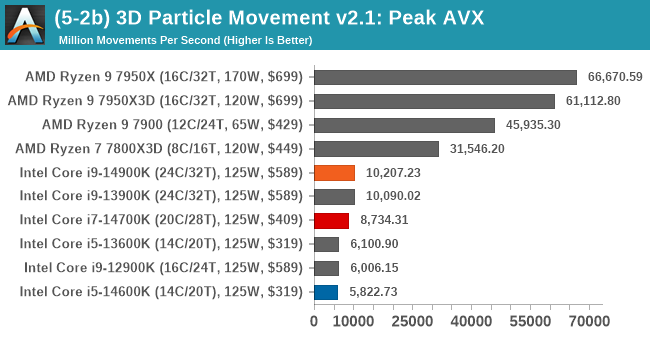
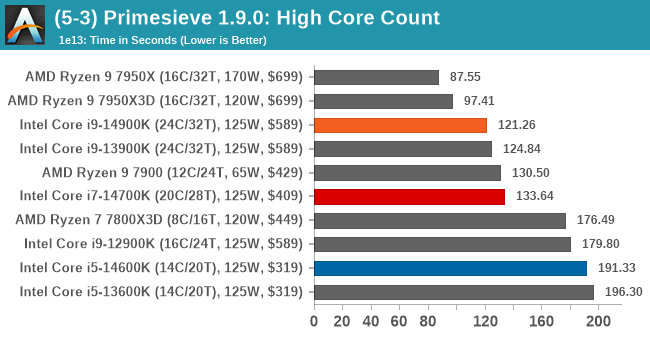
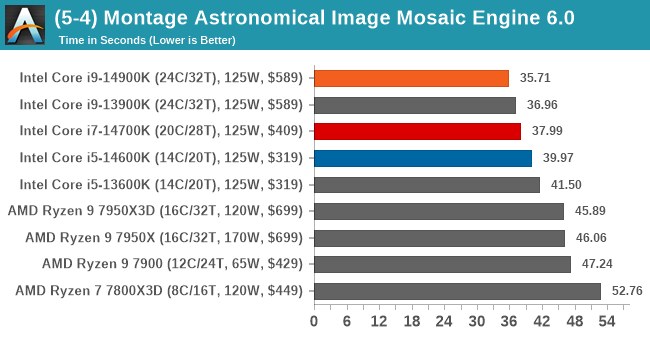
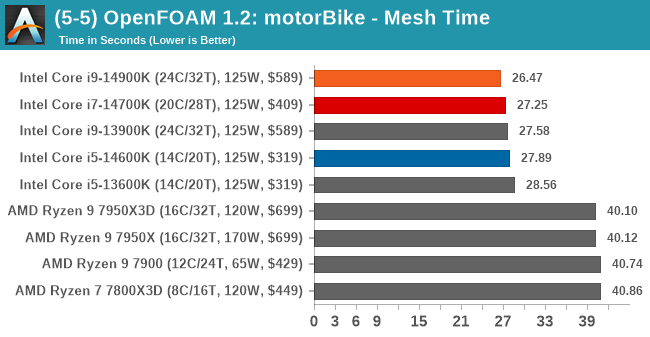
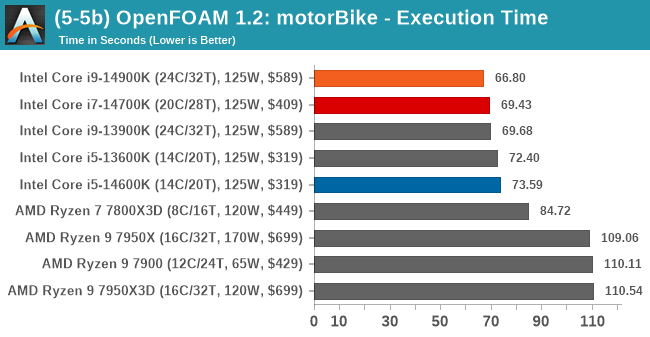
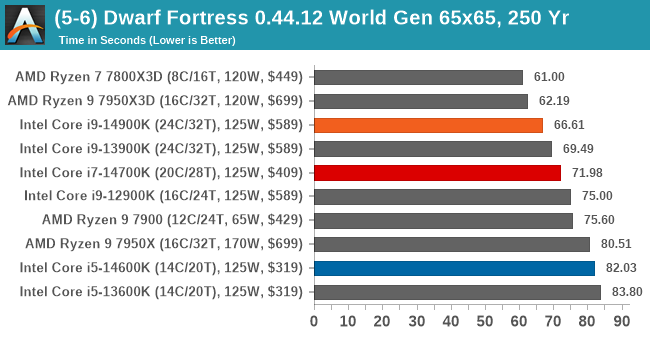
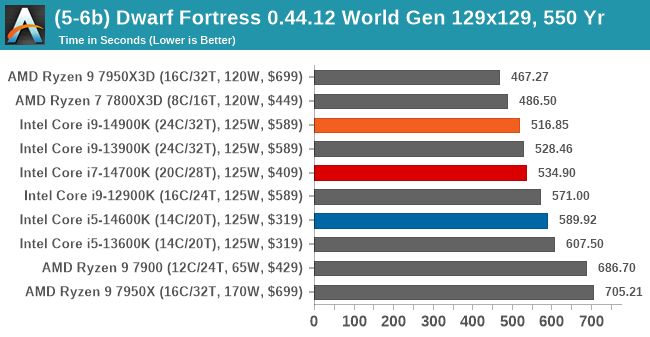
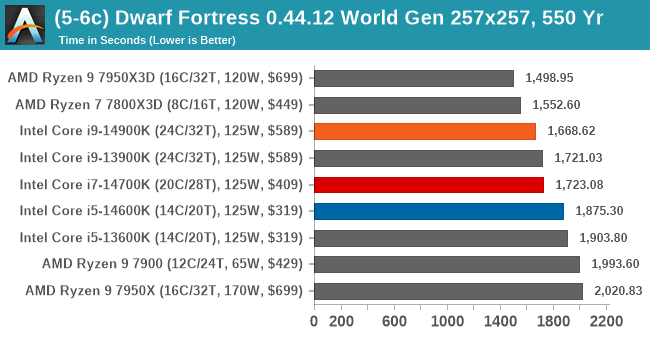
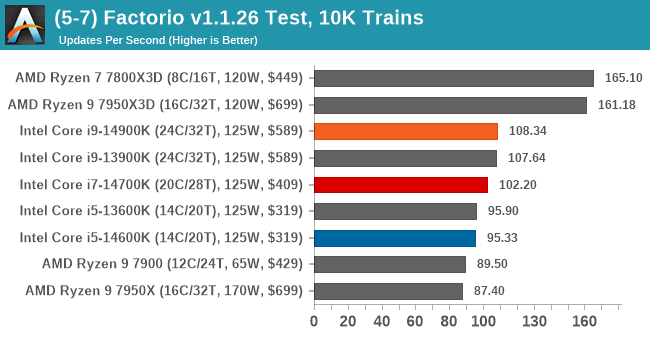
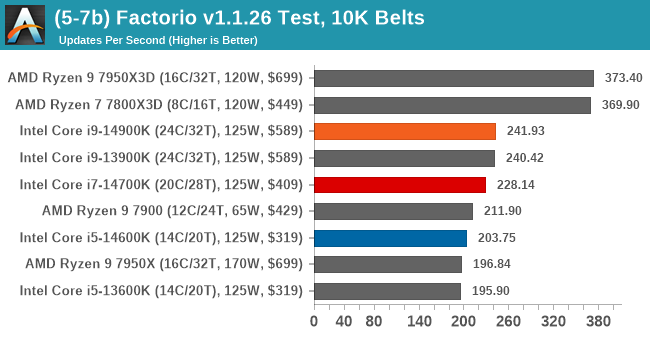
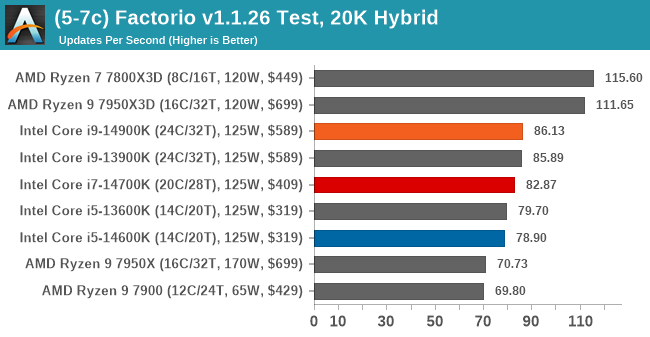
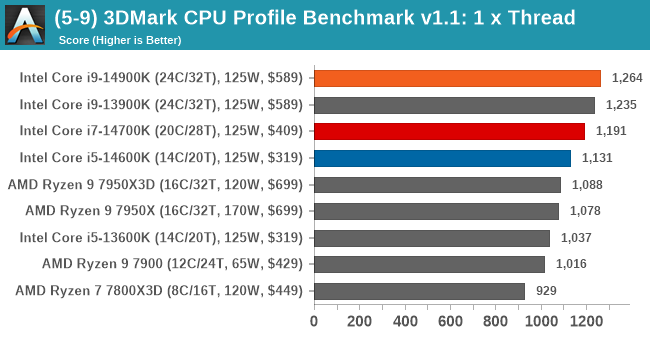
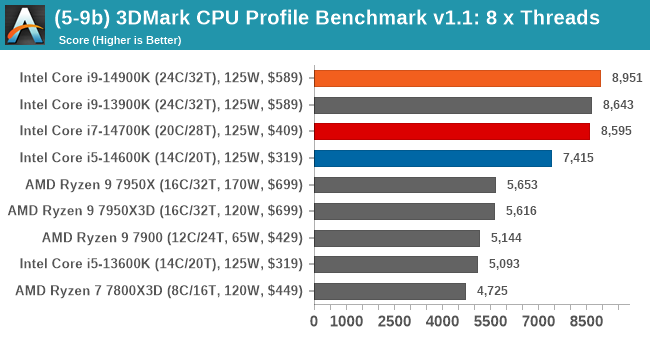
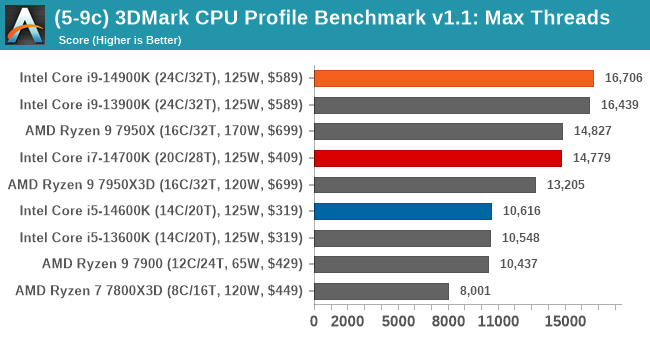
Noting the performance in 3DPM 2.1 with AVX instructions, the AMD Ryzen 7000 series CPUs do support this and, as a result, are clearly ahead in this specific test. In the other scientific and simulation-based workloads, the Ryzen 7000X3D chips perform better overall in Dwarf Fortress and Factorio, which are both game simulations, and they leverage the extra L3 cache available.
As expected, the Core i9-14900K and Core i9-13900K perform within margins of each other, and the same can be said about the Core i5 14600K to the Core i5-13600K. The Core i7-14700K isn’t too far off the performance of the Core i9s and is closer in performance to these than it is the Core i5s.
As technology progresses at a breakneck pace, so too do the demands of modern applications and workloads. With artificial intelligence (AI) and machine learning (ML) becoming increasingly intertwined with our daily computational tasks, it’s paramount that our reviews evolve in tandem. Recognizing this, we have AI and inferencing benchmarks in our CPU test suite for 2024.
Traditionally, CPU benchmarks have focused on various tasks, from arithmetic calculations to multimedia processing. However, with AI algorithms now driving features within some applications, from voice recognition to real-time data analysis, it’s crucial to understand how modern processors handle these specific workloads. This is where our newly incorporated benchmarks come into play.
As chip makers such as AMD with Ryzen AI and Intel with their Meteor Lake mobile platform feature AI-driven hardware within the silicon, it seems in 2024, and we’re going to see many applications using AI-based technologies coming to market.
We are using DDR5 memory on the Core i9-14900K, Core i7-14700K, Core i5-14600K, and Intel’s 13th Gen at the relative JEDEC settings. The same methodology is also used for the AMD Ryzen 7000 series and Intel’s 12th Gen (Alder Lake) processors. Below are the settings we have used for each platform:
- DDR5-5600B CL46 – Intel 14th & 13th Gen
- DDR5-5200 CL44 – Ryzen 7000
- DDR5-4800 (B) CL40 – Intel 12th Gen
Note: As we are running with a completely refreshed CPU test suite, this means we are currently re-testing other processors for our data sets. These will be added to the below graphs as soon as we have more results, and these will also be added to our Bench database. Thanks for your understanding.
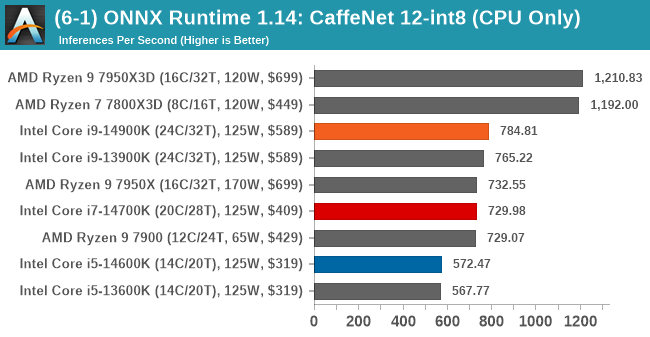
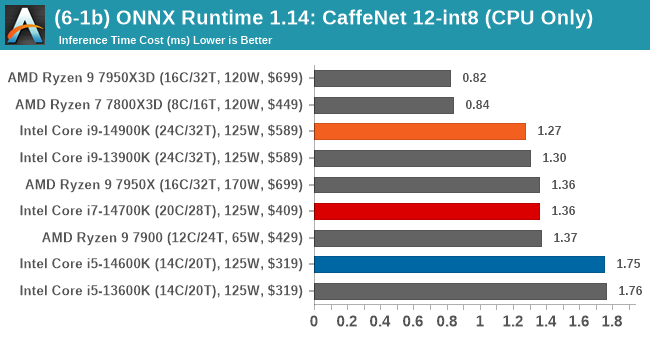
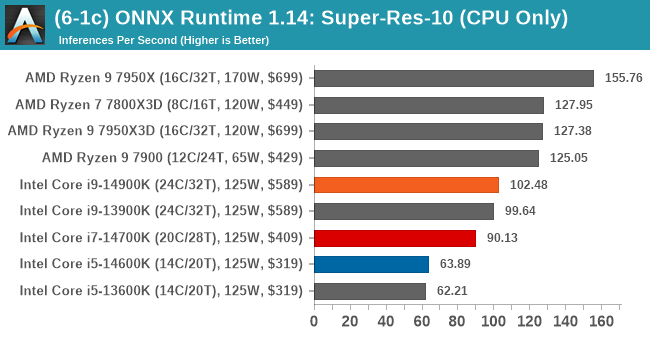
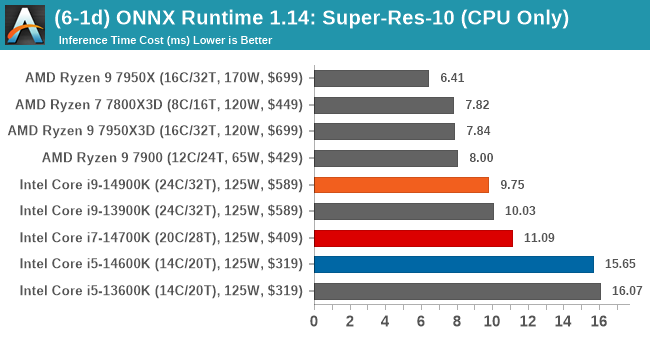
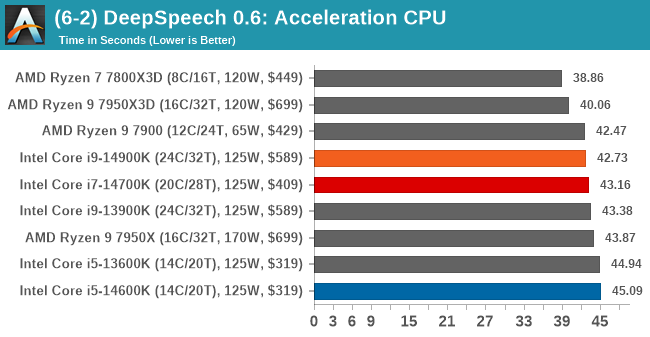

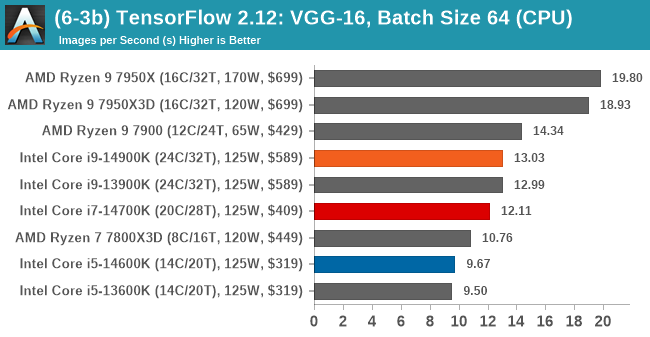
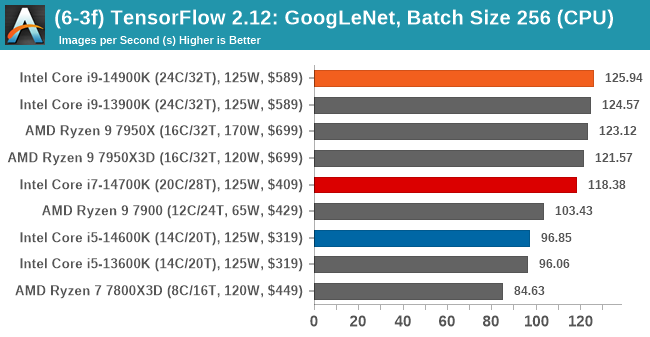
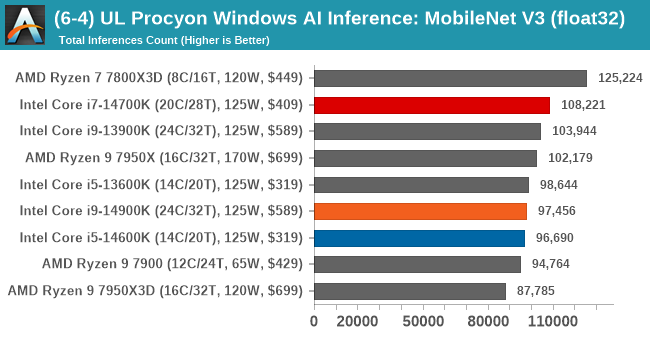
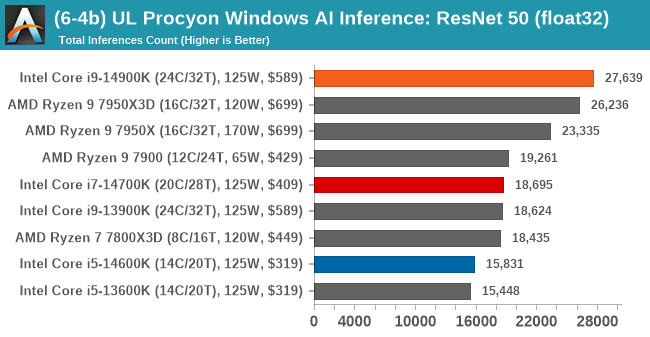
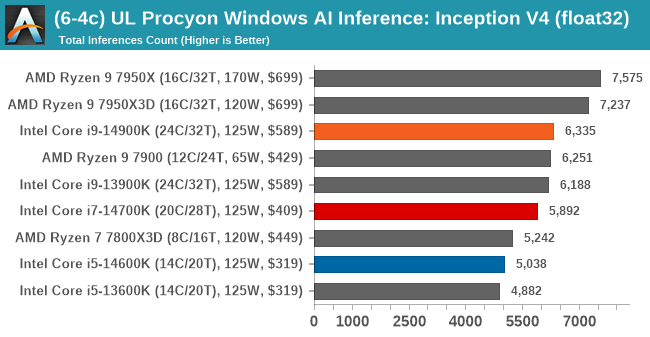
Digesting performance in the latest addition to our CPU test suite for 2024, it’s clear that the extra L3 cache on the Ryzen 7000X3D processors has a clear benefit in ONNX when using the INT8 model. Even in ONNX with Super-Res-10, the AMD Ryzen CPUs seem to do a better job of inferencing than Intel. It does appear that more L3 cache can benefit performance in this area, and even in TensorFlow with VGG-16, the AMD Ryzen 9 7950X seems to perform the best. Outside of that, the Core i9-14900K is next best, just marginally ahead of the Core i9-13900K.
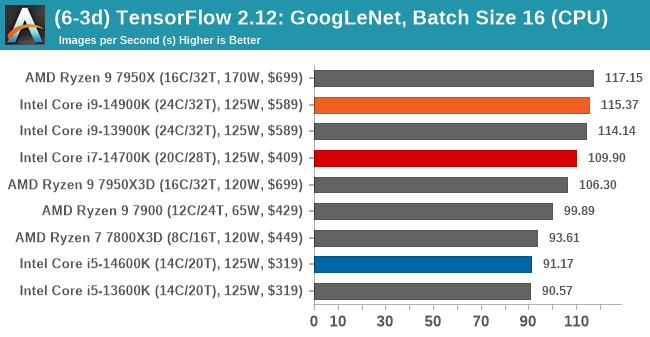
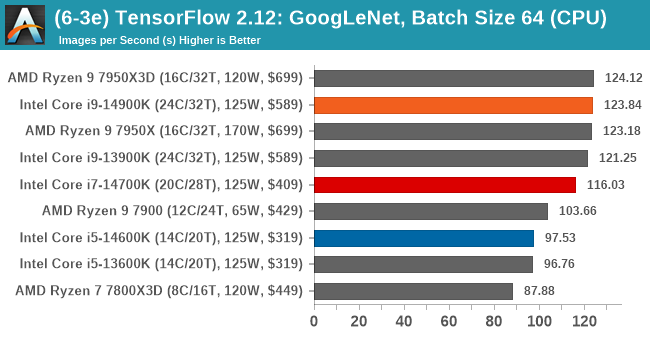
The Core i7-14700K performs respectively, and while the Core i5-14600K can certainly handle AI and inferencing, it doesn’t offer quite the grunt of the Core i9 and Core i7 series chips.
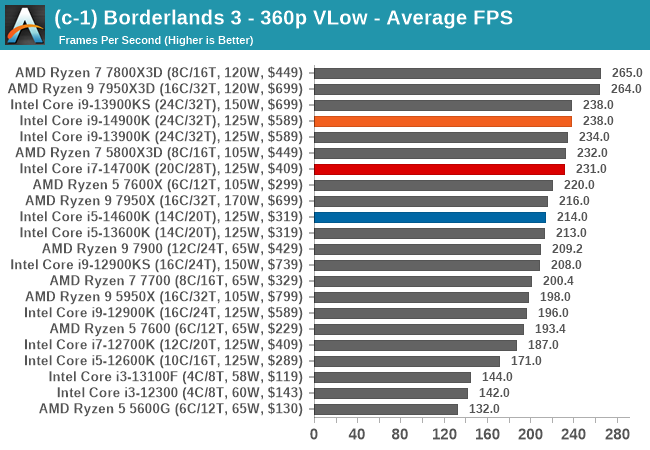
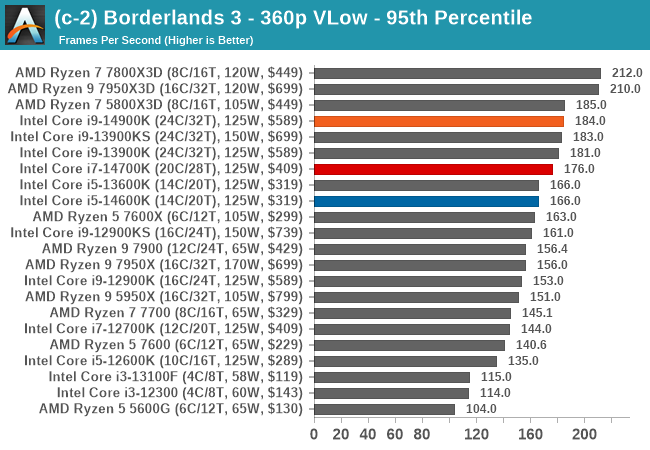
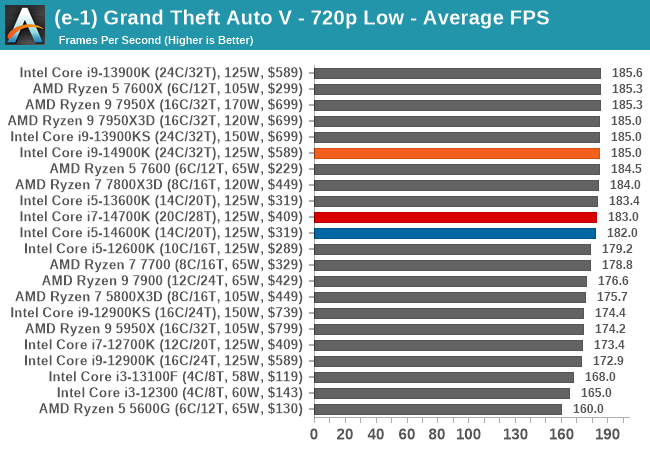
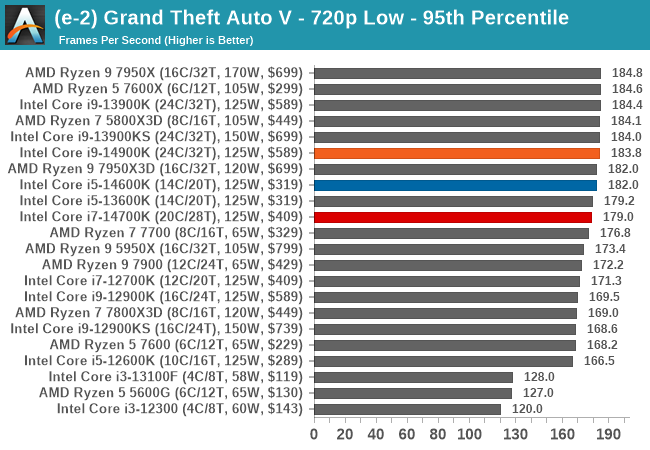
The reason we test games in CPU reviews at lower resolutions such as 720p and below is simple; titles are more likely to be CPU bound than they are GPU bound at lower resolutions. This means there are more frames for the processor to process as opposed to the graphics card doing the majority of the heavy lifting.
There are some variances where some games will still use graphical power, but not as much CPU grunt at these smaller resolutions, and this is where we can show where CPU limitations lie in terms of gaming.
We are using DDR5 memory on the Core i9-14900K, Core i7-14700K, Core i5-14600K, and Intel’s 13th Gen at the relative JEDEC settings. The same methodology is also used for the AMD Ryzen 7000 series and Intel’s 12th Gen (Alder Lake) processors. Below are the settings we have used for each platform:
- DDR5-5600B CL46 – Intel 14th & 13th Gen
- DDR5-5200 CL44 – Ryzen 7000
- DDR5-4800 (B) CL40 – Intel 12th Gen
Civilization VI
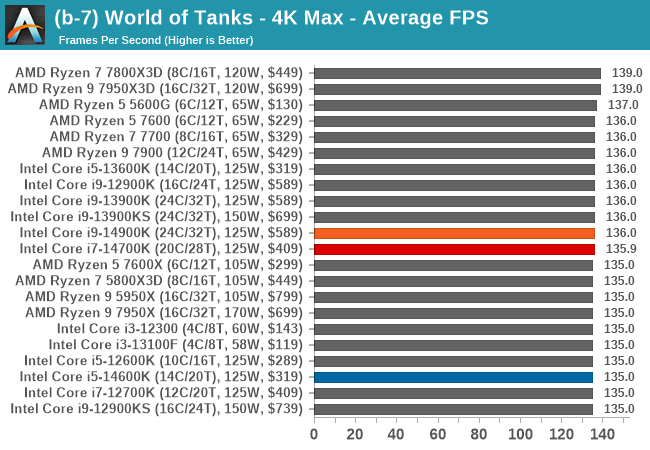
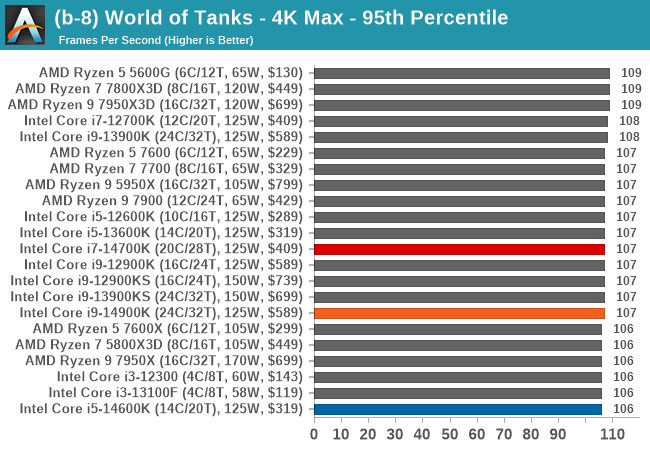
World of Tanks
Borderlands 3
Grand Theft Auto V
Red Dead Redemption 2
F1 2022
Hitman 3
Total War: Warhammer 3
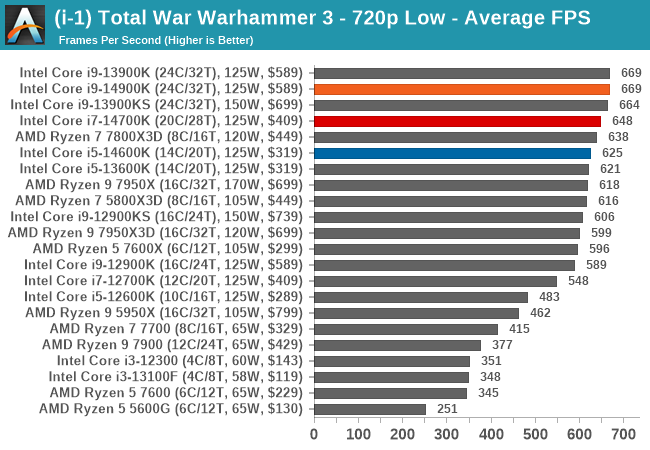
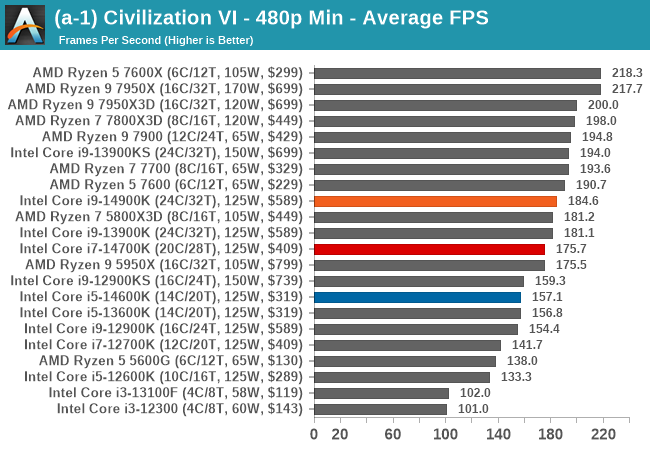
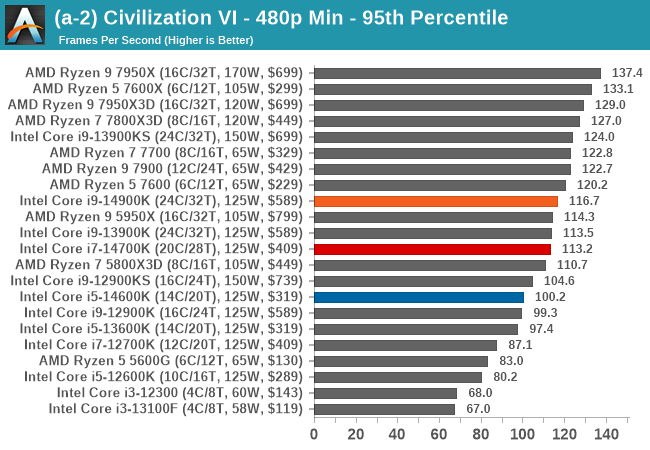
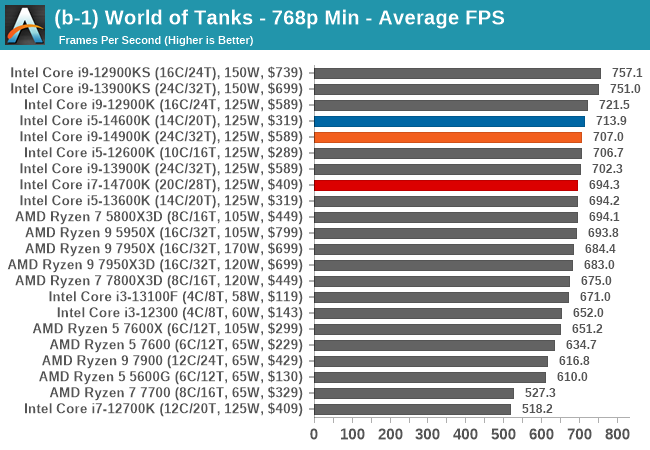
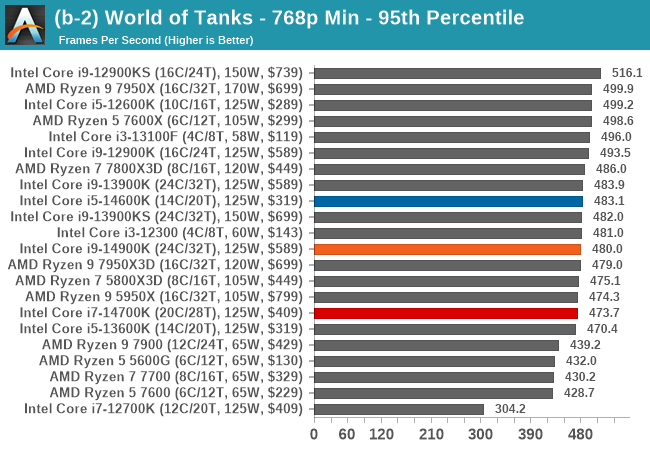
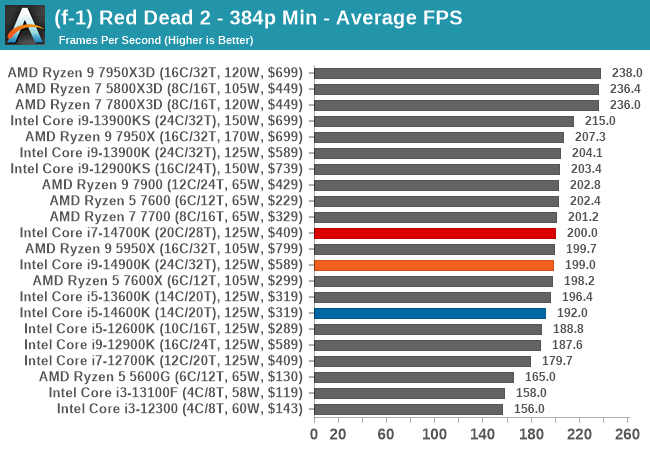
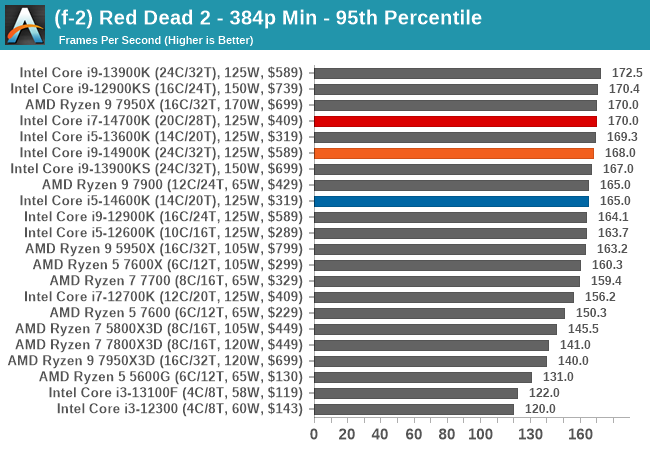
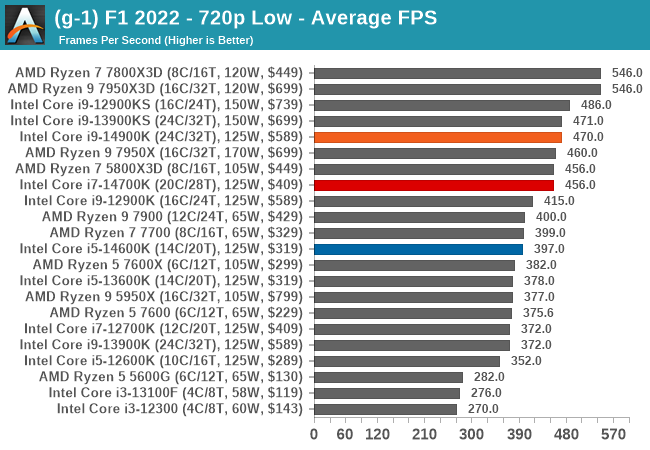
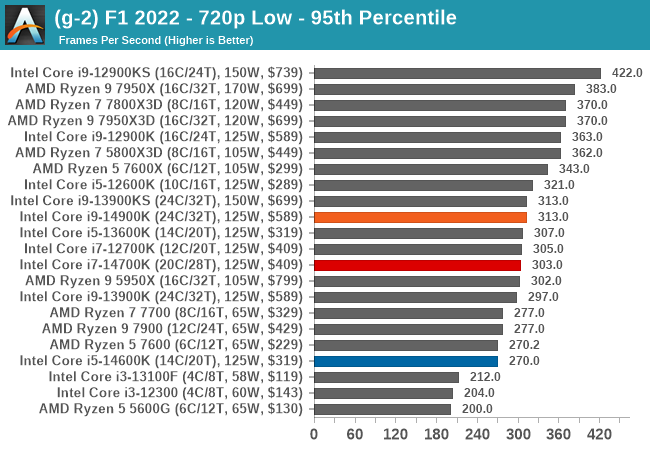
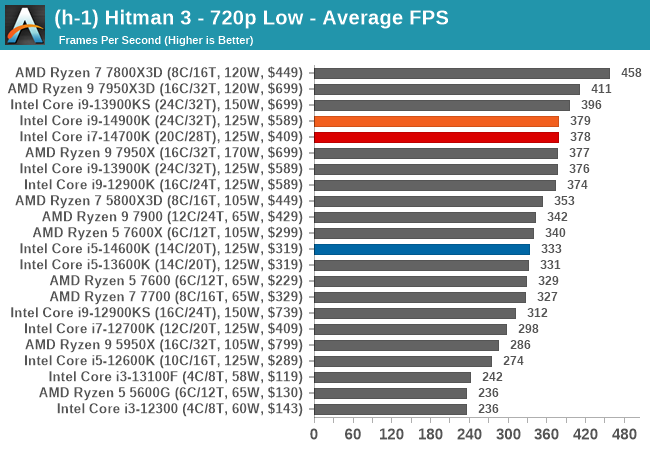
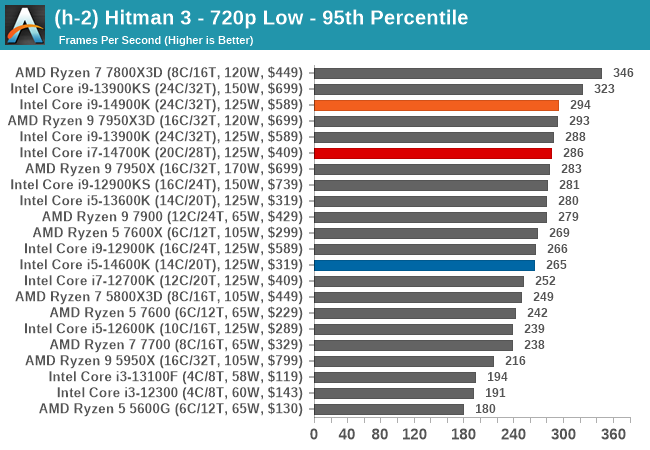
Looking at CPU performance without GPU bottlenecks at 720p and lower resolutions, we can see that the Core i9-14900K performs very similarly to the Core i9-13900K and Core i9-13900KS. In scenarios where games can use more L3 cache, the AMD Ryzen 7000 with 3D V-Cache (X3D) chips are the victors. In Civ V, we can see that the game prefers AMD cores as opposed to Intel’s, but overall, none of the new Intel 14th Gen Core series chips perform badly.
The interesting CPU is the Core i9-14700K, which is closer to the Core i9-14900K than we’ve seen from going from an i7 to an i9 or an i5 to an i7 within previous generations. The gap between the Core i9-14900K and Core i7-14700K is as close as we were expecting, given it only has four fewer E-cores than the Core i9 and with slightly slower core clock speeds.
Moving along, here’s a look at a more balanced gaming scenario, running games at 1080p with maximum image quality.
We are using DDR5 memory on the Core i9-14900K, Core i7-14700K, Core i5-14600K, and Intel’s 13th Gen at the relative JEDEC settings. The same methodology is also used for the AMD Ryzen 7000 series and Intel’s 12th Gen (Alder Lake) processors. Below are the settings we have used for each platform:
- DDR5-5600B CL46 – Intel 14th & 13th Gen
- DDR5-5200 CL44 – Ryzen 7000
- DDR5-4800 (B) CL40 – Intel 12th Gen
Civilization VI
World of Tanks
Borderlands 3
Grand Theft Auto V
Red Dead Redemption 2
F1 2022
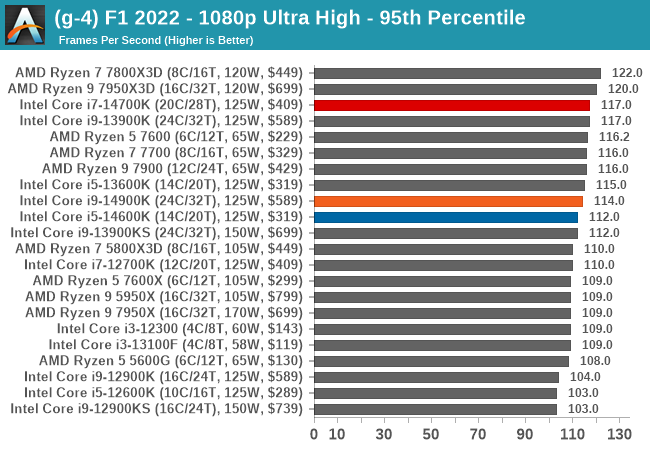
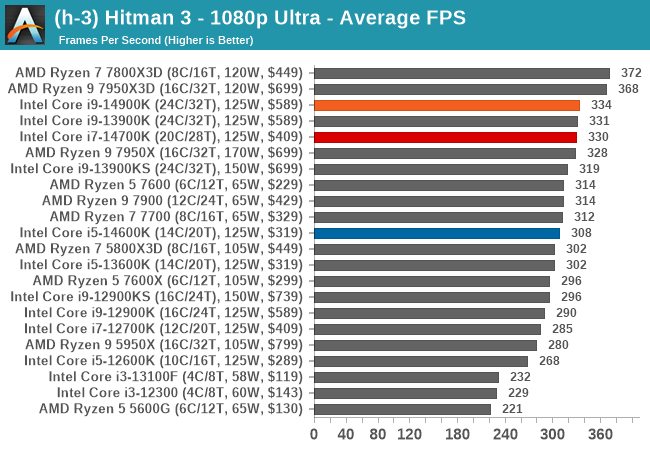
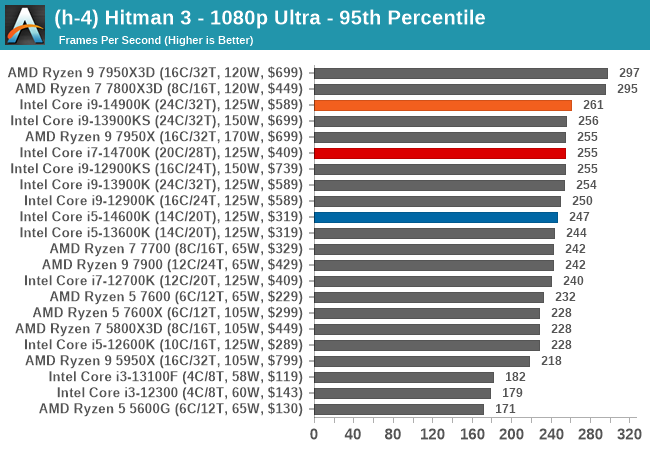
Hitman 3
Total War: Warhammer 3
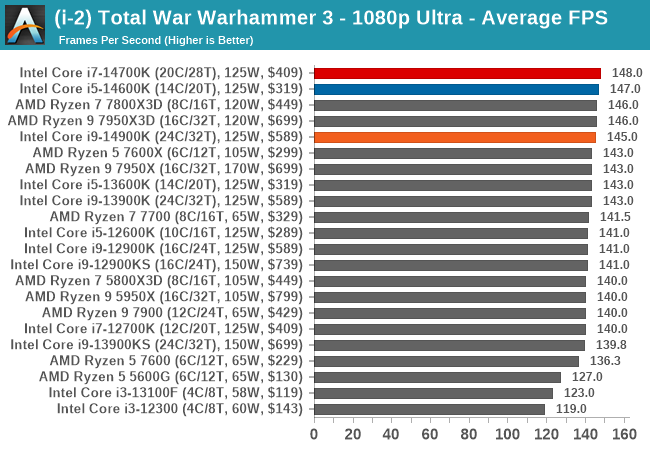
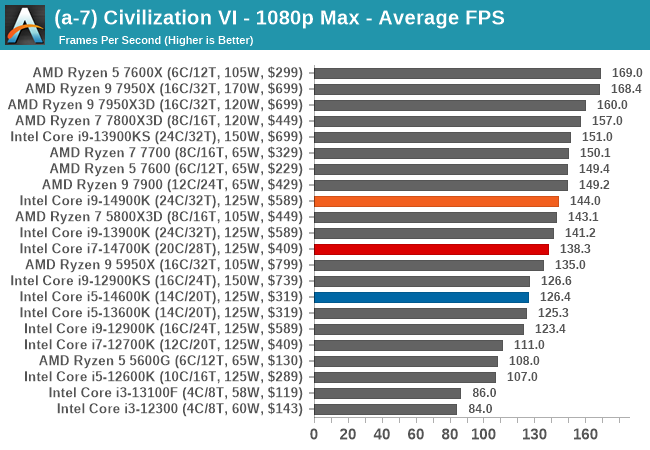
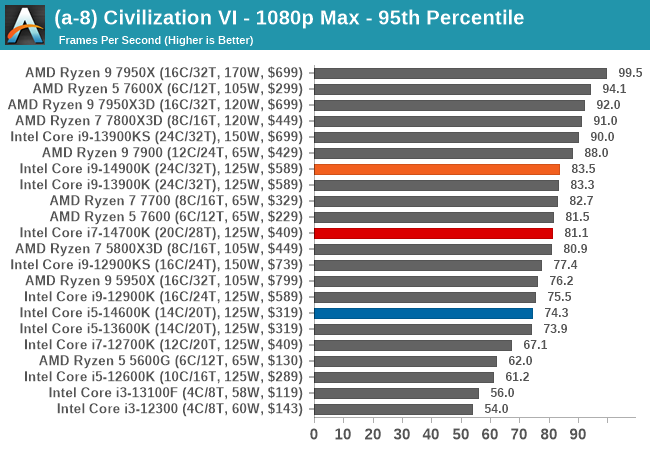
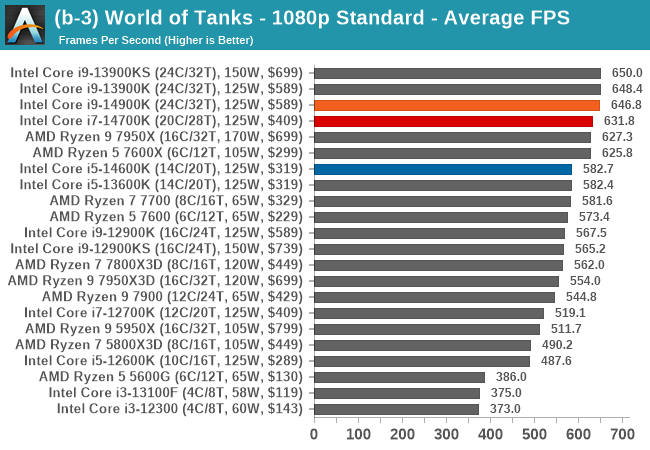
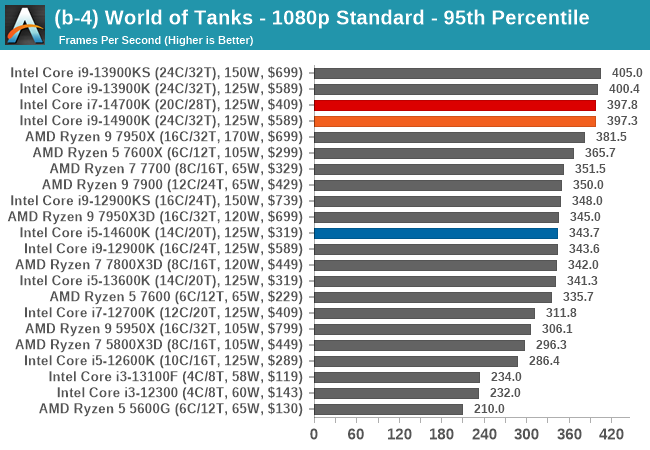
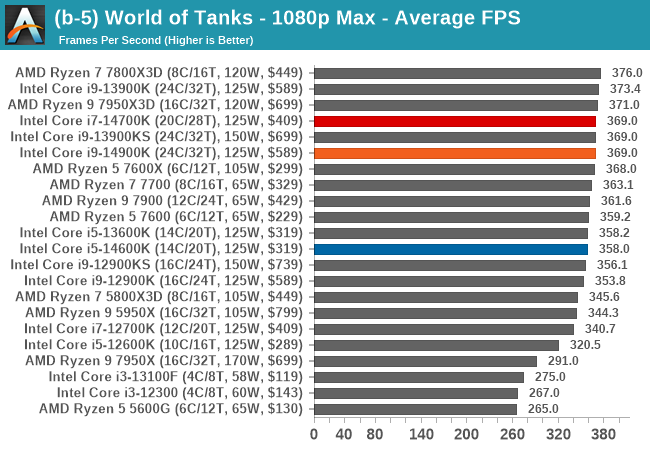
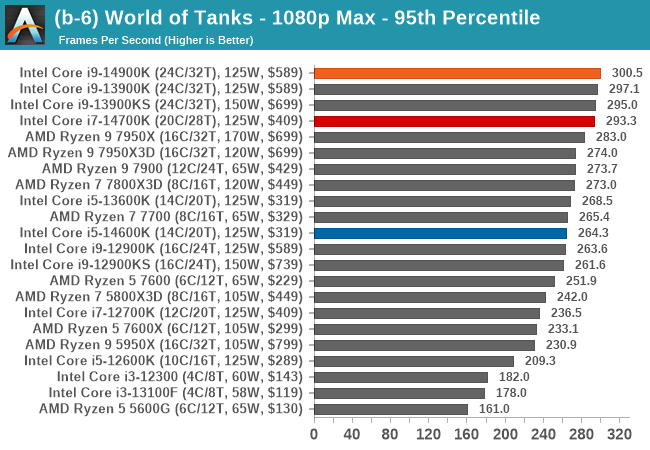
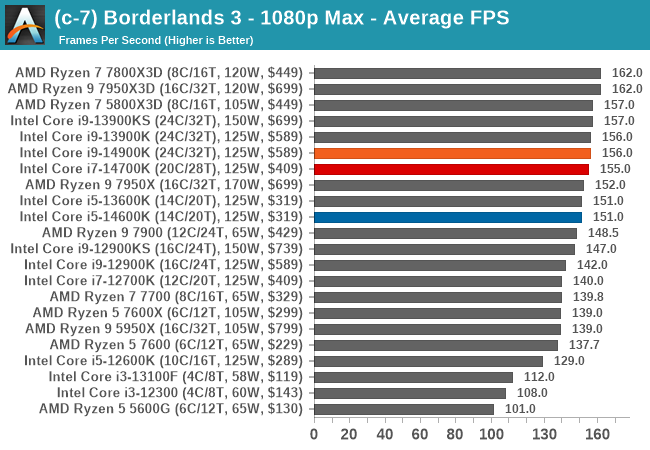
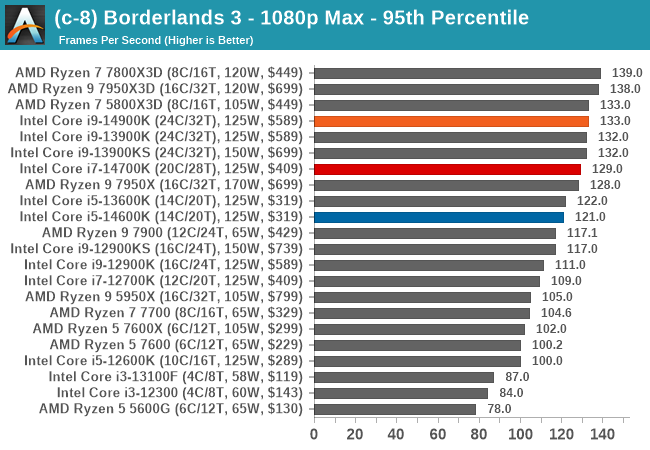
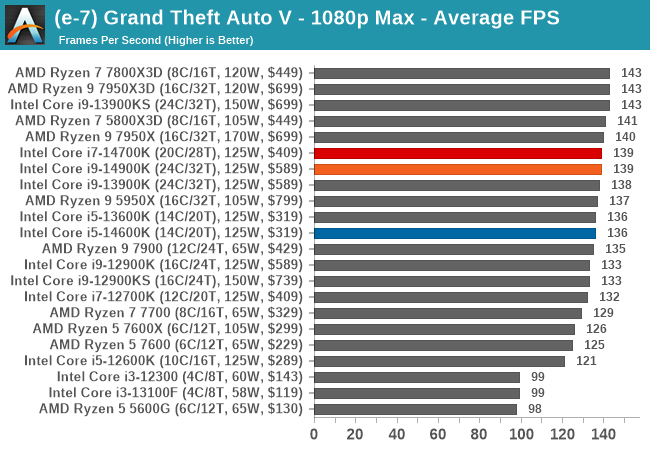
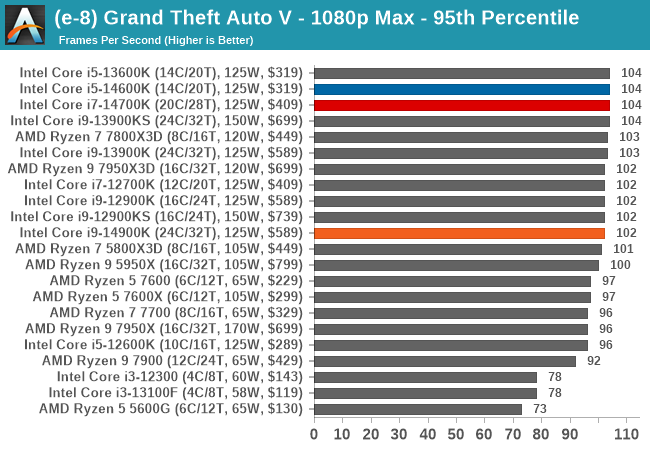
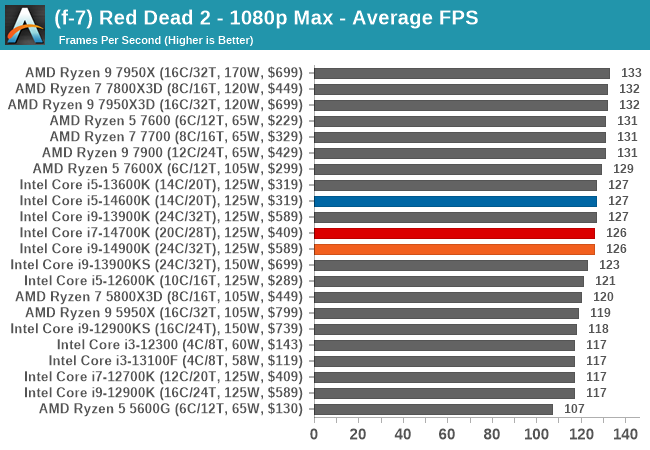
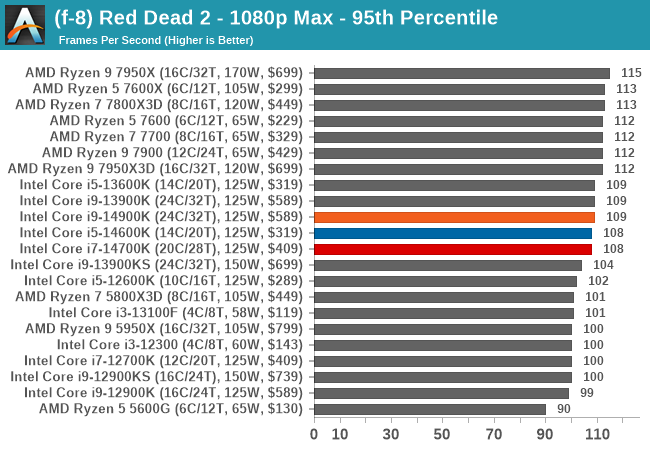
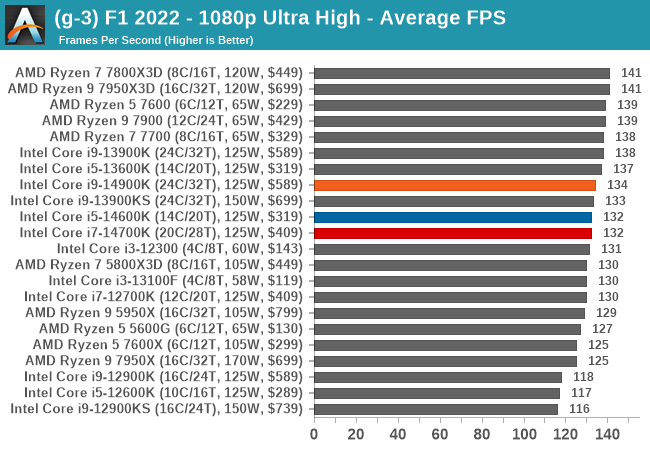
Moving onto 1080p with the maximum settings applied this brings the graphics power into the equation, but CPU core performance is also important here. As we saw at 720p resolutions, the Core i9-14900K again performs similarly to our results with the Core i9-13900K and Core i9-13900KS. In situations where the Core i9-14900K beats its predecessors, it’s only marginal.
Not surprisingly, the Core i9-14700K also performs well compared to Intel’s Core i9 chips and against AMD’s Ryzen 7000 series processors. Outside of World of Tanks, which is optimized for chips with a higher core count, the Core i5-14600K is also very capable, and with a cheaper MSRP, it represents good value for money where the title can’t utilize or is poorly optimized for higher numbers of cores.
In our Ryzen 7000 series review, we saw users commenting about testing games for CPU reviews at 1440p, so we have duly obliged here. Those interested in 1440p performance with minimal image quality – particularly the esports crowd – will be glad to know that we will be testing at this resolution going forward into 2023 and beyond.
We are using DDR5 memory on the Core i9-14900K, Core i7-14700K, Core i5-14600K, and Intel’s 13th Gen at the relative JEDEC settings. The same methodology is also used for the AMD Ryzen 7000 series and Intel’s 12th Gen (Alder Lake) processors. Below are the settings we have used for each platform:
- DDR5-5600B CL46 – Intel 14th & 13th Gen
- DDR5-5200 CL44 – Ryzen 7000
- DDR5-4800 (B) CL40 – Intel 12th Gen
Civilization VI
Borderlands 3
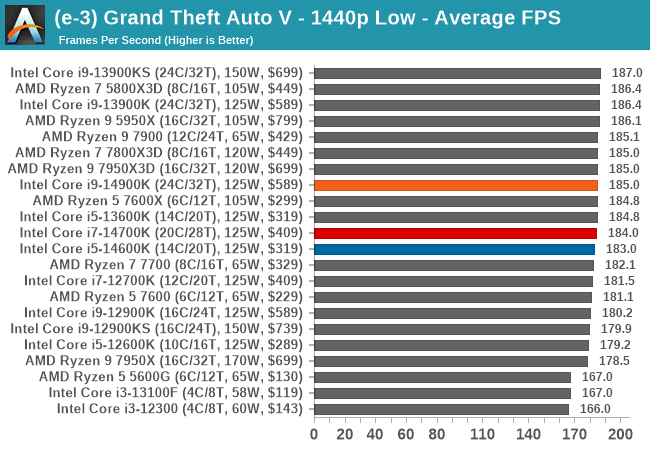
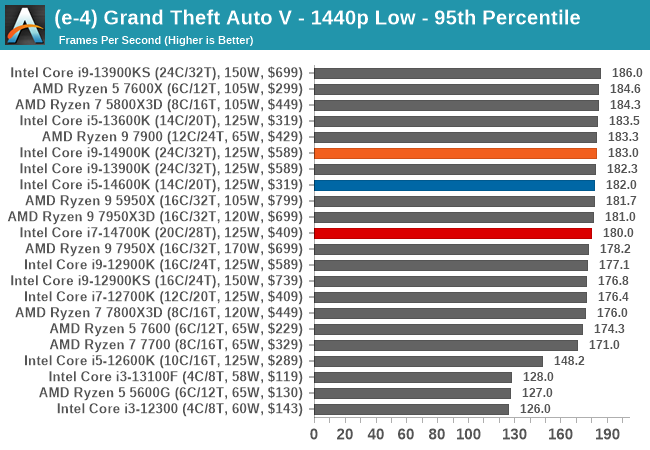
Grand Theft Auto V
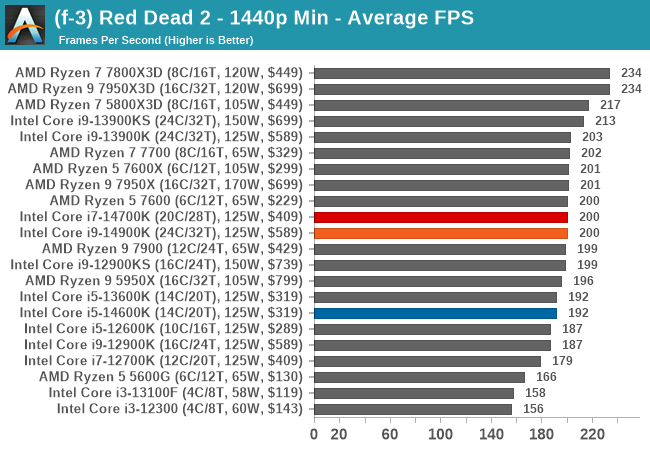
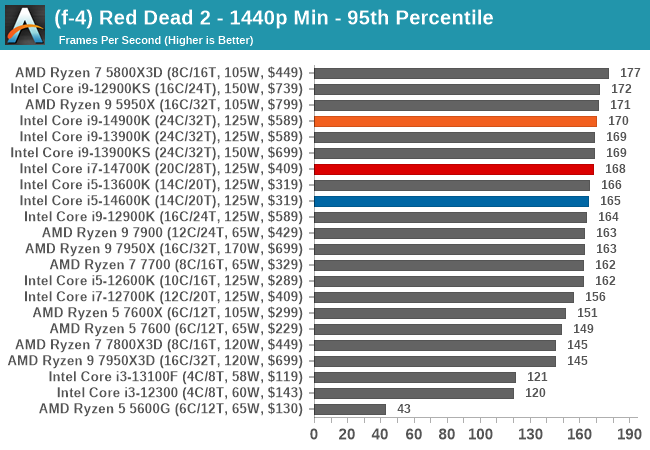
Red Dead Redemption 2
F1 2022

Hitman 3
Total War: Warhammer 3
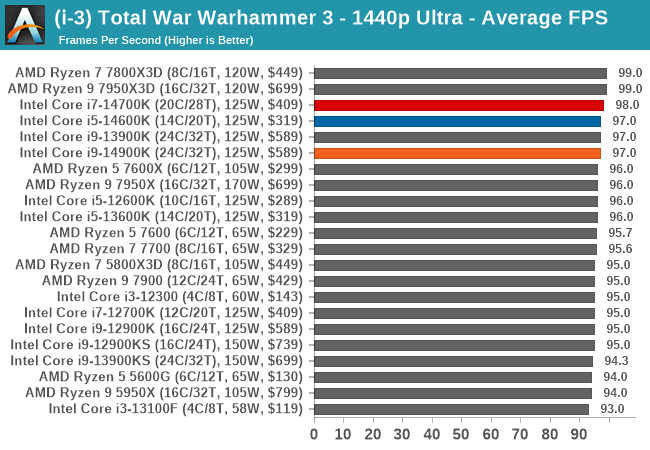
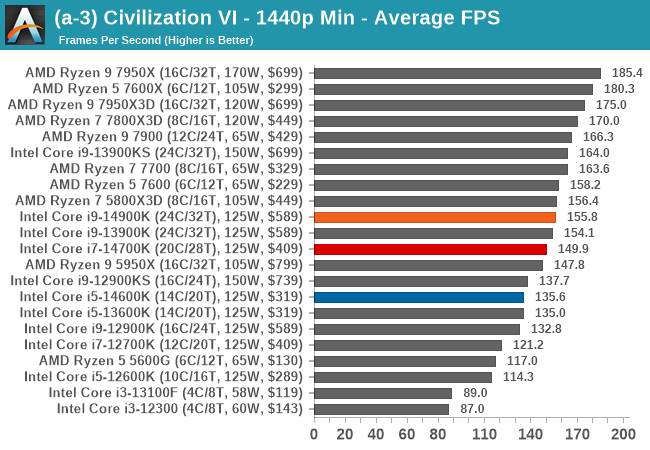
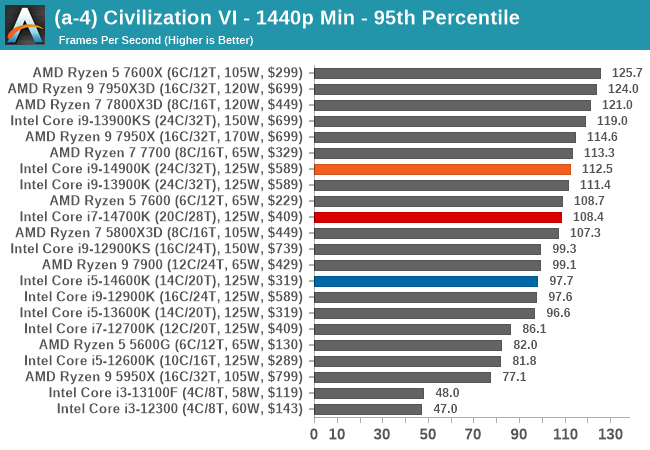
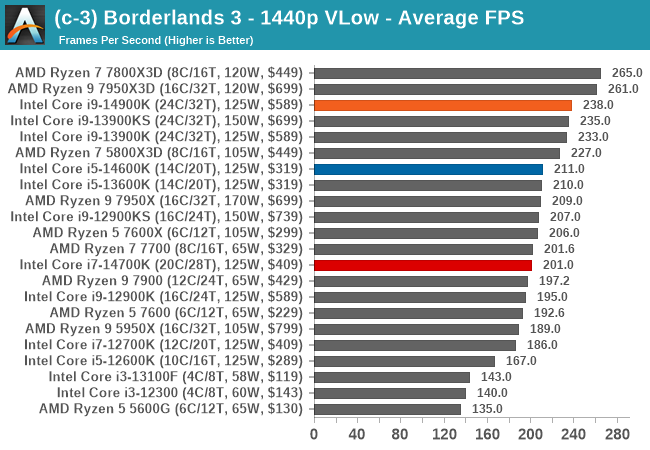
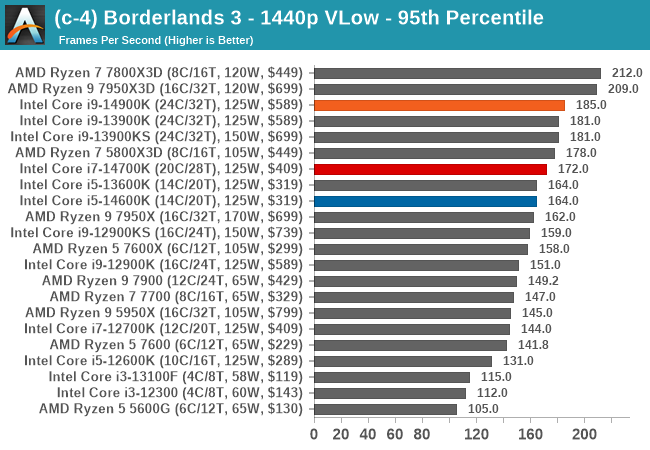
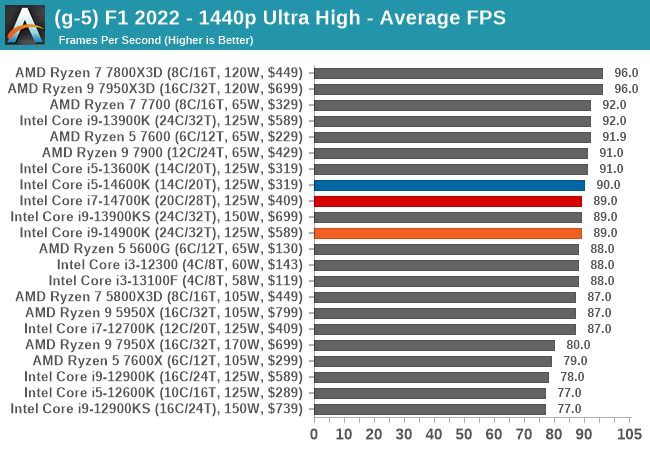
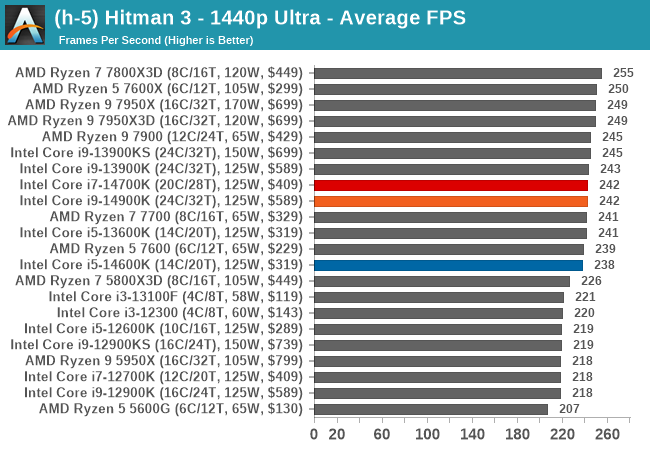
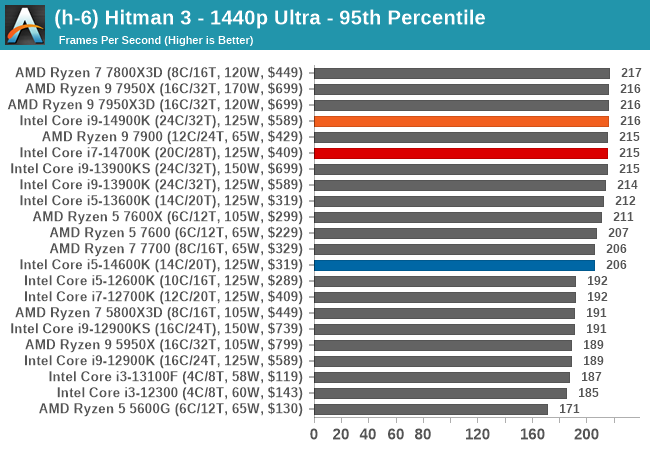
At 1440p resolutions, again, Civ V favors the AMD cores over Intel’s. but across the game set we’ve tested, the Core i9-14900K, Core i7-14700K, and the Core i5-14600K are all competitive.
Comparing the Core i9-14900K to the Core i9-13900K and KS chips, they perform within very fine margins of each other, which is understandable given all three are practically the same chip with slight variations in turbo clock speeds. The Core i7-14700K is in and around the mix of the Core i9 chips too, while the Core i5-14600K and the Core i5-13600K trade blows.
Last, we have our 4K gaming results.
We are using DDR5 memory on the Core i9-14900K, Core i7-14700K, Core i5-14600K, and Intel’s 13th Gen at the relative JEDEC settings. The same methodology is also used for the AMD Ryzen 7000 series and Intel’s 12th Gen (Alder Lake) processors. Below are the settings we have used for each platform:
- DDR5-5600B CL46 – Intel 14th & 13th Gen
- DDR5-5200 CL44 – Ryzen 7000
- DDR5-4800 (B) CL40 – Intel 12th Gen
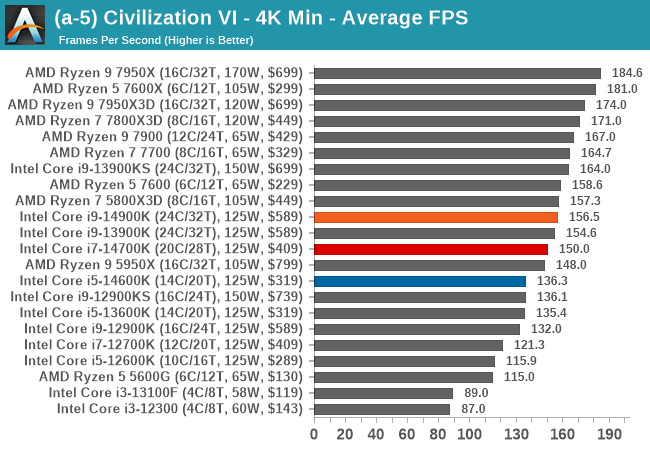
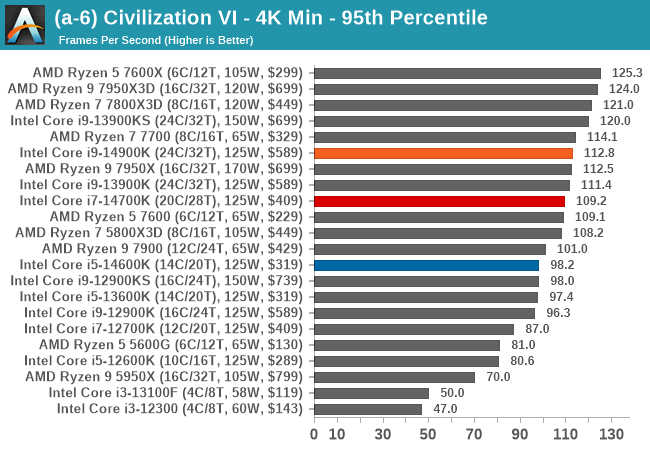
Civilization VI
World of Tanks
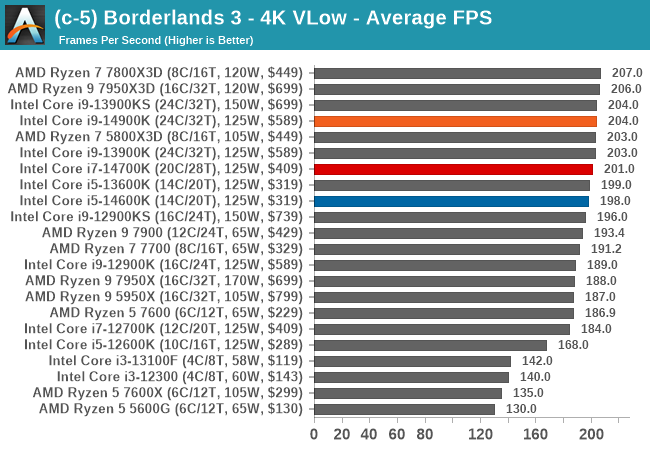
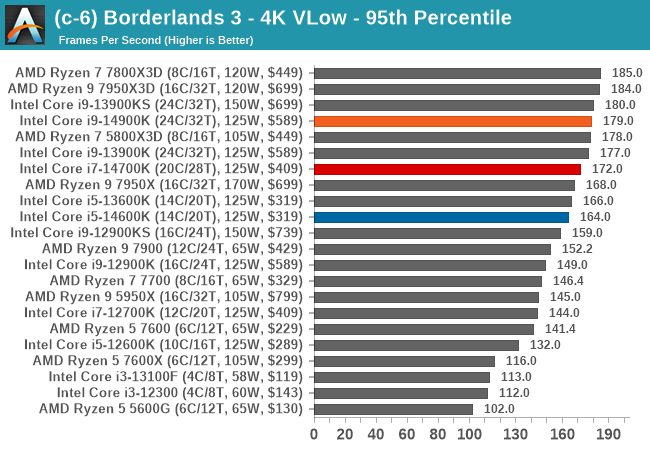
Borderlands 3
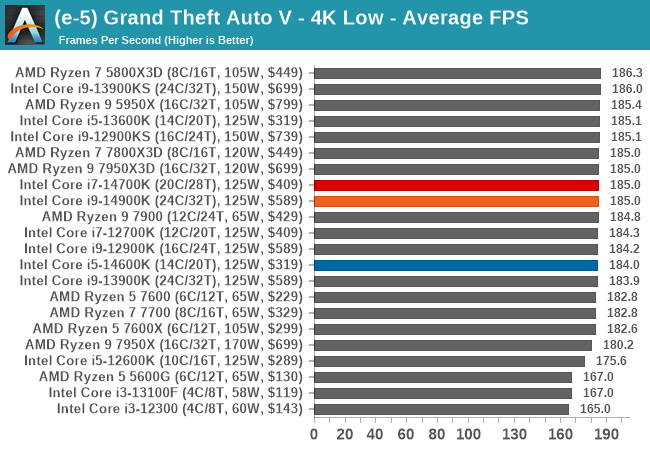
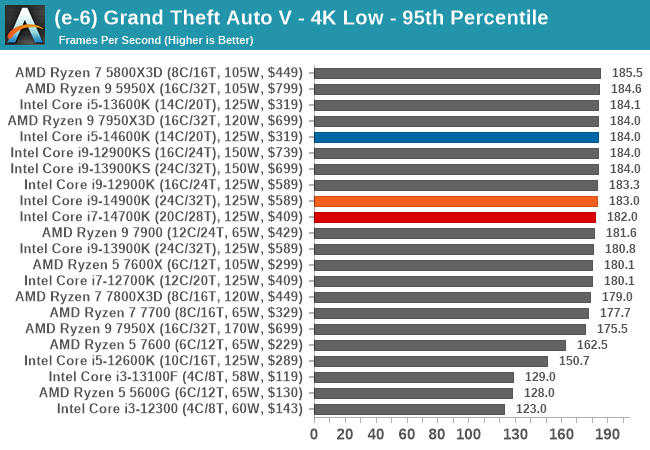
Grand Theft Auto V
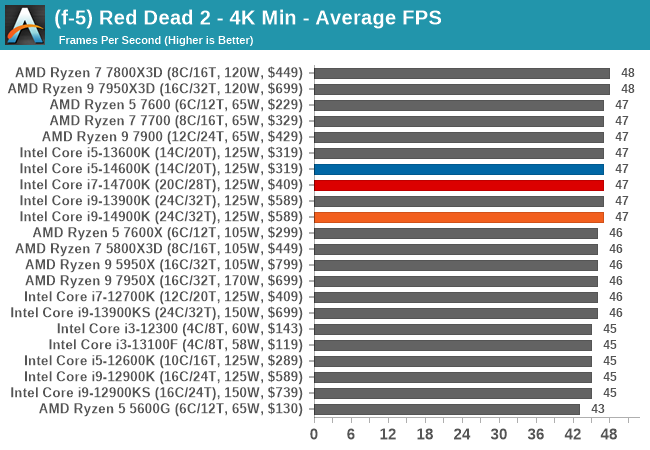
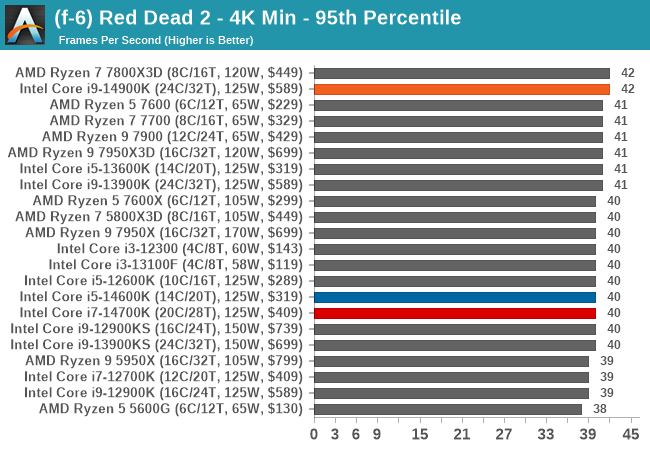
Red Dead Redemption 2
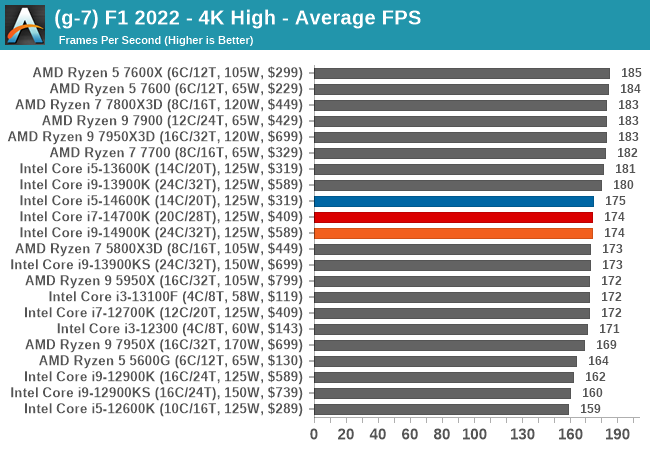
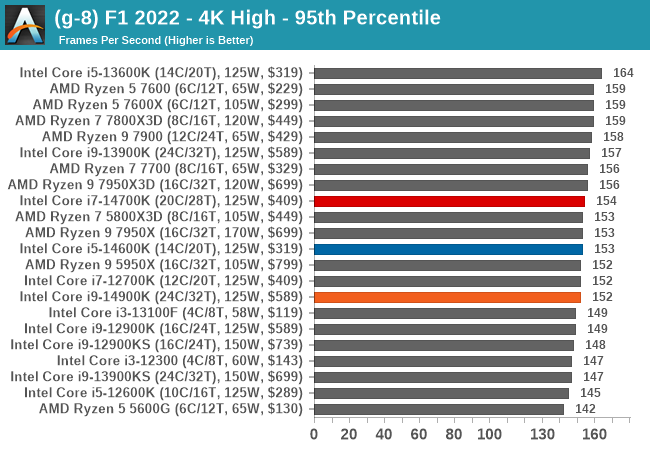
F1 2022
Hitman 3
Total War: Warhammer 3
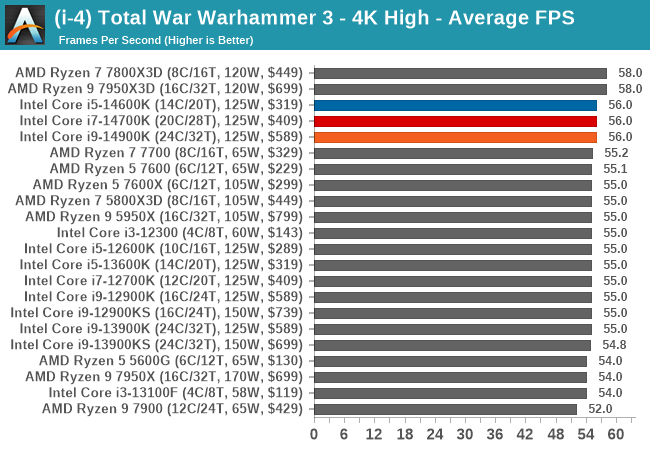
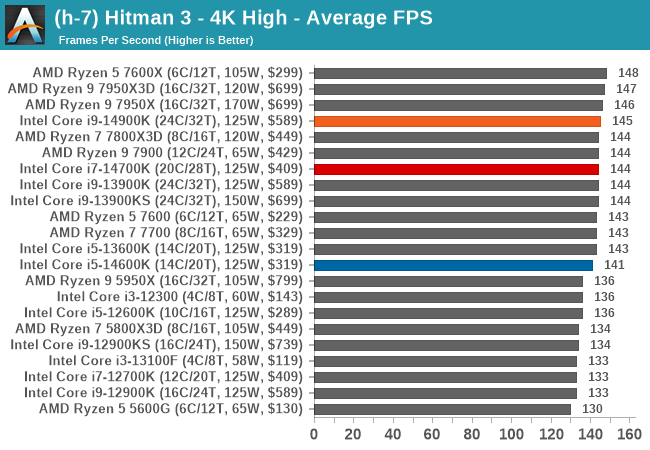
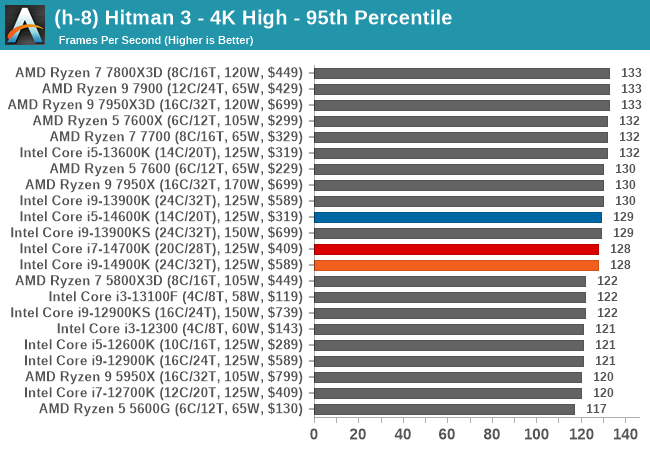
At 4K resolutions, the CPU becomes somewhat of an oxymoron in that any capable CPU should be fine, but the onus comes more on graphics than anything else. As we can see in our 4K results, most of the chips tested perform within a similar scope to each other. The only exception is Civ V, which prefers AMD’s cores over Intel’s, and that is clearly reflected in our graphs.
In the shifting landscape of desktop processors, Intel’s 14th Generation Core processor family, or Raptor Lake Refresh, is a testament to the company’s optimizing and refining processes. Delving deep into its architectural choices, we’ve established many similarities with the previous 13th Gen Core series. The introduction of faster clock speeds, particularly evident when juxtaposing the Core i9-14900K with the Core i9-13900K, certainly paints a promising performance picture. But as with anything, specifications tell just half the story. Real-world application set the actual benchmark in relation to performance, especially considering the demanding nature of high-performance tasks and even gaming.
The balance of power, efficiency, and, ultimately, cooling becomes even more paramount, a notion evident in our experiences with the Core i9-13900KS, where thermal limits posed noticeable issues on sustaining performance. The same Gracemont-based E-cores, reused across three generations, certainly raise eyebrows, prompting us to ponder the age-old debate of innovation vs. consistency. While DDR5 memory’s advances over the past year are noted, significantly as the platform has matured and faster UDIMMs of up to DDR5-8000 are available at retail, actually attaining those kinds of speeds is down to luck of the draw with memory controller or IMC, as not all chips can support such speeds. Otherwise, the contrast of allowing users to use DDR4 memory still offers a layer of flexibility, albeit with its own sets of trade-offs.
Getting straight to the point, and potentially the most significant point that needs to be made, Intel’s 14th Gen Core and Intel’s 13th Gen Core are virtually identical in relation to P and E-core architecture and all the silicon underneath the IHS. Aside from the bump in the E-core count for the Core i7 series (i7-14700K/KF) chips, which brings four more E-cores than the Core i9-13700K (8P+12E vs. 8P+8E), we’re looking at the same core configurations as the previous generation chips, just running at slightly higher clockspeeds. Still, as Intel has bridged the gap closer between the Core i9 and Core i7 series with 14th Gen Core, it makes the Core i7-14700K ($409) a better proposition in terms of value when compared to the original 13th Gen Core i7-13700K.
One area where Intel is tooting the horn with 14th Gen, so to speak, is through overclocking. Intel is promising higher DDR5 memory speeds with capabilities of up to DDR5-8000, which is impressive. Along these lines, Intel is offering their new ‘Extreme Power Delivery Profile’ on capable LGA1700 motherboards, which increases the current through ICCMax that can be put through the CPU to 400 A from 307 A. Finally, overclockers also have access to the new AI Assist, which uses a consistently trained AI model run by Intel in-house, AI assist looks to intelligently go through system characteristics and telemetry to determine the best overclocking settings for a given system.
As part of Intel’s Extreme Tuning Utility (XTU) overclocking software, AI Assist is only currently supported on the Core i9-14900K and KF processors. However, there is a possibility that it will be made available for other K series CPUs from Intel’s 14th Gen Core series. While that still remains to be seen, this is a Core i9-only feature for now.
As part of our analysis, we will separate compute performance from gaming and focus on each area individually.
Intel 14th Gen Core Compute Performance: Much The Same as 13th Gen
Digesting the compute performance of Intel’s new 14th Generation Core processors, we can see striking similarities when comparing the 14th and 13th Gen Core i9s and the Core i5s. In some areas, the extra clock speeds available on the Core i9-14900K show some benefit, but generally speaking, it won’t make much difference in most areas.

The most significant win performance for the Core i9-14900K came in CineBench R23 MT, one of the most recognizable CPU benchmarks worldwide. While the Core i9-14900K sits 6% ahead in this benchmark, the Core i9-14900K and Core i9-13900K trade blows consistently throughout most of our testing. The big surprise is the Core i7-14700K, which, in the same CineBench R23 MT test, is around 10% behind the Core i9-13900K and benefits from the extra 4 x E-cores made available by Intel. The Core i5-14600K and Core i5-13600K are similar in specifications; they are practically the same chip, so they are so close together in performance.

Another area where the additional frequencies on the Core i9-14900K made a little difference was in our SVT AV1 encoding test at 4K, which sits around 4% ahead of the Core i9-13900K. In contrast, the Core i7-14700K once again showed enough about it to sit among the ‘big guns,’ with respectable performance in all areas. The Core i5-14600K and Core i5-13600K are within margins of each other and, depending on the benchmark, are so close together it would be hard to distinguish which is which.

While we typically saw better AI and inferencing performance from AMD’s Ryzen 7000 series processors, especially with the X3D variants in certain models benefiting from the 3D V-Cache, one area where Intel took the lead was in TensorFlow with the GoogLeNet model. Again, the Core i7-14700K performed well and was consistently behind both the Core i9 chips in performance, while the Core i5-14600K doesn’t represent an upgrade over the Core i5-13600K, so we would prefer users saved some money and opted for the 13th Gen variant.
In our compute section of the test suite, as we’ve stated, the newer Core i9-14900K with advertised 6 GHz core clock speeds doesn’t perform that much better than the Core i9-13900K in most situations. The other factor to consider is how similar the Core i5-14600K and Core i5-13600K perform, and if a blind test were performed, users wouldn’t notice the difference. The standout for us is the Core i7-14700K, which costs $409 and represents a better buy if users can handle the fact it’s not a flagship chip, but still, it’s not far away at all in overall performance from either of the Core i9 chips.
Compared to AMD’s Ryzen 7000 series processors, Intel with 14th Gen remains competitive, much like they did with 13th Gen. There’s the caveat of the Ryzen 7000X3D processors such as the Ryzen 7 7800X3D, which offers exceptional gaming performance where the L3 cache can be benefited from, while the Ryzen 9 7950X is still a relevant CPU, especially given its the flagship bearer for compute performance from team AMD. While we typically saw better AI and inference performance in our suite with AMD’s Ryzen 7000 chips, 14th/13th Gen and Ryzen 7000 are highly capable options if AI capability isn’t your thing.
Intel 14th Gen Gaming Performance: Just Slightly Faster 13th Gen
Now, as we’ve highlighted numerous times throughout this review, Intel’s 14th Gen Raptor Lake refresh is broadly similar to the previous 13th Gen Core series. Despite frequency bumps to maximum boost frequencies on the Core i9-14900K to 6.0 GHz, sustaining it with high temperature and power draw is an entirely different matter. That being said, we experienced very similar levels of performance between both the 14th and 13th Gen core series in our testing, which, in all fairness, was to be expected given they are the same chips with slightly faster frequencies.

Using Borderlands 3 at 360p as an example in a non-GPU-limited scenario, the Core i9-14900K, Core i7-14700K, Core i9-13900KS, and Core i9-13900K are all within seven FPS. Even the Core i5-14600K is only a few frames behind the more expensive chips, including the Ryzen 9 7950X, which does show that the Core i5-14600K represents solid value for money at $319. Even at lower resolutions, Borderlands 3 is making use of the 3D V-Cache on the Ryzen 7000X3D chips, which does put them ahead in this particular use case. Given the Core i5-14600K and Core i5-13600K are nearly identical, with the only difference being a 100 MHz bump to E-core boost frequencies, this doesn’t offer anything in relation to performance gains.

At 4K in Hitman 3 at high settings, there’s not much benefit to opting for Intel’s 14th Gen over the previous 13th Gen chips. It must be made clear that Intel’s 14th Gen Core series isn’t designed as a direct upgrade over 13th Gen, but more a more refined and higher binned Raptor Lake platform that offers more performance compared to older platforms such as 12th Gen and older, or even AMD’s Ryzen 5000 and 3000 series processors.
At the end of the day, users currently using Intel’s 13th Gen Core processors aren’t going to see any benefit, at least not in the real-world sense, by upgrading to Raptor Lake Refresh. While it’s good that Intel is constantly refining their processes and methods, gaming performance is more affected by graphics card capability than CPU. However, it’s still important to strike the right balance to help alleviate bottlenecks.
Intel 14th Gen Core: Our Core i9-14900K Pulled 428W, What the?!?!
One notable thing we need to sink our teeth into is the power consumption, or how much power draw these Intel 14th Gen core chips are pulling compared to their predecessors. While Intel does define formal TDPs, including PL1 and PL2 values, motherboard vendors such as MSI, as per our MEG Z790 Ace MAX, seem to throw all sense of limitations out of the window. In our power testing, the maximum power value we drew from the Core i9-14900K was a staggering 428 W; this is wild by any stretch of the imagination. In contrast, the Core i9-13900K on the same board during our re-testing pulled 343 W in the same tests, showing the disdain or lack of care motherboard vendors have for power efficiency; we can’t blame Intel for this.

With such a high power draw, for very few gains in performance, at least in our testing, doesn’t put motherboard vendors in a particularly favorable light. Although they are all consistently striving to be the leader in performance, there’s a limit, or there should be a limit to what motherboard vendors can do in relation to power. The simple fact is 428 W for a desktop processor when Intel’s defined PL1/PL2 values at spec is 253 W represents a 69% excess in power consumption, and that’s just from the CPU package. We strive to test CPUs out of the box with defaults for a chip and platform where applicable, and pulling 428 W at peak power, even if just a momentary spike, gives cause for concern.
Even the Core i7-14700K was notably high in peak power, just shy of 400 W itself, much higher than our Core i9-13900K pulled. Whether this is something to do with firmware infancy, which we’re not buying, as Raptor Lake has been around for a good while now, something does need to be said about this. We know that 6 GHz is an impressive feat and looks good when marketing such a high clock speed, but it shouldn’t come at the cost of power and heat, at least not to that degree.
When power draw isn’t erring on the side of insanity, things look good, and there is some efficiency to be had, especially in gaming when there are no AVX-512 or highly intensive instruction sets churning through the P and E-cores simultaneously. As mentioned in our power section, we have contacted MSI directly regarding the issue and await a reply. This is something we will investigate further.
Closing Thoughts: Core i7-14700K at $409 is The Star of 14th Gen Core
Regarding raw compute performance, out of the three Intel 14th Gen Core chips we’ve tested, the Core i9-14900K has the best performance, and as the platform’s flagship, it should. While we know Raptor Lake Refresh is just a refresh, albeit with 100-200 MHz bumps to turbo clock speeds, we feel users already on 13th Gen should stick with what they have. Intel hasn’t designed the 14th Gen around upgrading from the 13th Gen, and that’s no secret. Intel is, however, using the maturity of the Intel 7 node with ‘refinements’ so it can squeeze out more MHz from already high-clocked chips. Intel 14th Gen, in a nutshell, is just better binned 13th Gen, but with one exception: The Core i7-14700K.
From all of Intel’s 14th Gen Core series chips, the only chip to get an actual upgrade under the hood aside from frequency bumps is the Core i7-14700K, with 4 more E-cores than the Core i7-13700K, but for the same launch MSRP of $409. That’s a bigger step up than what the other 14th Gen Core chips are delivering, and we can only presume, is an insurance bet from Intel to keep AMD at bay.
If users are on an older Intel platform such as 9th, 10th, or even 11th Gen, there are plenty of performance benefits by opting for Intel’s 14th Gen Core. Unfortunately, the same could be said for upgrading to Intel’s original Raptor Lake-based 13th Gen. Not only are current 13th Gen retail prices cheaper than when launched last year, but with how little difference, at least in our testing, that the frequency bumps are making, users can opt for either 14th or 13th Gen and know that they are getting fast and high-performance processors.
Even with the Core i5-14600K priced at $319, there are no actual performance benefits compared to the previous generation Core i5-13600K; the only difference is a 100 MHz bump to E-core boost clock speeds. At the time of writing, the Core i5-13600K can be bought on Amazon for $285, a saving of $34, which is essentially the same processor; users could opt for that route and save a little bit of money.
The Intel 14th Gen Core series is somewhat of a somber swansong to the traditional and famed Core i series naming scheme, rounding off what feels like the end of an era. With the shift to their upcoming Meteor Lake SoC, the impending launch of the new naming scheme (Core and Core Ultra) branding, and what Intel hopes to be a groundbreaking mobile chiplet-based architecture.
The crux of the analysis is if you’re upgrading from an older and outdated desktop platform, the Intel 14th Gen series is a solid performer, but there’s still value in current 13th Gen pricing. Those must be considered in the current global financial situation; some users may find a better deal. If you already have 12th or 13th Gen Core parts, then there’s absolutely no reason to upgrade or consider 14th Gen as a platform, as none of the features (mainly software) justify a sidegrade on which is ultimately the same platform and the same core architecture.
