
The introduction of the Intel NUC in the early 2010s kickstarted the ultra-compact form-factor (UCFF) trend for desktop systems. Processors with TDPs ranging from 6 – 15W formed the backbone of this segment in the initial years. Intel and AMD have been officially allowing configurable TDPs for their notebook segment offerings for a few years now. This has prompted some vendors to introduce UCFF systems with regular 45W TDP processors (albeit, in cTDP-down mode).
GEEKOM, the private label brand of Shenzhen Jiteng Network Technology Co., has been on a roll lately with the introduction of multiple UCFF systems in the last year. The brand has become an avenue for the company to market excess inventory from their OEM / ODM production runs. As a result, we are seeing the introduction of fully configured systems based on older CPU generations, but at extremely attractive price points. The GEEKOM A5 is one such product.
The system is available in only one configuration – a Ryzen 7 5800H CPU along with a 512 GB SSD and 32 GB of RAM. The company sent that over to put through our evaluation routine for small form-factor computing systems. This review explores the performance profile and value proposition of the system, along with a discussion of factors that might tempt consumers to opt for it despite the use of a processor from early 2021.
Small form-factor (SFF) systems are replacing bulky desktops for many use-cases. The rapid growth in this segment has led to the rise of many Asian vendors focusing on these systems. GEEKOM is a private label brand of Shenzhen Jiteng Network Technology Co., Ltd. – an OEM / ODM for small form-factor computing systems. The company manufactures both Intel and AMD-based systems. The private label started off with a few entry-level systems (such as the MiniAir 11) , but has since branched out to introduce machines with leading-edge processors. We recently took a look at their Raptor Lake-H-based Mini IT13, but the focus today is on the GEEKOM A5. This system is equipped with a relatively old AMD Cezanne SoC from early 2021.
The Ryzen 7 5800H in the GEEKOM A5 has eight cores and sixteen threads, with a Radeon RX Vega 8 integrated GPU. It is fabricated in TSMC’s 7nm processor. At the time of its introduction in the 2021 CES, the SoC was slotted right in the middle in AMD’s Ryzen 5000 Mobile H-series lineup.
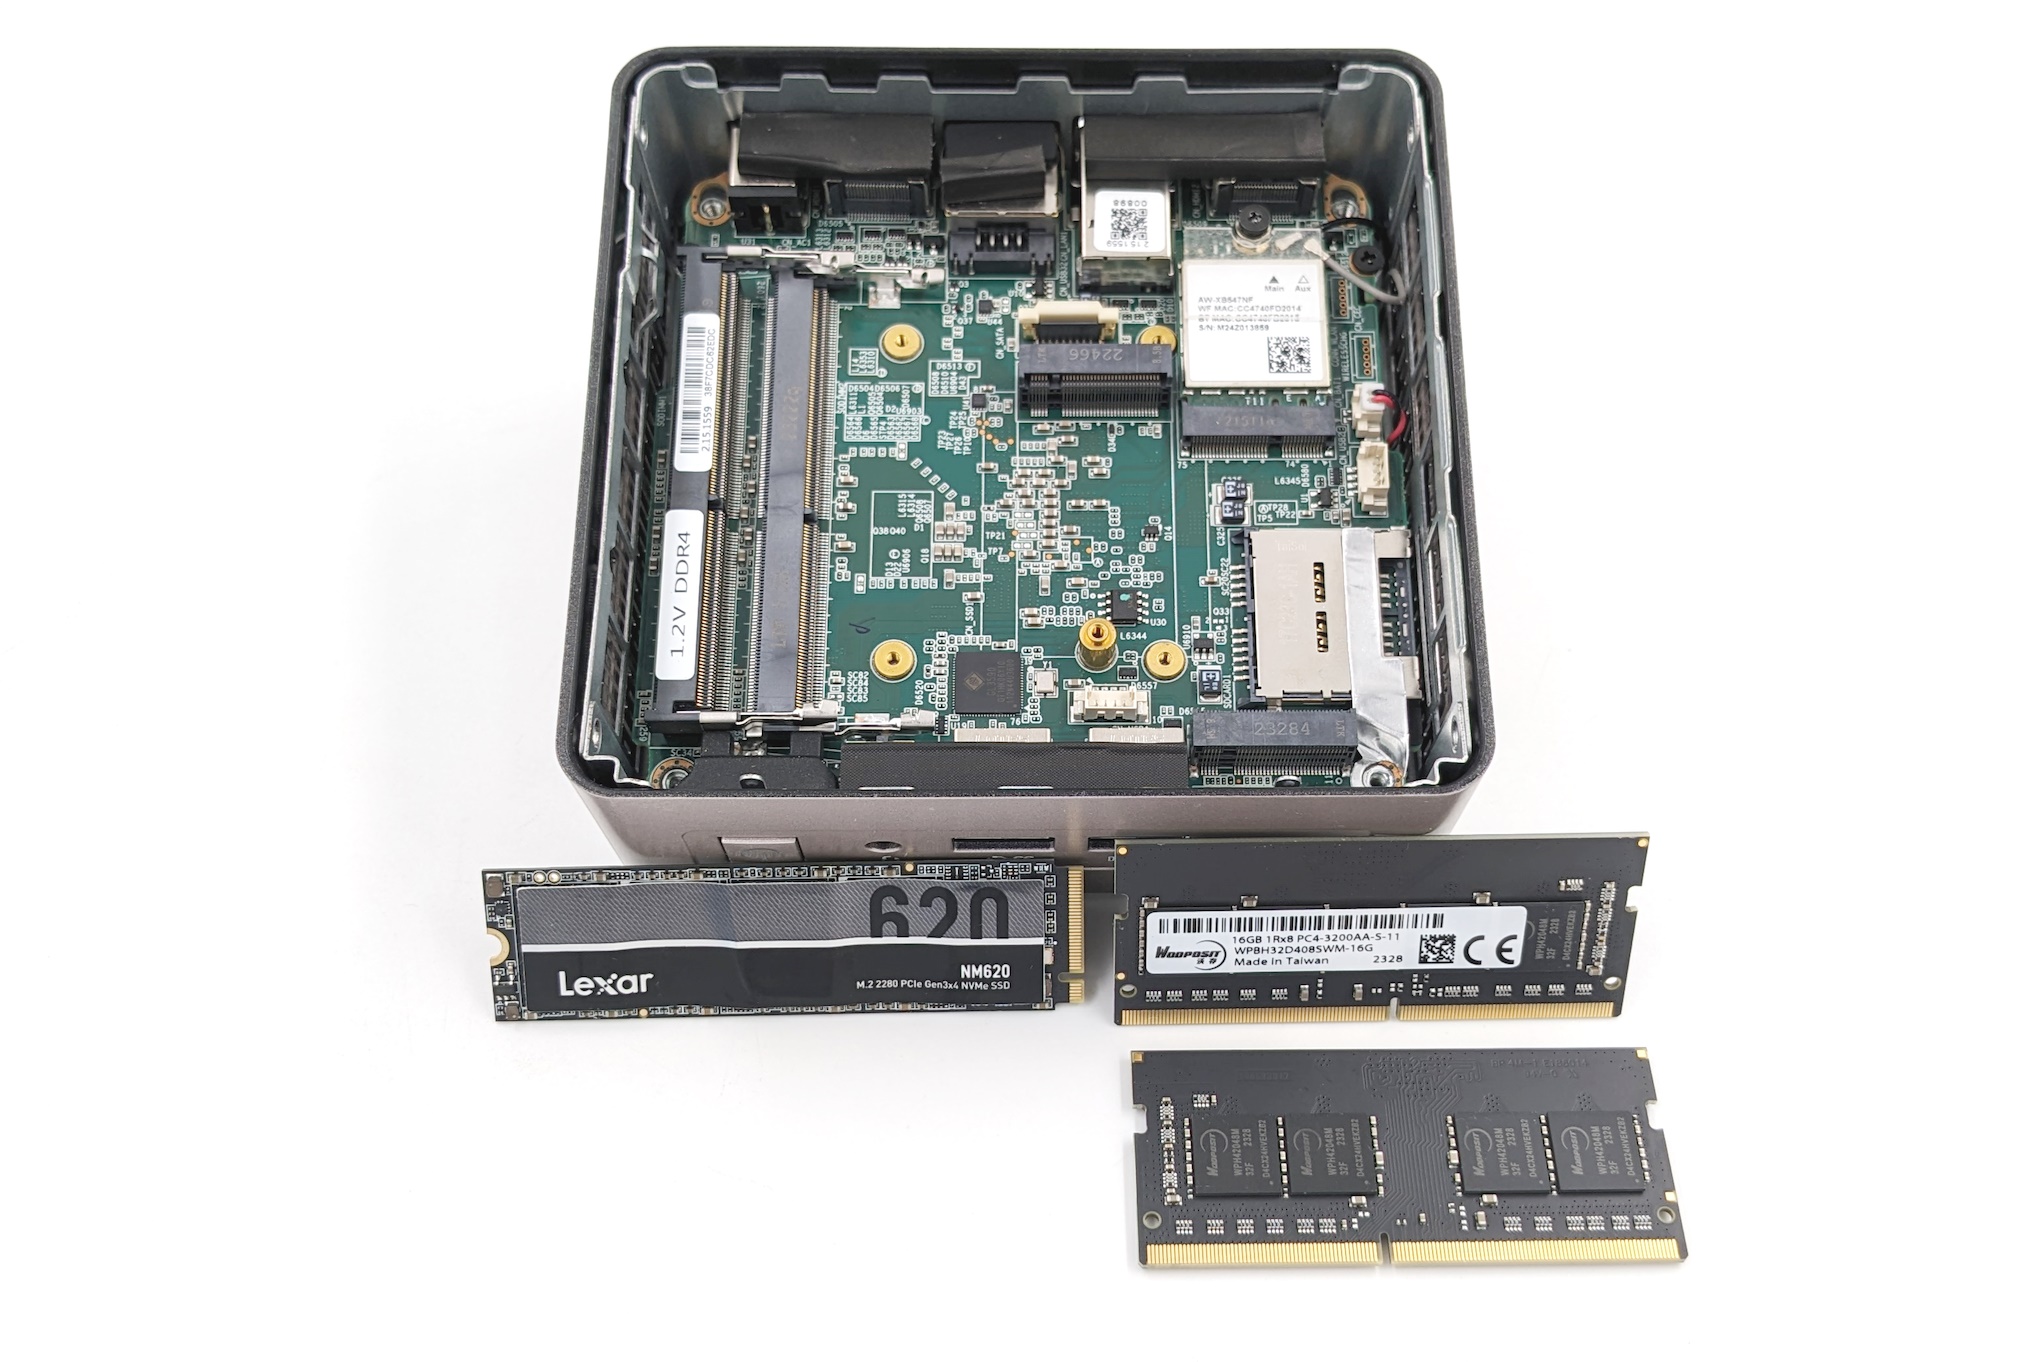
In order to make up for the use of an old processor, GEEKOM is being very liberal with DRAM capacity (32 GB of DDR4-3200) and has also used a relatively high-performance DRAMless Gen 3 SSD (512GB of SK hynix 176L 3D TLC behind a Maxio SSD controller in the Lexar NM620). The entire package is being marketed with a sub-$400 price point – essentially less than half of what such an UCFF system would have cost, had it been purchased in 2021.
GEEKOM’s package for the A5 is spartan – the main unit is accompanied by a welcome card, VESA mount with associated screws, an installation guide, HDMI cable, and a 120W (19V @ 6.32A) AC adapter with a geo-specific power cord.
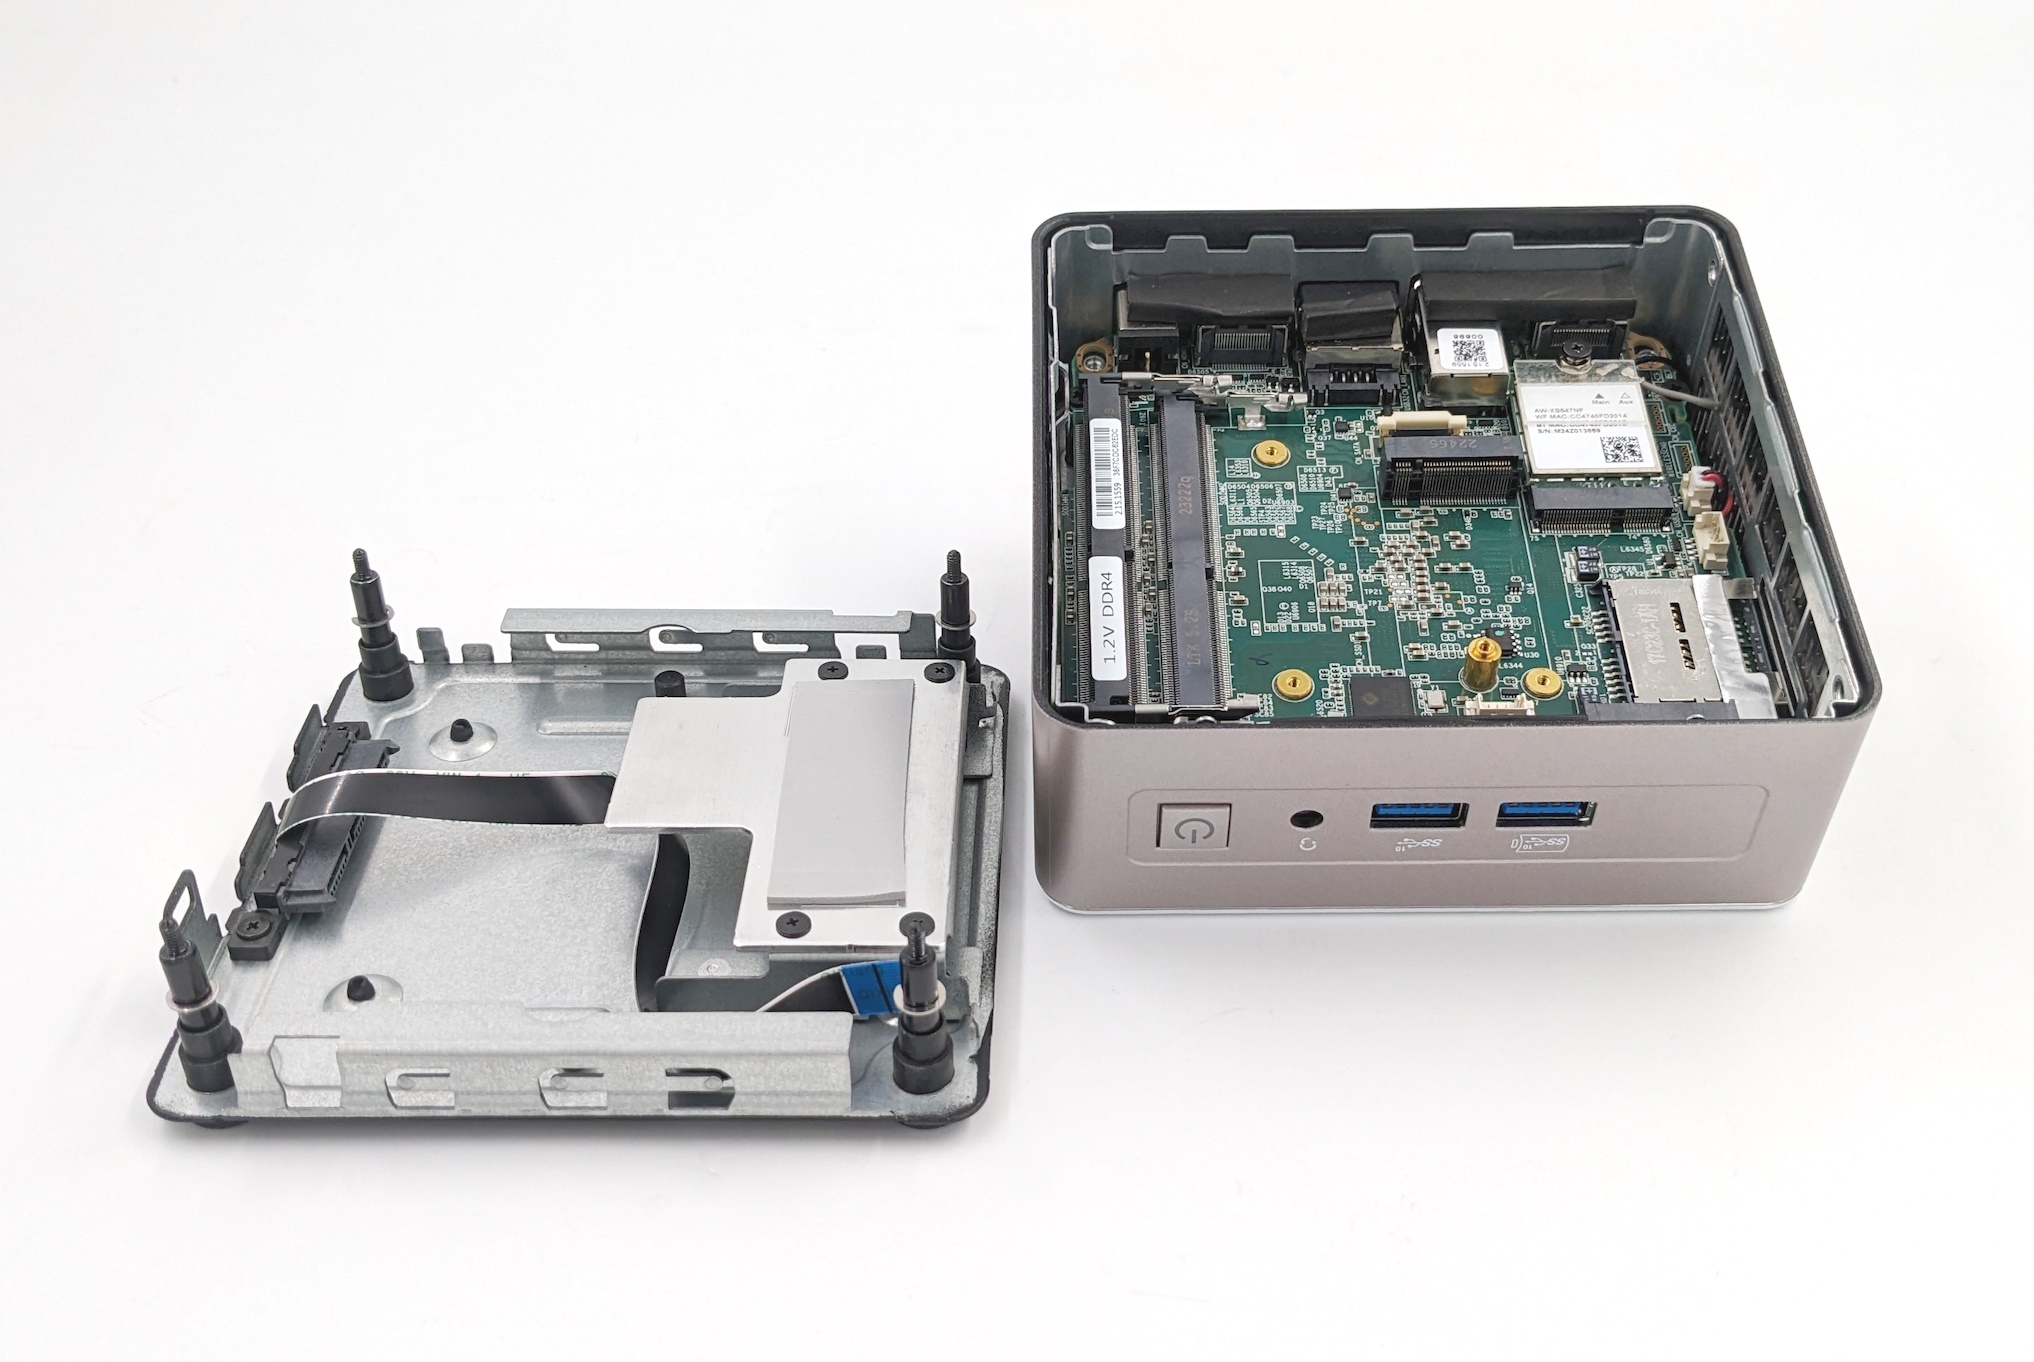
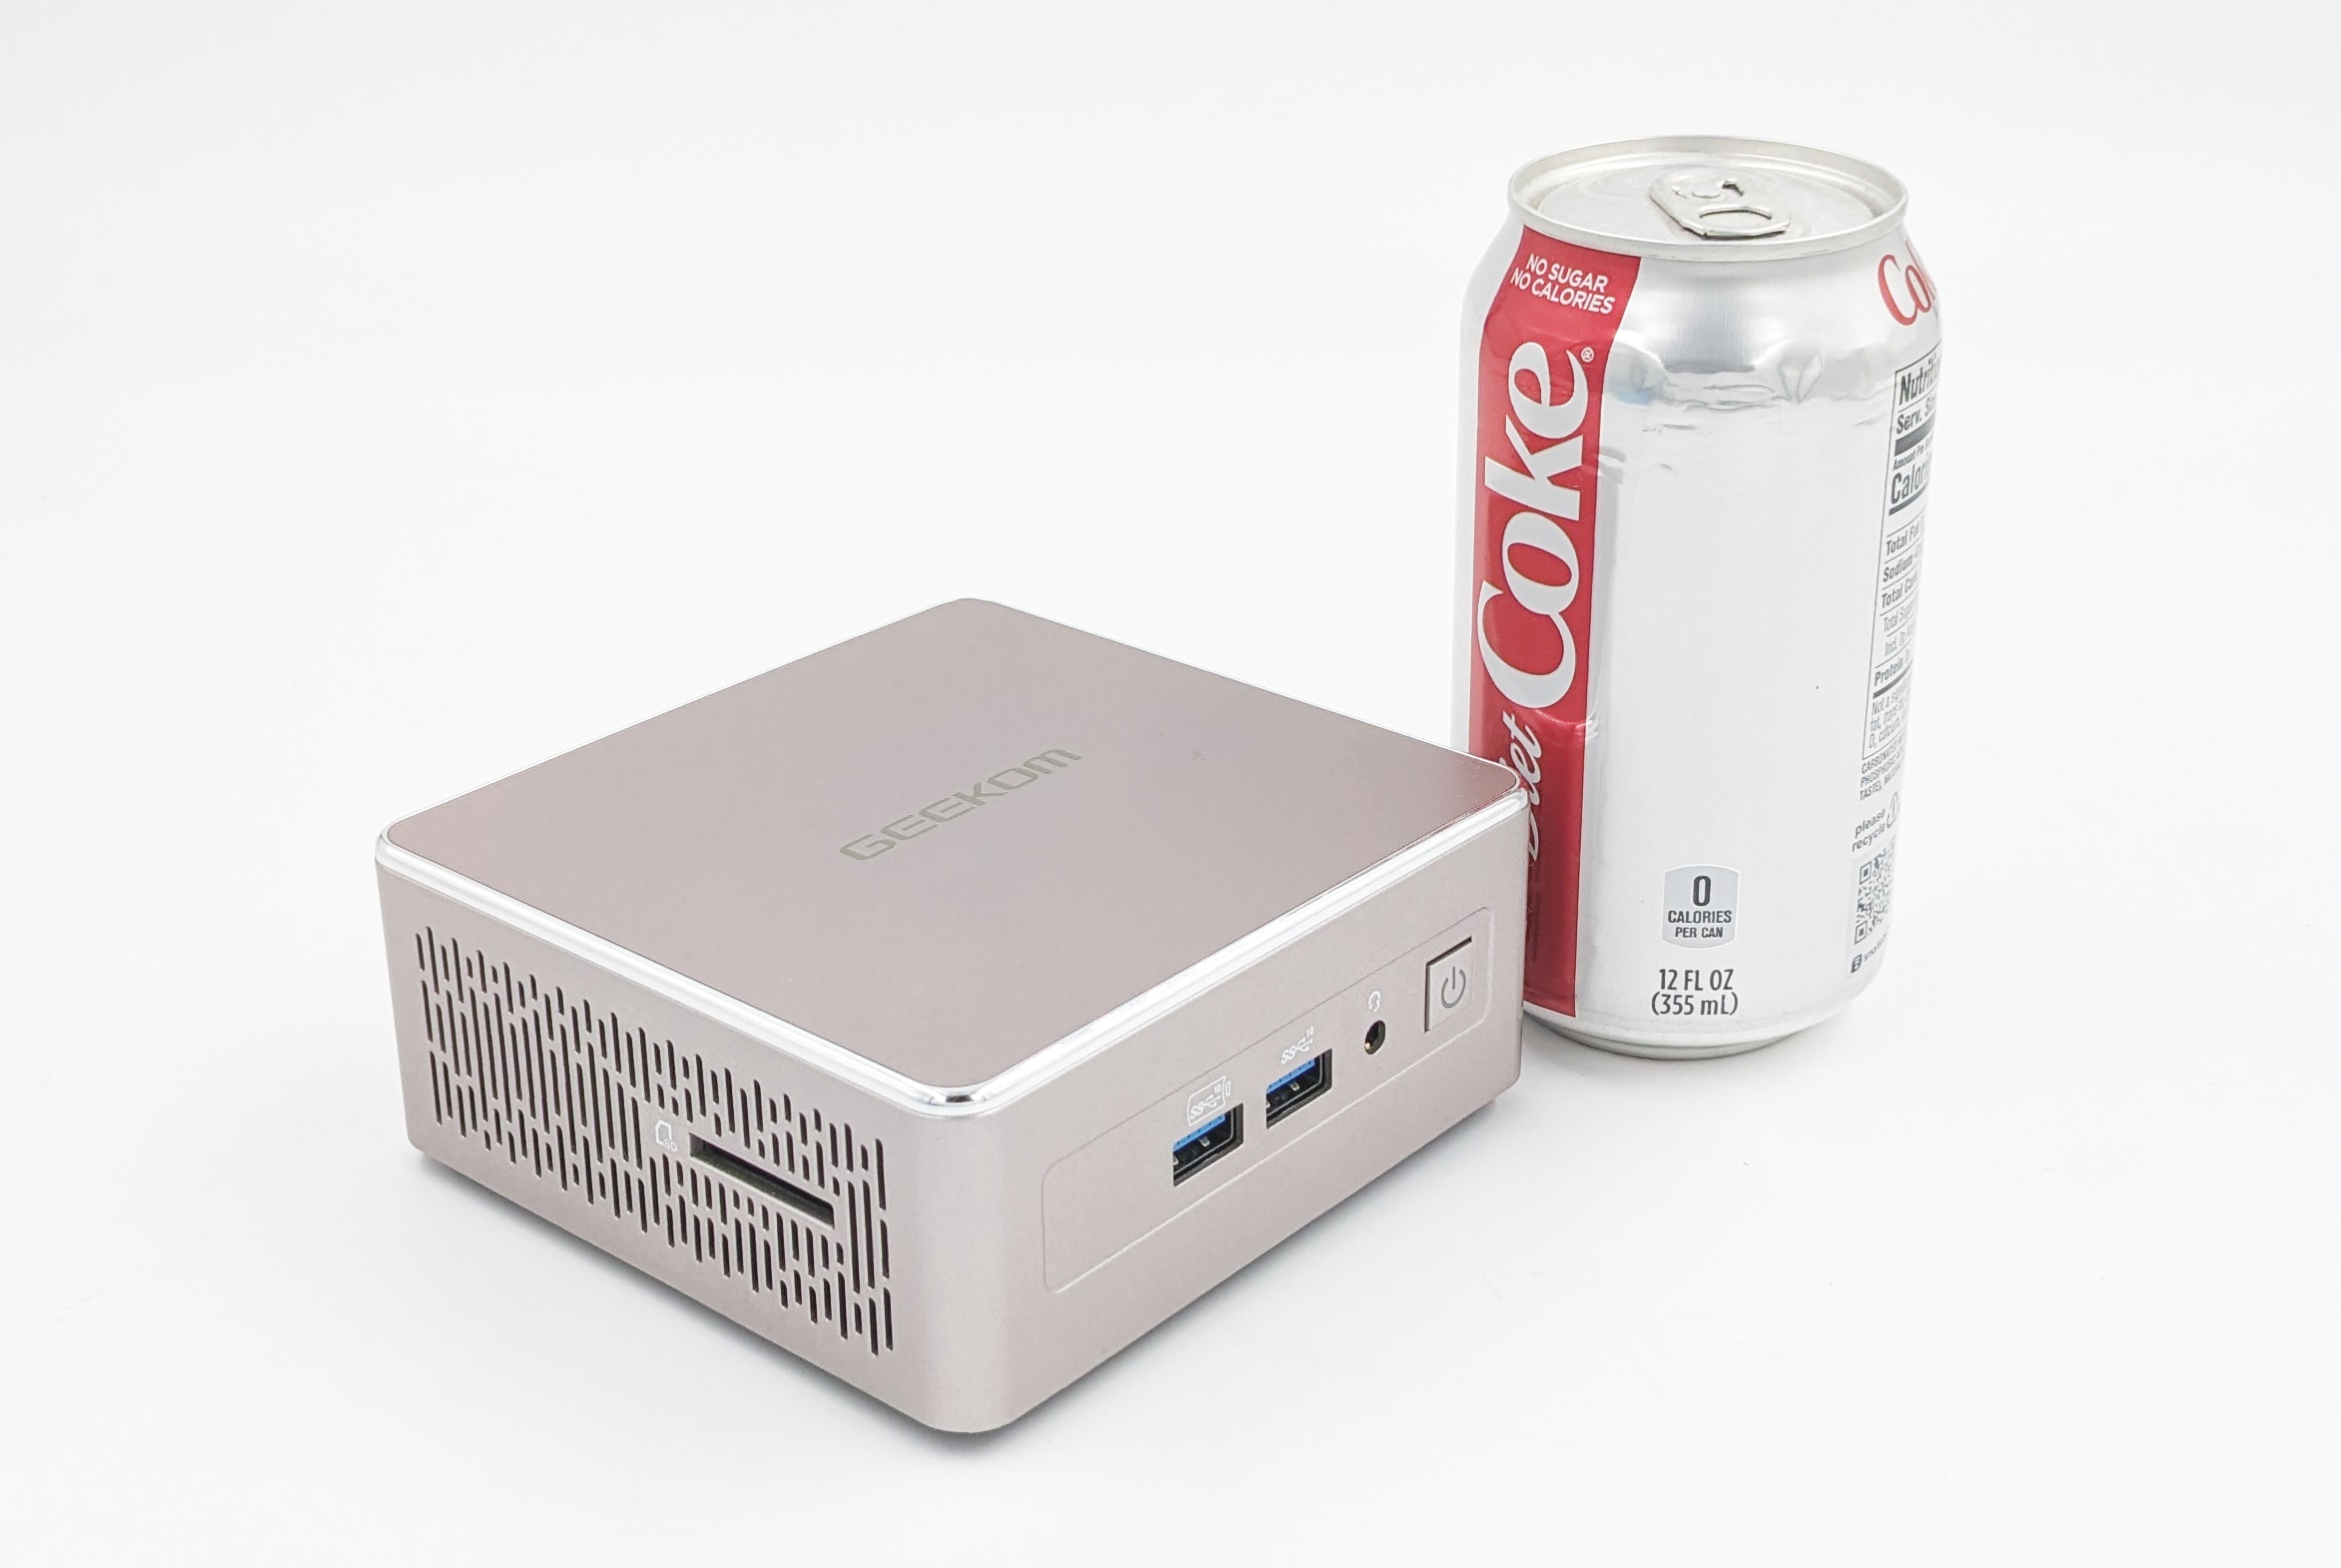
The main unit clocks in at 117mm x 112mm x 49.2mm. The system is sized to accept a 2.5″ drive. The case design is essentially the same as the Mini IT13. The form-factor is meant to deliver functionality similar to the full-height mainstream NUCs. The larger dimensions allow for a wider variety of ports in the systems compared to regular UCFF systems that forego the 2.5″ drive support.
GEEKOM does not sell barebones versions of the A5. A SSD, DRAM, and a pre-installed copy of Windows 11 Pro are also provided.
Unlike the other AMD-based GEEKOM system we had reviewed before, the board and chassis design are fairly straightforward and similar to the NUCs.
The DDR4 SODIMM slots and the Gen3 x4 M.2 SSD slots on the motherboard are pre-populated in the GEEKOM configuration. The WLAN / BT module is under the NVMe SSD slot (similar to the mainstream NUCs). There is a metal frame that is built around the 2.5″ drive slot, and a thermal pad is affixed to it to provide heat transfer support from the M.2 2280 NVMe SSD. Our review configuration was equipped with 2x Shenzhen Wodposit Tech. WPBH32D408SWM-16G DDR4-3200 SODIMMs and a Lexar NM620 (2023 model) Gen3 x4 M.2 2280 NVMe SSD. Windows 11 Professional came pre-installed.
The full specifications of the review sample (as tested) are summarized in the table below. The Ryzen 7 5800H has a TDP of 45W, and a minimum power (cTDP-down) of 35W. As we shall see in our BIOS options analysis and detailed investigation into the thermal characteristics in a later section, the form-factor of the system and the notebook-style thermal solution restricts the operation of the processor to a 35W cTDP mode.
| GEEKOM A5 Specifications (as tested) |
|
| Processor | AMD Ryzen 7 5800H Zen 3 (Cezanne) 8C/16T, 3.2 – 4.4 GHz TSMC 7nm, 16MB L3, 45W Max / Target TDP : 45W / 35W |
| Memory | Shenzhen Wodposit Tech. WPBH32D408SWM-16G DDR4-3200 SODIMM 22-22-22-52 @ 3200 MHz 2×16 GB |
| Graphics | AMD Radeon Graphics (Renoir) – Integrated (RX Vega 8) (8 CUs @ 2.4 GHz) |
| Disk Drive(s) | Lexar NM620 (512 GB; M.2 2280 PCIe 3.0 x4 NVMe;) (SK hynix 176L 3D TLC; Maxio MAP1202A-F1C Controller) |
| Networking | 1x 2.5 GbE RJ-45 (Realtek RTL8125) Realtek 8852BE Wi-Fi 6 (2×2 802.11ax – 1.8 Gbps) / Bluetooth 5.2 |
| Audio | Realtek ALC269 (3.5mm Audio Jack in Front) Digital Audio with bitstreaming support over HDMI and Type-C |
| Video | 2x HDMI 2.0 (4Kp60) 2x Display Port 1.4 over USB4 Type-C (8Kp30) |
| Miscellaneous I/O Ports | 2x USB 3.2 Gen 2 Type-A (Front) 2x USB 3.2 Gen 2 Type-C w/ DP-Alt Mode (Rear) 1x USB 3.2 Gen 1 Type-A (Rear) 1x USB 2.0 Type-A (Rear) 1x SDXC UHS-II Slot (Side) |
| Operating System | Windows 11 Enterprise (22621.2506) |
| Pricing | (Street Pricing on Dec 7th, 2023) US $399 (as configured, with OS) (USD 359 with $40 off coupon code anandtecha540) |
| Full Specifications | GEEKOM A5 Specifications |
The next section details the the various BIOS options and follows it up with a detailed platform analysis.
Our review sample of the GEEKOM A5 came with all necessary components pre-installed – including the OS. Prior to setting up the OS on first boot, we took some time to look into the BIOS interface. Unlike the GUI-based UEFI interface offered by tier-one vendors, the BIOS here is a vanilla one with keyboard-only navigation. There are plenty of configurable options, and the video below presents an overview of the features.
The GEEKOM A5 is one of the first UCFF systems to expose overclocking features in the BIOS, albeit behind a bunch of warning screens. The thermal solution is limited by the form-factor. This makes the BIOS feature more of a novelty rather than something really useful. A lot of the other options seem to be OEM control knobs that have been inadvertently left enabled in the shipping BIOS.
One of the drawbacks of using a 2021 processor is the absence of support for the latest high-speed I/Os such as USB4. However, that has not prevented GEEKOM from packing the A5 with relatively high-end connectivity features for a sub-$400 system. The PCIe lane allocations from the Cezanne SoC are detailed below.
- PCIe 3.0 x1 port #2: In Use @ x1 (O2Micro Integrated MMC/SD Controller)
- PCIe 3.0 x1 port #4: In Use @ x1 (Realtek RTL8125 Gaming 2.5GbE Family Ethernet Controller)
- PCIe 3.0 x1 port #5: In Use @ x1 (Realtek RTL8852BE Wireless LAN WiFi 6 PCIe Network Adapter)
- PCIe 3.0 x4 port #1: In Use @ x4 (Maxio MAP1202 NVMe SSD Controller)
The set of USB ports and internal SATA ports are all direct from the Cezanne SoC.
In today’s review, we compare the GEEKOM A5 and a host of other systems based on processors with TDPs ranging from 28W to 65W. The systems do not target the same market segments, but a few key aspects lie in common, making the comparisons relevant.
| Comparative PC Configurations | ||
| Aspect | GEEKOM A5 | |
| CPU | AMD Ryzen 7 5800H Zen 3 (Cezanne) 8C/16T, 3.2 – 4.4 GHz TSMC 7nm, 16MB L3, 45W Max / Target TDP : 45W / 35W |
AMD Ryzen 7 5800H Zen 3 (Cezanne) 8C/16T, 3.2 – 4.4 GHz TSMC 7nm, 16MB L3, 45W Max / Target TDP : 45W / 35W |
| GPU | AMD Radeon Graphics (Renoir) – Integrated (RX Vega 8) (8 CUs @ 2.4 GHz) |
AMD Radeon Graphics (Renoir) – Integrated (RX Vega 8) (8 CUs @ 2.4 GHz) |
| RAM | Shenzhen Wodposit Tech. WPBH32D408SWM-16G DDR4-3200 SODIMM 22-22-22-52 @ 3200 MHz 2×16 GB |
Shenzhen Wodposit Tech. WPBH32D408SWM-16G DDR4-3200 SODIMM 22-22-22-52 @ 3200 MHz 2×16 GB |
| Storage | Lexar NM620 (512 GB; M.2 2280 PCIe 3.0 x4 NVMe;) (SK hynix 176L 3D TLC; Maxio MAP1202A-F1C Controller) |
Lexar NM620 (512 GB; M.2 2280 PCIe 3.0 x4 NVMe;) (SK hynix 176L 3D TLC; Maxio MAP1202A-F1C Controller) |
| Wi-Fi | 1x 2.5 GbE RJ-45 (Realtek RTL8125) Realtek 8852BE Wi-Fi 6 (2×2 802.11ax – 1.8 Gbps) / Bluetooth 5.2 |
1x 2.5 GbE RJ-45 (Realtek RTL8125) Realtek 8852BE Wi-Fi 6 (2×2 802.11ax – 1.8 Gbps) / Bluetooth 5.2 |
| Price (in USD, when built) | (Street Pricing on Dec 7th, 2023) US $399 (as configured, with OS) |
(Street Pricing on Dec 7th, 2023) US $399 (as configured, with OS) |
The next few sections will deal with comparative benchmarks for the above systems.
Our 2022 Q4 update to the test suite for Windows 11-based systems carries over some of the standard benchmarks we have been using over the last several years. While UL’s PCMark makes the list, we have opted to temporarily suspend reporting of BAPCo’s SYSmark scores (pending fixture of the energy consumption aspect). Instead, BAPCO’s CrossMark multi-platform benchmarking tool has been added to the set along with UL’s Procyon suite. While CrossMark employs idle time compression and processes all workloads in an opaque manner, UL’s Procyon processes real-world workloads with user interactions (like BAPCo’s SYSmark). We have augmented the UL Procyon suite benchmark with our own custom energy measurement setup.
UL PCMark 10
UL’s PCMark 10 evaluates computing systems for various usage scenarios (generic / essential tasks such as web browsing and starting up applications, productivity tasks such as editing spreadsheets and documents, gaming, and digital content creation). We benchmarked select PCs with the PCMark 10 Extended profile and recorded the scores for various scenarios. These scores are heavily influenced by the CPU and GPU in the system, though the RAM and storage device also play a part. The power plan was set to Balanced for all the PCs while processing the PCMark 10 benchmark. The scores for each contributing component / use-case environment are also graphed below.
| UL PCMark 10 – Performance Scores | |||
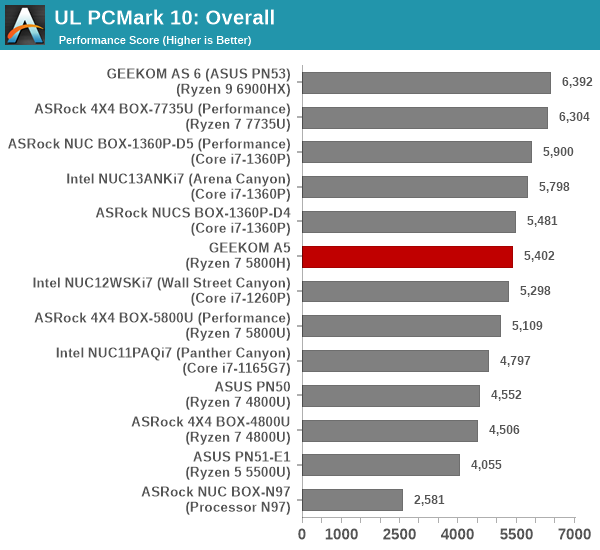
The GEEKOM A5 slots in the middle for most of the workloads, as expected. Systems based on the newer processors from both AMD and Intel deliver better performance, but the key here is the comparison between the ADL-N system and the A5. The NUC BOX-N97 has a similar form-factor and I/O list, and is priced approximately the same after taking components cost into consideration. The performance delivered by the A5 is more than double that of the NUC BOX-N97 for the usual consumer workloads tested in PCMark 10.
UL Procyon v2.1.544
PCMark 10 utilizes open-source software such as Libre Office and GIMP to evaluate system performance. However, many of their professional benchmark customers have been requesting evaluation with commonly-used commercial software such as Microsoft Office and Adobe applications. In order to serve their needs, UL introduced the Procyon benchmark in late 2020. There are five benchmark categories currently – Office Productivity, AI Inference, Battery Life, Photo Editing, and Video Editing. AI Inference benchmarks are available only for Android devices, while the battery life benchmark is applicable to Windows devices such as notebooks and tablets. We presents results from our processing of the other three benchmarks.
| UL Procyon – Office Productivity Scores | |||
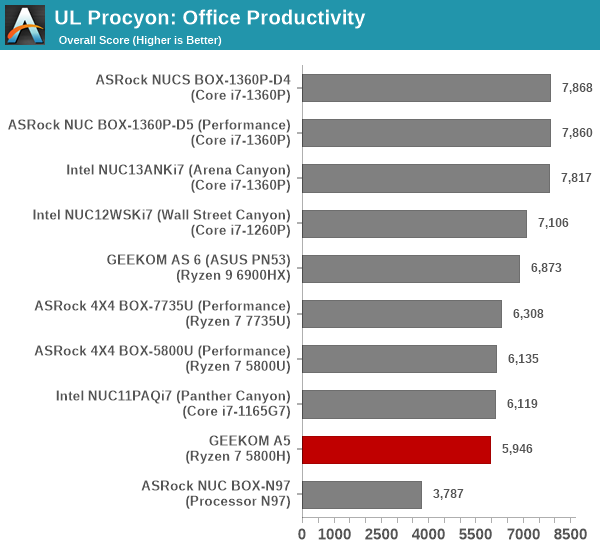
The A5 performs similar to the other Cezanne systems in the Office workloads, but it is towards the end of the pack, as some of the older systems against which the A5 performed well in PCMark 10 were not subject to the UL Procyon workloads.
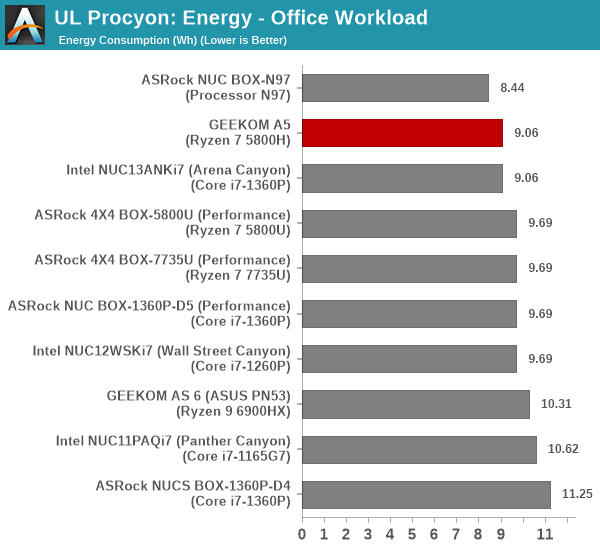
From an energy consumption viewpoint, the A5 is similar to the Intel NUC (Arena Canyon). Though the jobs take a longer time to finish in the A5, the system is quite power efficient. Only the NUC BOX-N97 (with a much lower performance) is more energy efficient compared to the A5.
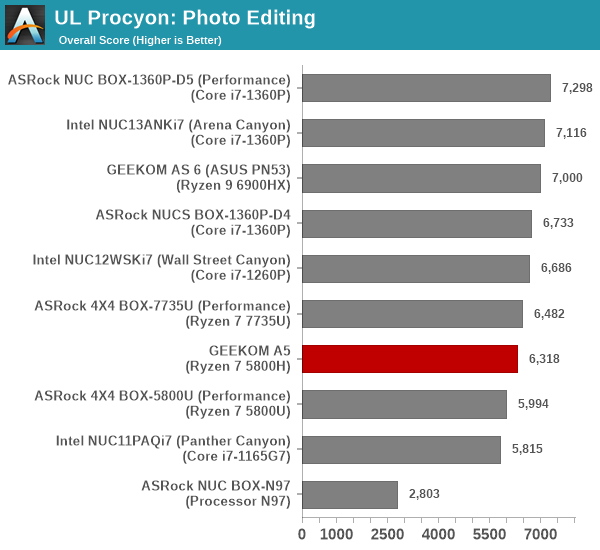
Moving on to the evaluation of Adobe Photoshop and Adobe Lightroom, we find that the GPU is utilized more heavily compared to the office workloads. This allows the A5 to move up a notch, but it still remains in the bottom half of the pack.
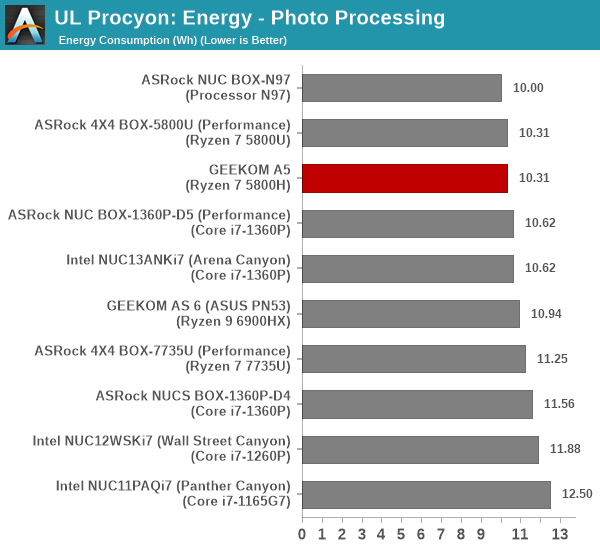
Fortunately, the power efficiency allows it to be among the most energy efficient systems for the photo processing workload.
UL Procyon evaluates performance for video editing using Adobe Premier Pro.
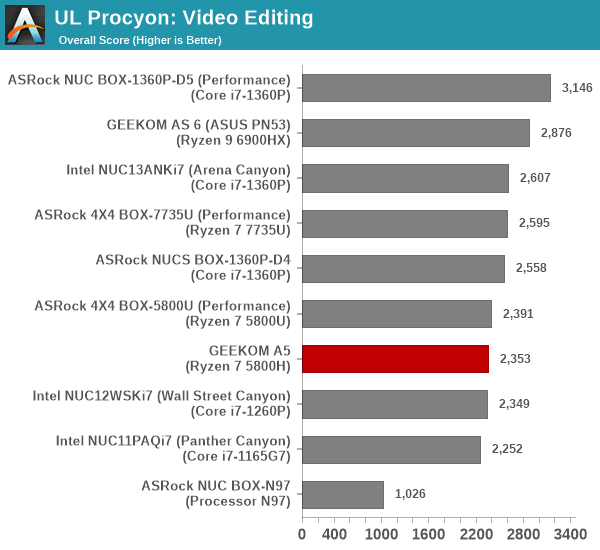
The video editing scores depend on the GPU capabilities and the available power budget. It is no surprise that the newer generation processors with iGPU improvements have a lead over the A5.
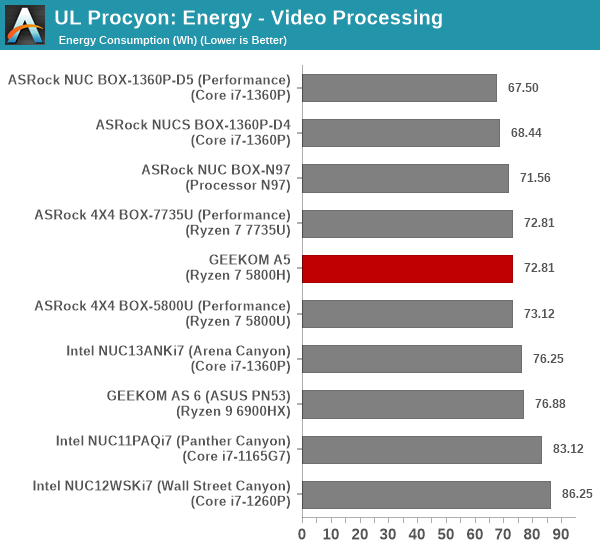
Stressing the iGPU weans away a bit of the power efficiency for the task, but the A5 still delivers slight benefits over the Cezanne systems evaluated back in 2021.
BAPCo CrossMark 1.0.1.86
BAPCo’s CrossMark aims to simplify benchmark processing while still delivering scores that roughly tally with SYSmark. The main advantage is the cross-platform nature of the tool – allowing it to be run on smartphones and tablets as well.
| BAPCo CrossMark 1.0.1.86 – Sub-Category Scores | |||
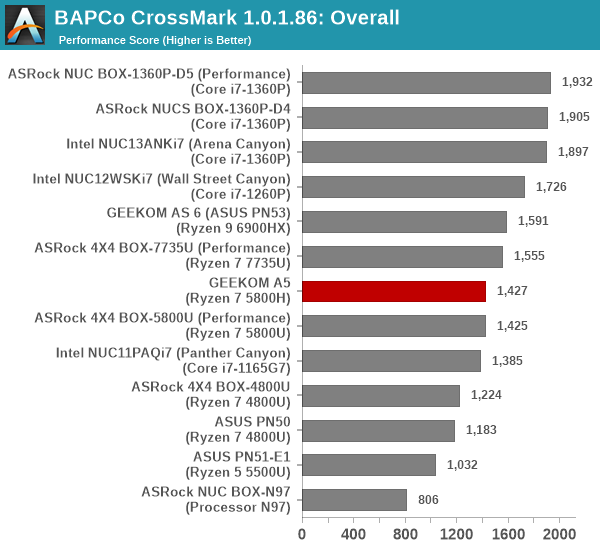
The A5 loses out a bit on the responsiveness front, as most of the other systems are equipped with Gen4 SSDs. As we shall see later, the A5’s Ryzen SoC is configured for a 60W / 42W / 35W operation mode (similar to the PL1 / PL2 of the Intel systems). Since CrossMark workloads involve idle time compression, the short bursts of higher power help the A5 move towards the middle of the pack in the productivity and creativity workloads.
SFF PCs traditionally do not lend themselves to workstation duties. However, a recent trend towards miniaturized workstations has been observed. While systems in the GEEKOM A5’s form-factor are still not capable enough to become workstations, the rapid performance improvements over the years has encouraged us to benchmark some of these UCFF / SFF systems for content creation workloads and professional applications. Towards this, we processed the SPECworkstation 3.1 benchmark from SPEC.
The SPECworkstation 3.1 benchmark measures workstation performance based on a number of professional applications. It includes more than 140 tests based on 30 different workloads that exercise the CPU, graphics, I/O and memory hierarchy. These workloads fall into different categories.
- Media and Entertainment (3D animation, rendering)
- Product Development (CAD/CAM/CAE)
- Life Sciences (medical, molecular)
- Financial Services
- Energy (oil and gas)
- General Operations
- GPU Compute
Individual scores are generated for each test and a composite score for each category is calculated based on a reference machine (HP Z240 tower workstation using an Intel E3-1240 v5 CPU, an AMD Radeon Pro WX3100 GPU, 16GB of DDR4-2133, and a SanDisk 512GB SSD). Official benchmark results generated automatically by the benchmark itself are linked in the table below for the systems being compared.
| SPECworkstation 3.1 Official Results (2K) | |
| GEEKOM A5 | Run Summary |
| ASRock 4X4 BOX-5800U (Performance) | Run Summary |
| Intel NUC11PAQi7 (Panther Canyon) | Run Summary |
| ASRock NUC BOX-1360P-D5 (Performance) | Run Summary |
| ASRock 4X4 BOX-7735U (Performance) | Run Summary |
| ASUS PN50 | Run Summary |
| Intel NUC13ANKi7 (Arena Canyon) | Run Summary |
| ASRock NUCS BOX-1360P-D4 | Run Summary |
| ASRock NUC BOX-N97 | Run Summary |
| ASRock 4X4 BOX-4800U | Run Summary |
| ASUS PN51-E1 | Run Summary |
| Intel NUC12WSKi7 (Wall Street Canyon) | Run Summary |
| GEEKOM AS 6 (ASUS PN53) | Run Summary |
Details of the tests in each category, as well as an overall comparison of the systems on a per-category basis are presented below.
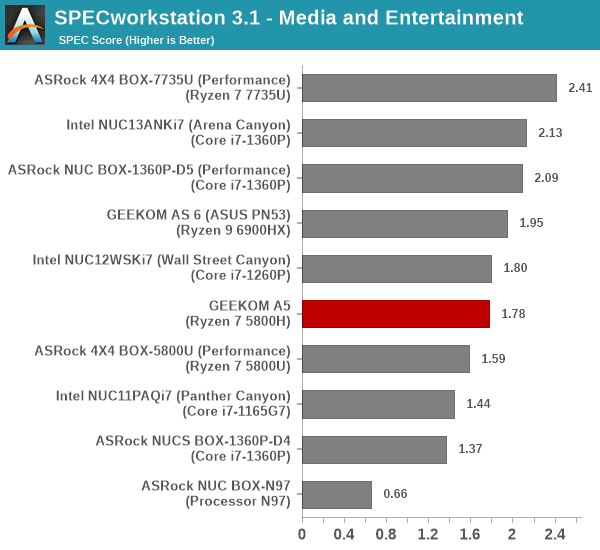
Media and Entertainment
The Media and Entertainment category comprises of workloads from five distinct applications:
- The Blender workload measures system performance for content creation using the open-source Blender application. Tests include rendering of scenes of varying complexity using the OpenGL and ray-tracing renderers.
- The Handbrake workload uses the open-source Handbrake application to transcode a 4K H.264 file into a H.265 file at 4K and 2K resolutions using the CPU capabilities alone.
- The LuxRender workload benchmarks the LuxCore physically based renderer using LuxMark.
- The Maya workload uses the SPECviewperf 13 maya-05 viewset to replay traces generated using the Autodesk Maya 2017 application for 3D animation.
- The 3ds Max workload uses the SPECviewperf 13 3dsmax-06 viewset to replay traces generated by Autodesk’s 3ds Max 2016 using the default Nitrous DX11 driver. The workload represents system usage for 3D modeling tasks.
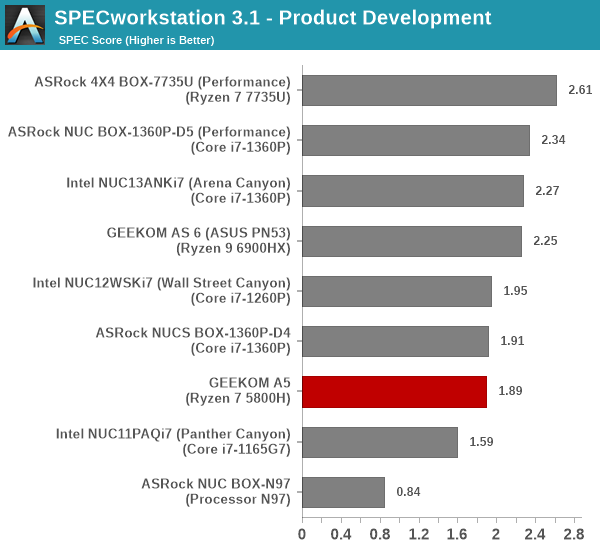
Product Development
The Product Development category comprises of eight distinct workloads:
- The Rodinia (CFD) workload benchmarks a computational fluid dynamics (CFD) algorithm.
- The WPCcfd workload benchmarks another CFD algorithm involving combustion and turbulence modeling.
- The CalculiX workload uses the Calculix finite-element analysis program to model a jet engine turbine’s internal temperature.
- The Catia workload uses the catia-05 viewset from SPECviewperf 13 to replay traces generated by Dassault Systemes’ CATIA V6 R2012 3D CAD application.
- The Creo workload uses the creo-02 viewset from SPECviewperf 13 to replay traces generated by PTC’s Creo, a 3D CAD application.
- The NX workload uses the snx-03 viewset from SPECviewperf 13 to replay traces generated by the Siemens PLM NX 8.0 CAD/CAM/CAE application.
- The Solidworks workload uses the sw-04 viewset from SPECviewperf 13 to replay traces generated by Dassault Systemes’ SolidWorks 2013 SP1 CAD/CAE application.
- The Showcase workload uses the showcase-02 viewset from SPECviewperf 13 to replay traces from Autodesk’s Showcase 2013 3D visualization and presentation application
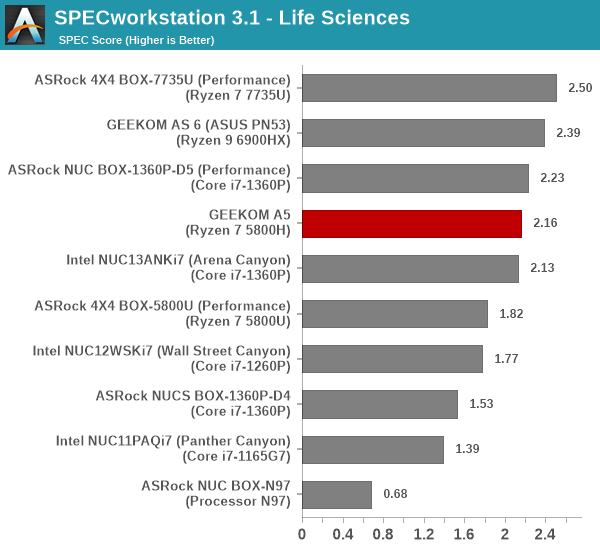
Life Sciences
The Life Sciences category comprises of four distinct test sets:
- The LAMMPS set comprises of five tests simulating different molecular properties using the LAMMPS molecular dynamics simulator.
- The NAMD set comprises of three tests simulating different molecular interactions.
- The Rodinia (Life Sciences) set comprises of four tests – the Heartwall medical imaging algorithm, the Lavamd algorithm for calculation of particle potential and relocation in a 3D space due to mutual forces, the Hotspot algorithm to estimate processor temperature with thermal simulations, and the SRAD anisotropic diffusion algorithm for denoising.
- The Medical workload uses the medical-02 viewset from SPECviewperf 13 to determine system performance for the Tuvok rendering core in the ImageVis3D volume visualization program.
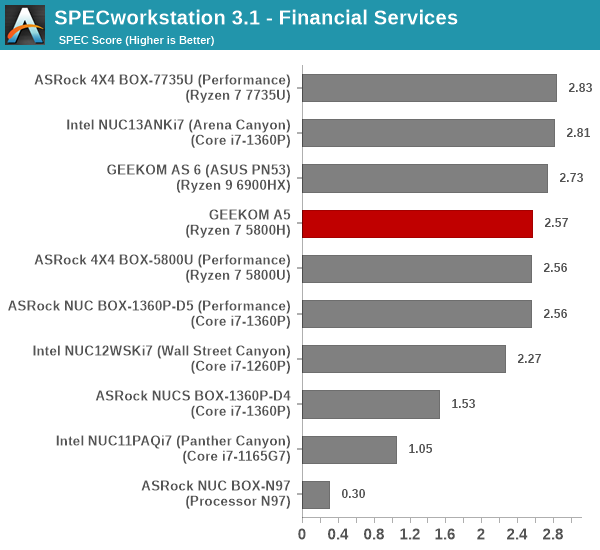
Financial Services
The Financial Services workload set benchmarks the system for three popular algorithms used in the financial services industry – the Monte Carlo probability simulation for risk assessment and forecast modeling, the Black-Scholes pricing model, and the Binomial Options pricing model.
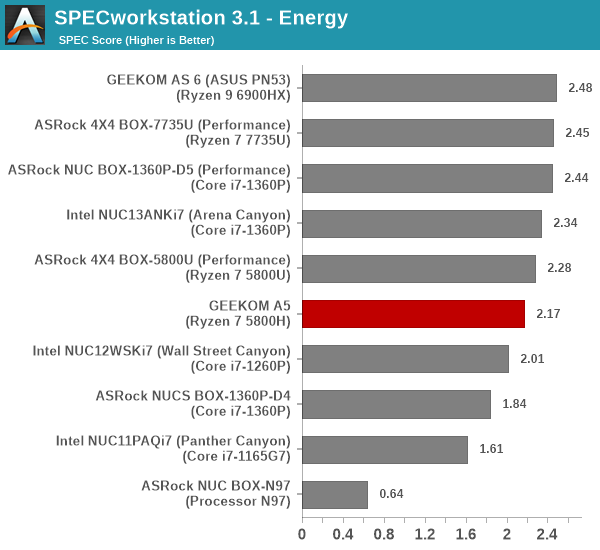
Energy
The Energy category comprises of workloads simulating various algorithms used in the oil and gas industry:
- The FFTW workload computes discrete Fourier transforms of large matrices.
- The Convolution workload computes the convolution of a random 100×100 filter on a 400 megapixel image.
- The SRMP workload processes the Surface-Related Multiples Prediction algorithm used in seismic data processing.
- The Kirchhoff Migration workload processes an algorithm to calculate the back propogation of a seismic wavefield.
- The Poisson workload takes advantage of the OpenMP multi-processing framework to solve the Poisson’s equation.
- The Energy workload uses the energy-02 viewset from SPECviewperf 13 to determine system performance for the open-source OPendTec seismic visualization application.
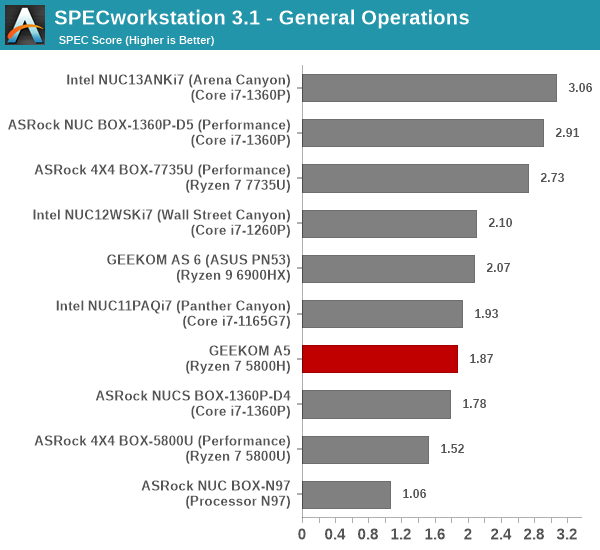
General Operations
In the General Options category, the focus is on workloads from widely used applications in the workstation market:
- The 7zip workload represents compression and decompression operations using the open-source 7zip file archiver program.
- The Python workload benchmarks math operations using the numpy and scipy libraries along with other Python features.
- The Octave workload performs math operations using the Octave programming language used in scientific computing.
- The Storage workload evaluates the performance of the underlying storage device using transaction traces from multiple workstation applications.
GPU Compute
In the GPU Compute category, the focus is on workloads taking advantage of the GPU compute capabilities using either OpenCL or CUDA, as applicable:
- The LuxRender benchmark is the same as the one seen in the media and entertainment category.
- The Caffe benchmark measures the performance of the Caffe deep-learning framework.
- The Folding@Home benchmark measures the performance of the system for distributed computing workloads focused on tasks such as protein folding and drug design.
We only process the OpenCL variants of the benchmark, as the CUDA version doesn’t process correctly with default driver installs.
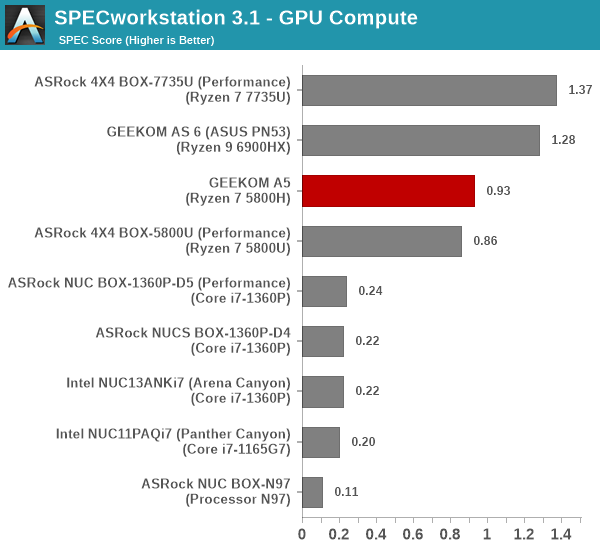
Workloads processed on workstations are long-running tasks that don’t benefit in any meaningful way from short bursts of higher power. UCFF systems find it difficult to sustain these higher package power numbers for a long enough time to influence the performance in workstation benchmarks. As a result, the relative performance of the GEEKOM A5 in SPECviewperf v3.1 is dictated by its sustained package power limit of 35W. In all the workloads, the system tends to appear in the middle of the pack, closely tracking the other Cezanne-based system in the comparison list.
Standardized benchmarks such as UL’s PCMark 10 and BAPCo’s SYSmark take a holistic view of the system and process a wide range of workloads to arrive at a single score. Some systems are required to excel at specific tasks – so it is often helpful to see how a computer performs in specific scenarios such as rendering, transcoding, JavaScript execution (web browsing), etc. This section presents focused benchmark numbers for specific application scenarios.
3D Rendering – CINEBENCH R23
We use CINEBENCH R23 for 3D rendering evaluation. R23 provides two benchmark modes – single threaded and multi-threaded. Evaluation of different PC configurations in both supported modes provided us the following results.
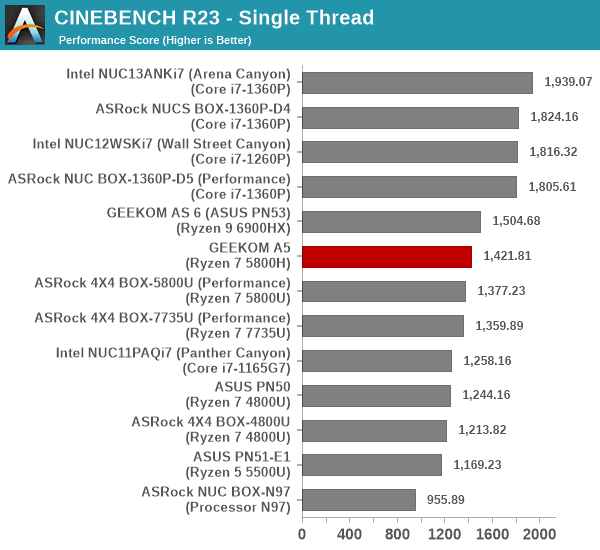
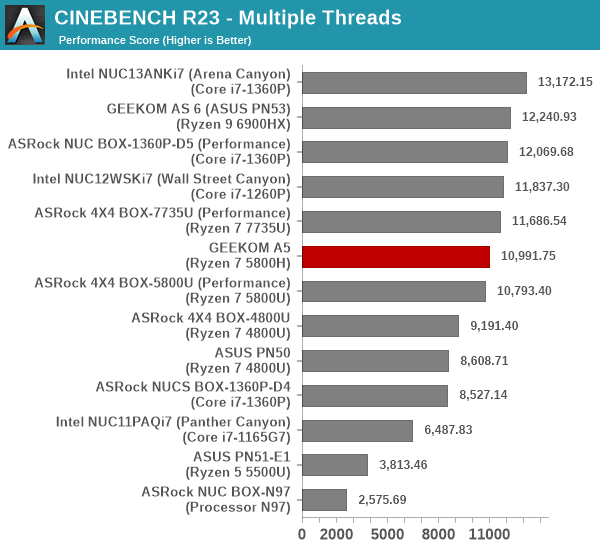
The GEEKOM A5 performs similar to the other Cezanne system in the list, and there are no other surprises. The combination of a 35W cTDP and the processor generation mean that the system slots right in the middle in both operating modes.
Transcoding: Handbrake 1.5.1
Handbrake is one of the most user-friendly open source transcoding front-ends in the market. It allows users to opt for either software-based higher quality processing or hardware-based fast processing in their transcoding jobs. Our new test suite uses the ‘Tears of Steel’ 4K AVC video as input and transcodes it with a quality setting of 19 to create a 720p AVC stream and a 1080p HEVC stream.
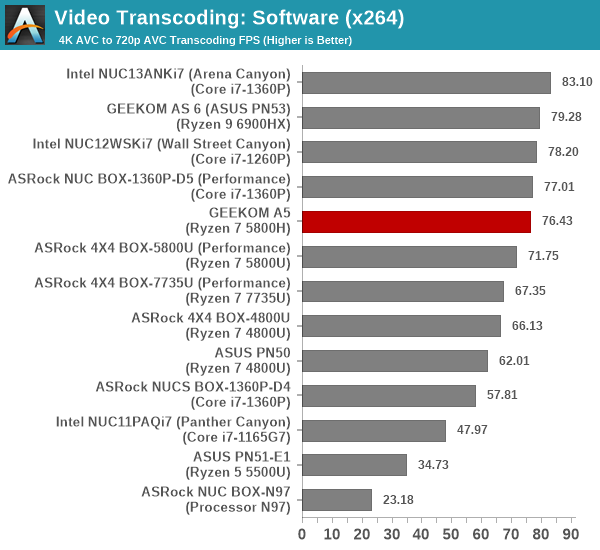
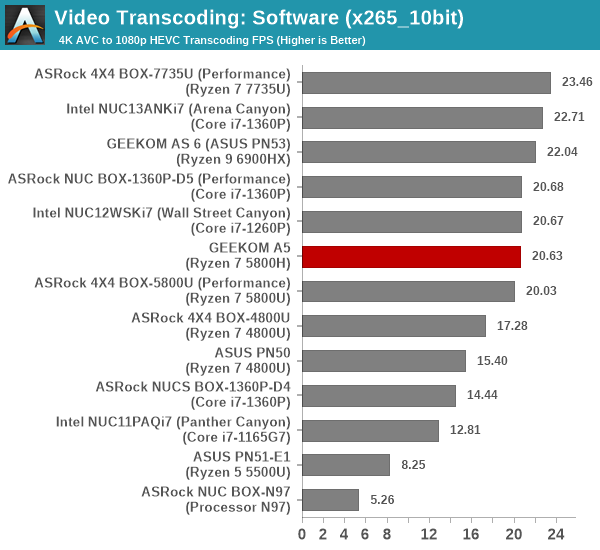
Software transcoding performance depends on the number of available threads and the available power budget, even when the comparison is across different processor generations. Similar to the 3D rendering workload, the A5 makes its mark in the middle of the pack.
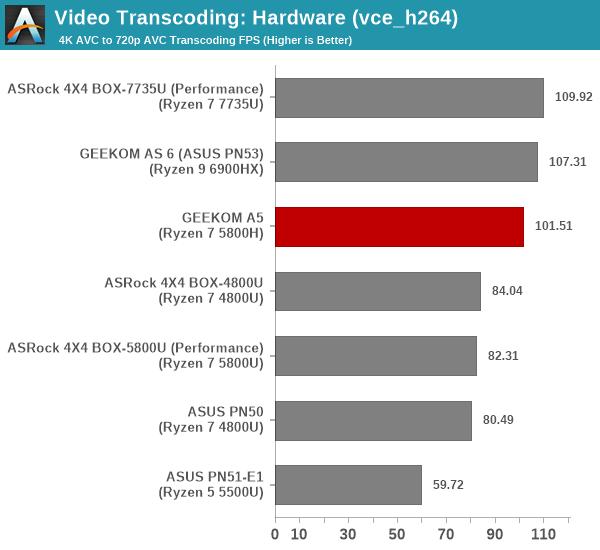
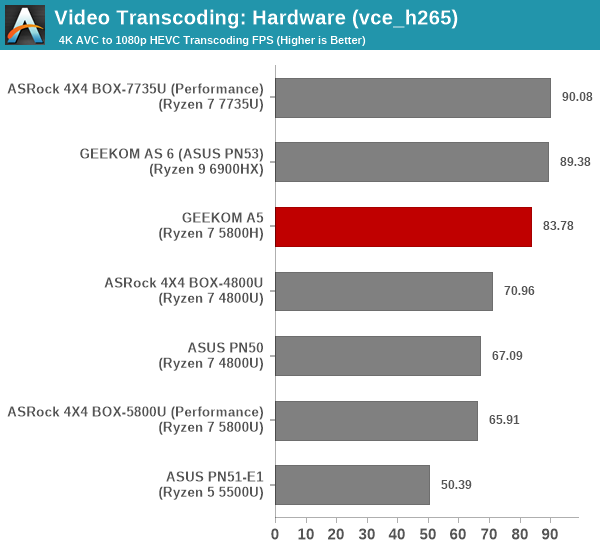
Hardware transcoding performance using VCE depends on the iGPU clock rates, which in turn depends on the available power budget for long-term tasks. The A5 has a slight edge in the power budget over the other Cezanne system, and that shows up as a significant delta in the FPS numbers for VCE processing. Other than that, it is easy to note that the numbers improve with newer iGPU generations.
Archiving: 7-Zip 21.7
The 7-Zip benchmark is carried over from our previous test suite with an update to the latest version of the open source compression / decompression software.
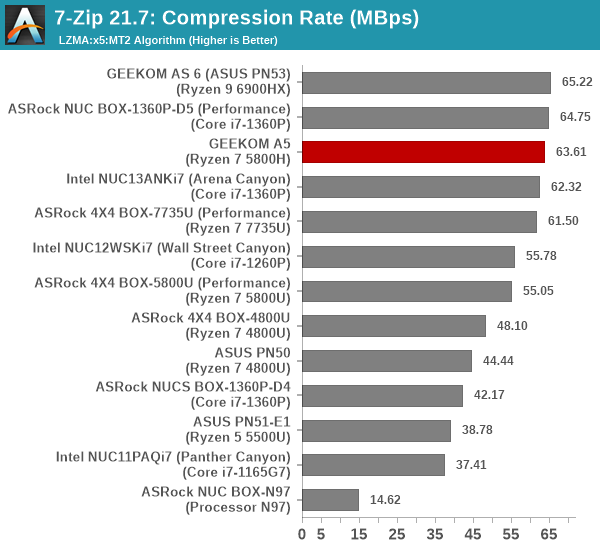
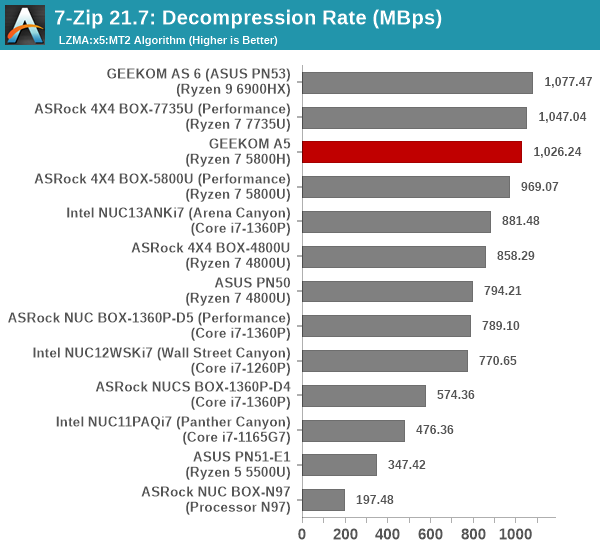
The Cezanne SoC packs 8 high-performance Zen 3 cores, and has an edge over Intel-based processors for multi-threaded workloads like compression and decompression. That is reflected in the scores above, with the A5 being bettered only by systems sporting SoCs with Zen 3+ cores.
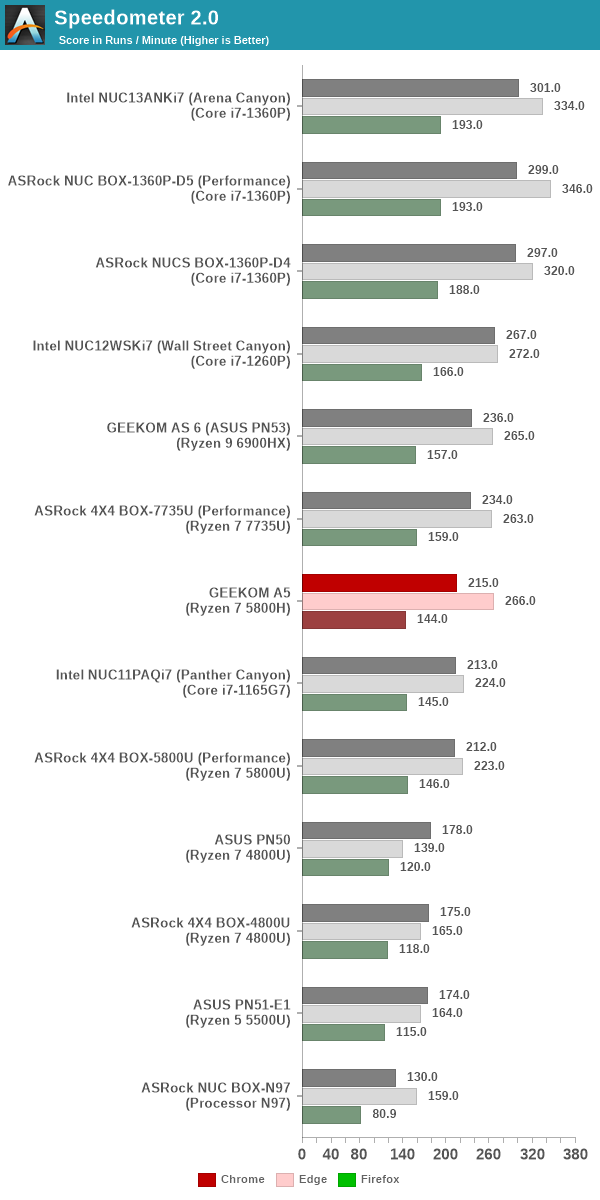
Web Browsing: JetStream, Speedometer, and Principled Technologies WebXPRT4
Web browser-based workloads have emerged as a major component of the typical home and business PC usage scenarios. For headless systems, many applications based on JavaScript are becoming relevant too. In order to evaluate systems for their JavaScript execution efficiency, we are carrying over the browser-focused benchmarks from the WebKit developers used in our notebook reviews. Hosted at BrowserBench, JetStream 2.0 benchmarks JavaScript and WebAssembly performance, while Speedometer measures web application responsiveness.
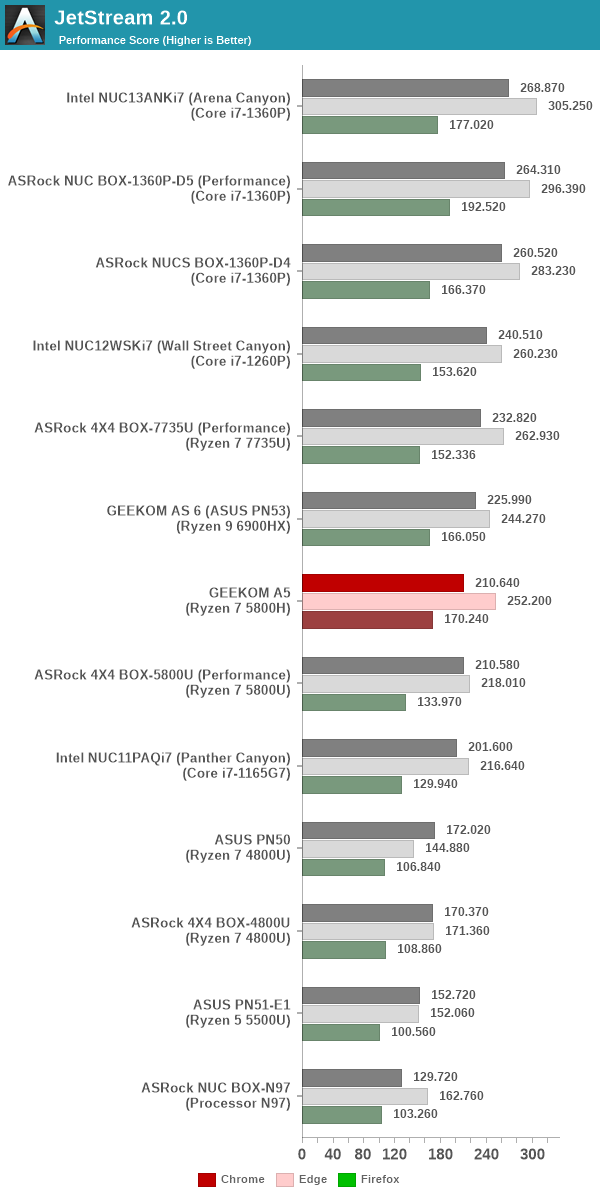
From a real-life workload perspective, we also process WebXPRT4 from Principled Technologies. WebXPRT4 benchmarks the performance of some popular JavaScript libraries that are widely used in websites.
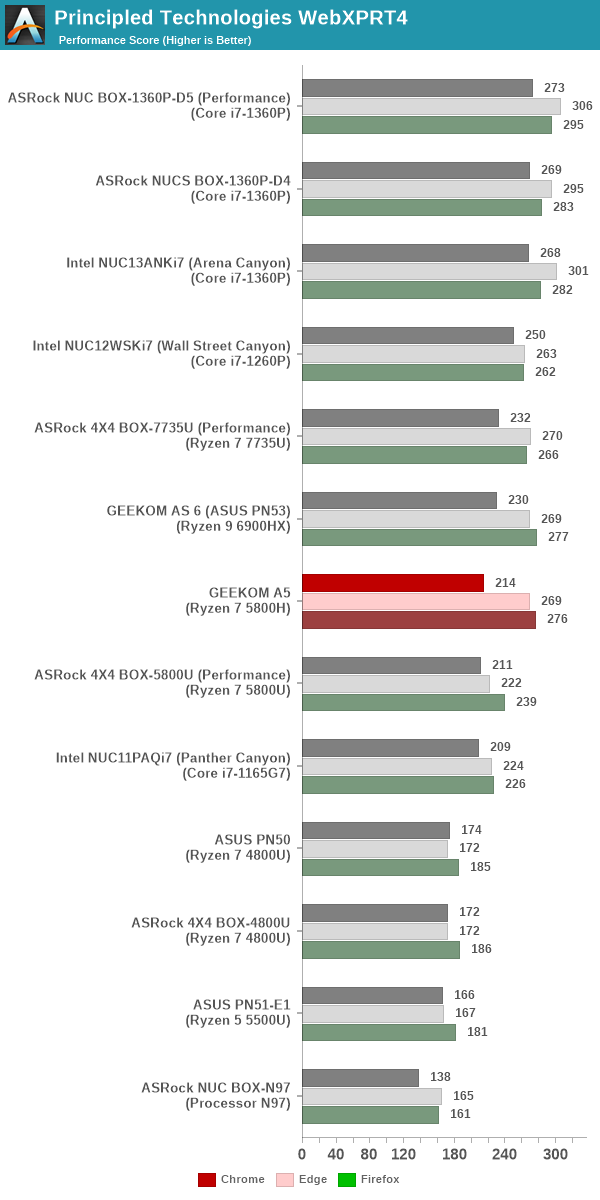
All the web browsing benchmarks see the A5 land in the middle of the pack around the same spot as the other Cezanne system in the list. These tests bring out the single-threaded performance capability, and the Intel-based systems have a slight edge in each generation. Short bursts of high clock speeds help a bit, particular for the real-world simulating WebXPRT4 benchmark.
Application Startup: GIMP 2.10.30
A new addition to our systems test suite is AppTimer – a benchmark that loads up a program and determines how long it takes for it to accept user inputs. We use GIMP 2.10.30 with a 50MB multi-layered xcf file as input. What we test here is the first run as well as the cached run – normally on the first time a user loads the GIMP package from a fresh install, the system has to configure a few dozen files that remain optimized on subsequent opening. For our test we delete those configured optimized files in order to force a ???fresh load??? every second time the software is run.
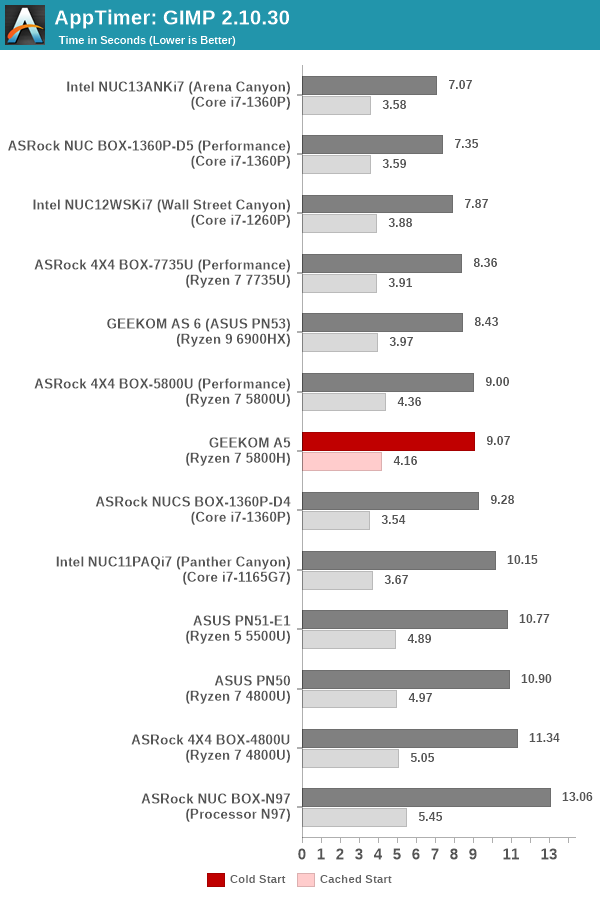
As it turns out, GIMP does optimizations for every CPU thread in the system, which requires that higher thread-count processors take a lot longer to run. So the test runs quick on systems with fewer threads, however fast cores are also needed. The performance is essentially equivalent to the ASRock Industrial’s Cezanne system we evaluated back in 2021.
Cryptography Benchmarks
Cryptography has become an indispensable part of our interaction with computing systems. Almost all modern systems have some sort of hardware-acceleration for making cryptographic operations faster and more power efficient. In the case of IoT servers, many applications – including web server functionality and VPN – need cryptography acceleration.
BitLocker is a Windows features that encrypts entire disk volumes. While drives that offer encryption capabilities are dealt with using that feature, most legacy systems and external drives have to use the host system implementation. Windows has no direct benchmark for BitLocker. However, we cooked up a BitLocker operation sequence to determine the adeptness of the system at handling BitLocker operations. We start off with a 4.5GB RAM drive in which a 4GB VHD (virtual hard disk) is created. This VHD is then mounted, and BitLocker is enabled on the volume. Once the BitLocker encryption process gets done, BitLocker is disabled. This triggers a decryption process. The times taken to complete the encryption and decryption are recorded. This process is repeated 25 times, and the average of the last 20 iterations is graphed below.
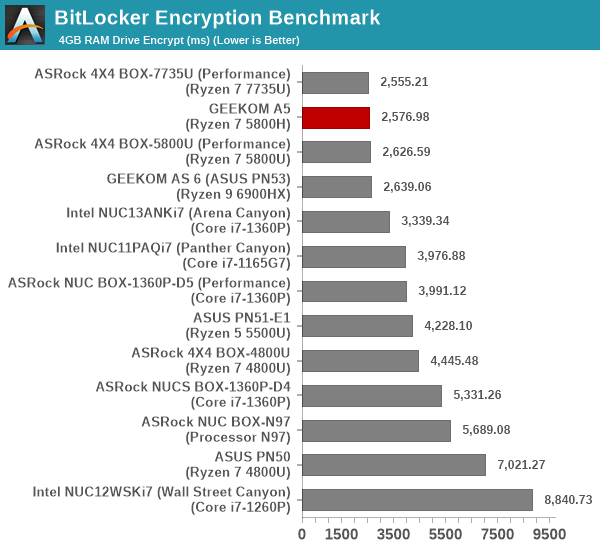
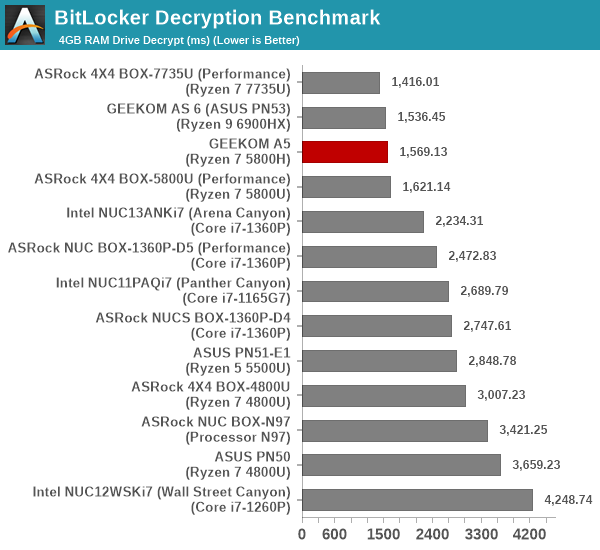
Hardware acceleration is available for the operations in all of the systems. The time taken for processing is directly dependent on the number of cores and available power budget. It must be noted that the AMD-based systems enjoying a distinct advantage over the Intel ones in this department, and it is no surprise to see the A5 in the top 3, bettered only by systems with Zen 3+ cores.
The integrated GPU in Cezanne is weak compared to the ones in the Rembrandt (Zen 3+) and Phoenix (Zen 4) APUs. It was great for 2021, but is only passable for 2023. We first take look at the GPU’s capabilities from AIDA64 and GPU-Z.
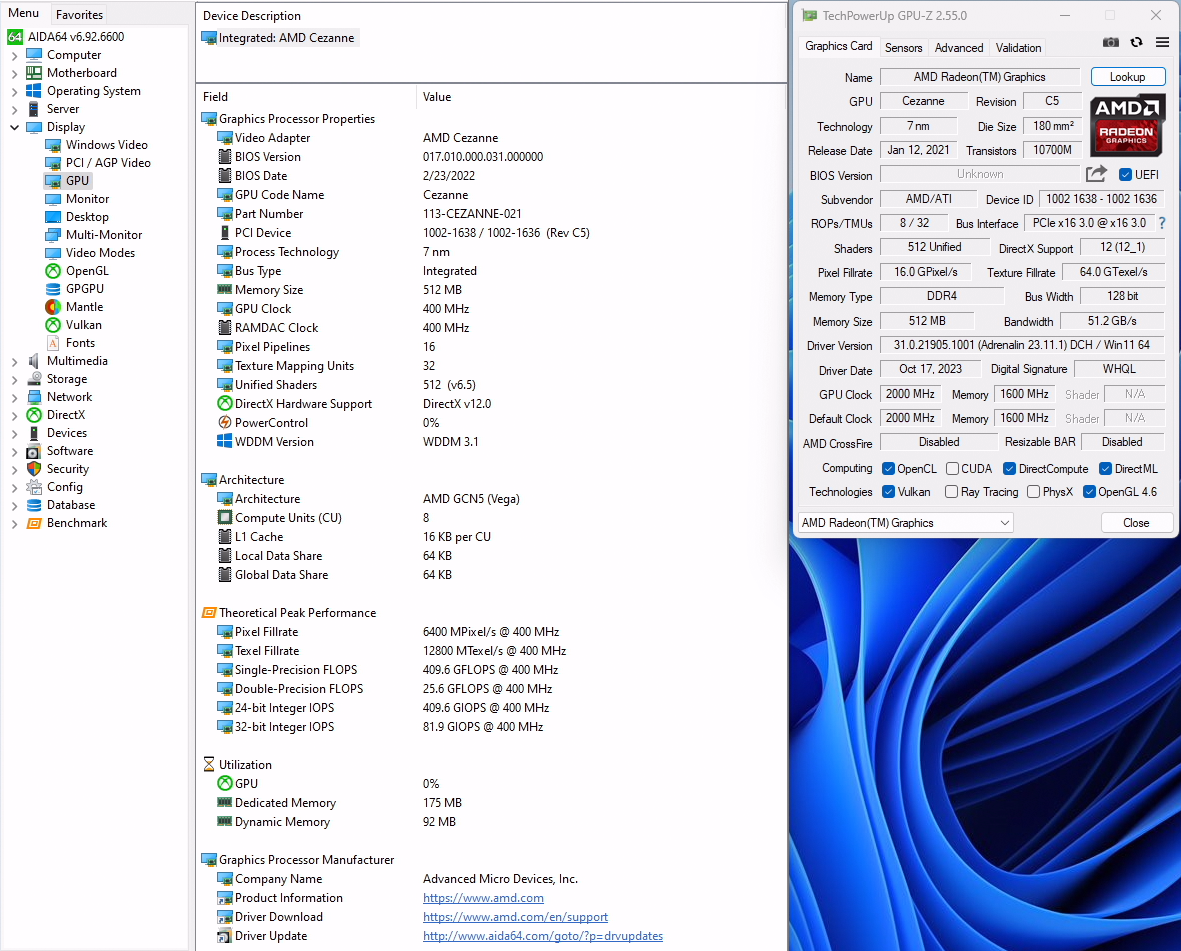
The RX Vega 8 iGPU is based on the Vega architecture. Since then, AMD has already shipped RDNA2 and RDNA3-based iGPUs in this segment. GPU performance evaluation typically involved gaming workloads, and for select PCs, GPU compute. We take a look at a few of them below.
GFXBench
The DirectX 12-based GFXBench tests from Kishonti are cross-platform, and available all the way down to smartphones. As such, they are not very taxing for discrete GPUs and modern integrated GPUs. We processed the offscreen versions of the ‘Aztec Ruins’ benchmark.
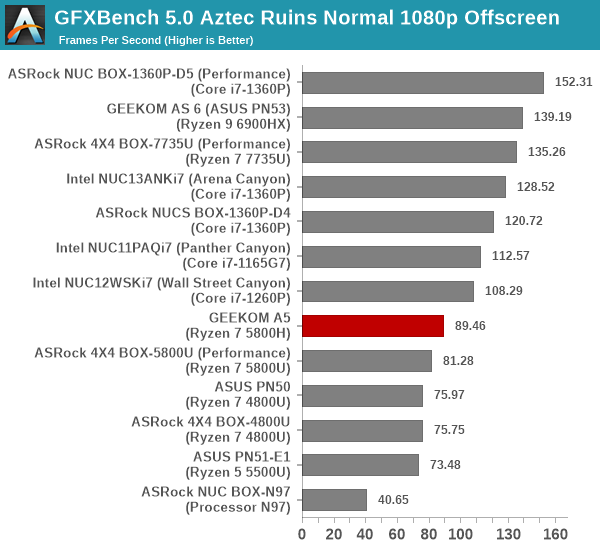
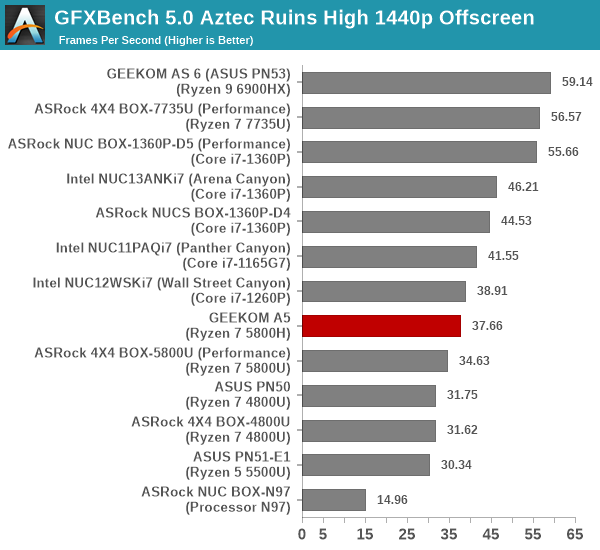
The results are largely along expected lines, ordered by iGPU generation. The Cezanne systems are bunched together towards the middle of the pack.
UL 3DMark
Four different workload sets were processed in 3DMark – Fire Strike, Time Spy, Night Raid, and Wild Life.
3DMark Fire Strike
The Fire Strike benchmark has three workloads. The base version is meant for high-performance gaming PCs. It uses DirectX 11 (feature level 11) to render frames at 1920 x 1080. The Extreme version targets 1440p gaming requirements, while the Ultra version targets 4K gaming system, and renders at 3840 x 2160.
| UL 3DMark – Fire Strike Workloads | |||
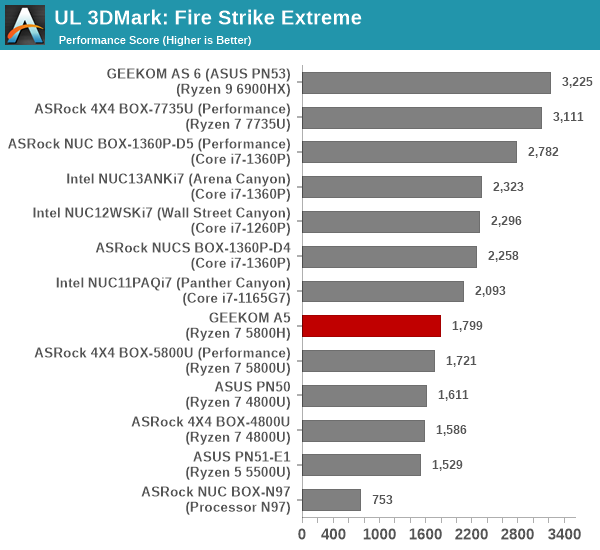
The graphs above presents the overall score for the Fire Strike Extreme and Fire Strike Ultra benchmarks across all the systems that are being compared.
3DMark Time Spy
The Time Spy workload has two levels with different complexities. Both use DirectX 12 (feature level 11). However, the plain version targets high-performance gaming PCs with a 2560 x 1440 render resolution, while the Extreme version renders at 3840 x 2160 resolution.
| UL 3DMark – Time Spy Workloads | |||
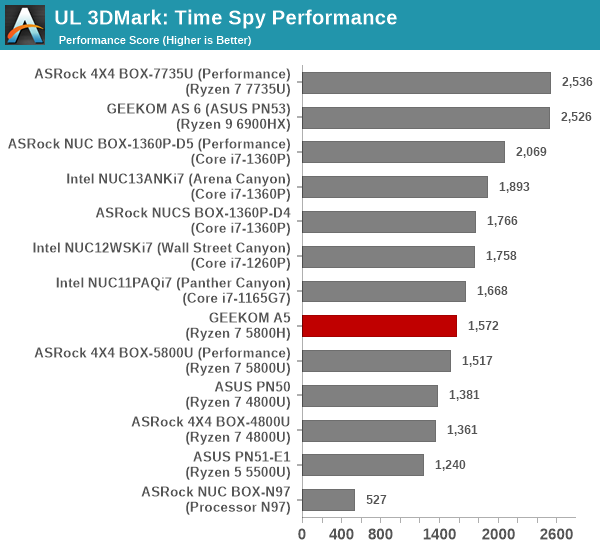
The graphs above present both numbers for all the systems that are being compared in this review.
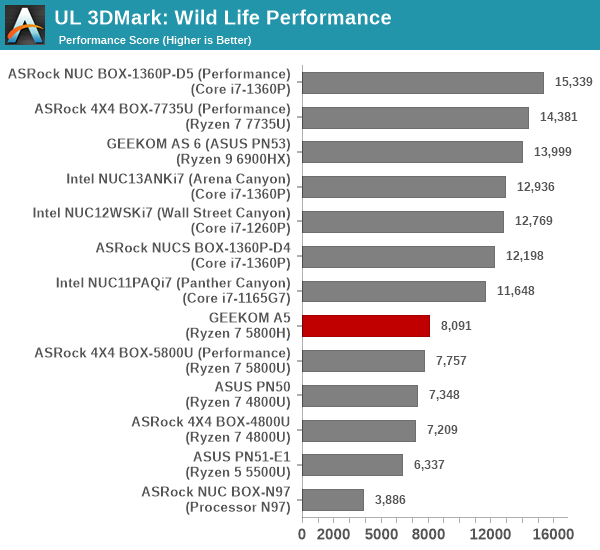
3DMark Wild Life
The Wild Life workload was initially introduced as a cross-platform GPU benchmark in 2020. It renders at a 2560 x 1440 resolution using Vulkan 1.1 APIs on Windows. It is a relatively short-running test, reflective of mobile GPU usage. In mid-2021, UL released the Wild Life Extreme workload that was a more demanding version that renders at 3840 x 2160 and runs for a much longer duration reflective of typical desktop gaming usage.
| UL 3DMark – Wild Life Workloads | |||
3DMark Night Raid
The Night Raid workload is a DirectX 12 benchmark test. It is less demanding than Time Spy, and is optimized for integrated graphics. The graph below presents the overall score in this workload for different system configurations.
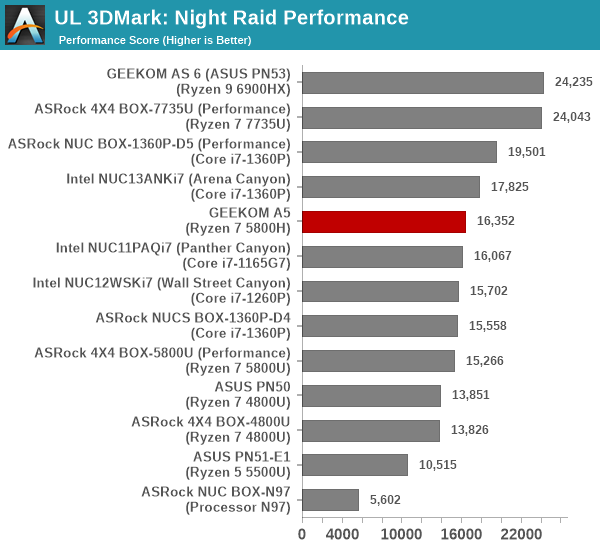
The relative performance of the GEEKOM A5 across all of the 3DMark workloads is the same as what was observed in the GFXbench workloads. The comparison is between systems with integrated GPUs based on different architectures. As a result, the order is just based on the generation, rather than the minor differences in the iGPU clock rates and/or power budgets.
One of the key drivers of advancements in computing systems is multi-tasking. On mobile devices, this is quite lightweight – cases such as background email checks while the user is playing a mobile game are quite common. Towards optimizing user experience in those types of scenarios, mobile SoC manufacturers started integrating heterogenous CPU cores – some with high performance for demanding workloads, while others were frugal in terms of both power consumption / die area and performance. This trend is now slowly making its way into the desktop PC space.
Multi-tasking in typical PC usage is much more demanding compared to phones and tablets. Desktop OSes allow users to launch and utilize a large number of demanding programs simultaneously. Responsiveness is dictated largely by the OS scheduler allowing different tasks to move to the background. The processor is required to work closely with the OS thread scheduler to optimize performance in these cases. Keeping these aspects in mind, the evaluation of multi-tasking performance is an interesting subject to tackle.
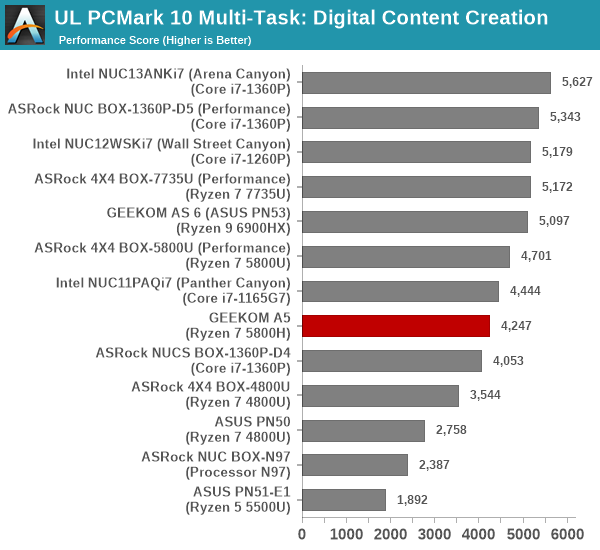
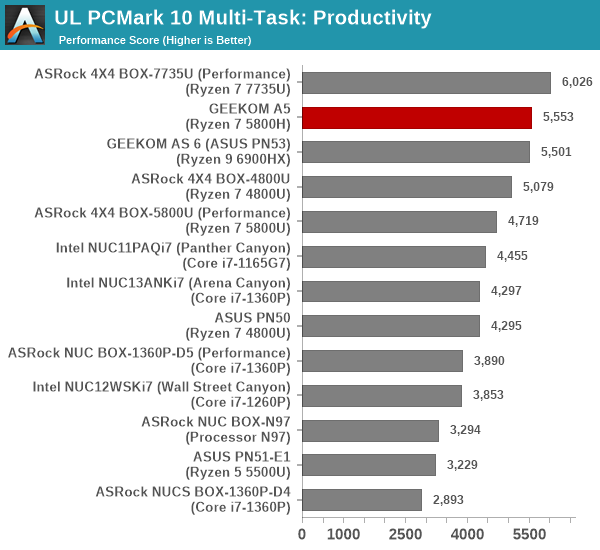
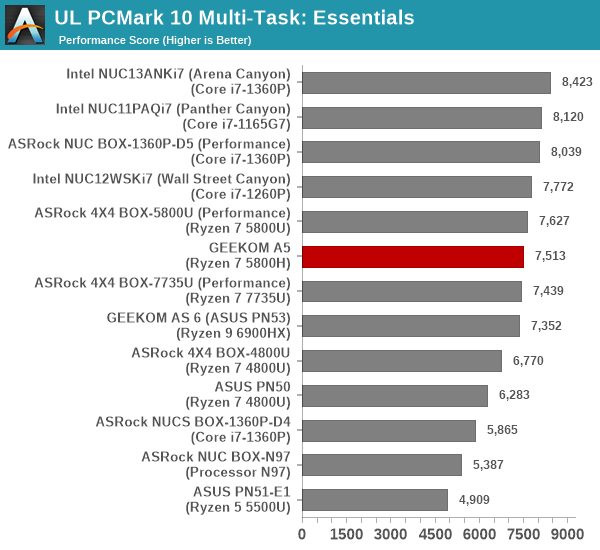
We have augmented our systems benchmarking suite to quantitatively analyze the multi-tasking performance of various platforms. The evaluation involves triggering a ffmpeg transcoding task to transform 1716 3840×1714 frames encoded as a 24fps AVC video (Blender Project’s ‘Tears of Steel’ 4K version) into a 1080p HEVC version in a loop. The transcoding rate is monitored continuously. One complete transcoding pass is allowed to complete before starting the first multi-tasking workload – the PCMark 10 Extended bench suite. A comparative view of the PCMark 10 scores for various scenarios is presented in the graphs below. Also available for concurrent viewing are scores in the normal case where the benchmark was processed without any concurrent load, and a graph presenting the loss in performance.
| UL PCMark 10 Load Testing – Digital Content Creation Scores | |||
| UL PCMark 10 Load Testing – Productivity Scores | |||
| UL PCMark 10 Load Testing – Essentials Scores | |||
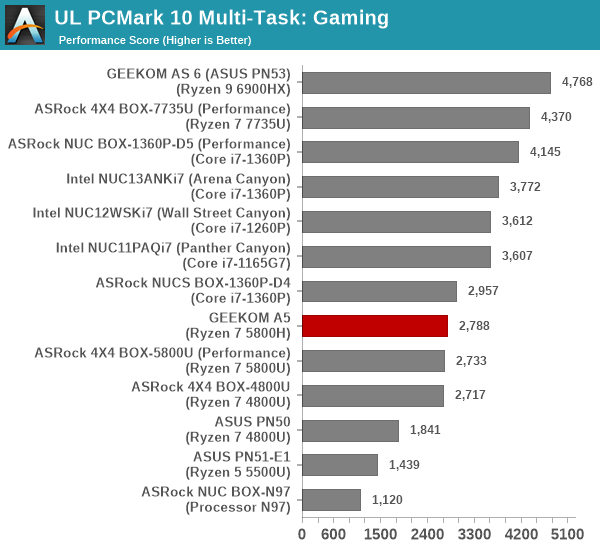
| UL PCMark 10 Load Testing – Gaming Scores | |||
| UL PCMark 10 Load Testing – Overall Scores | |||
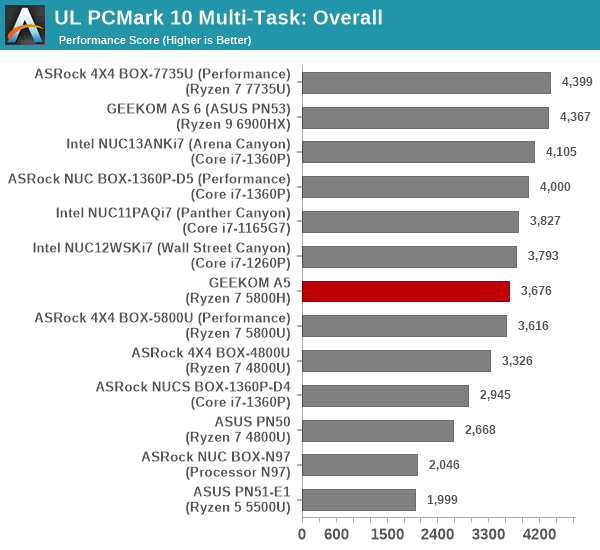
The addition of concurrent loading obviously reduces the PCMark 10 scores. The A5 doesn’t lose out too much on the performance front despite the lack of a ‘thread director’ mechanism. This is due to the additional number of high-performance cores compared to the equivalent-generation Alder Lake-P processor. Other than that, the relative ordering across different processor generations is maintained.
Following the completion of the PCMark 10 benchmark, a short delay is introduced prior to the processing of Principled Technologies WebXPRT4 on MS Edge. Similar to the PCMark 10 results presentation, the graph below show the scores recorded with the transcoding load active. Available for comparison are the dedicated CPU power scores and a measure of the performance loss.
| Principled Technologies WebXPRT4 Load Testing Scores (MS Edge) | |||
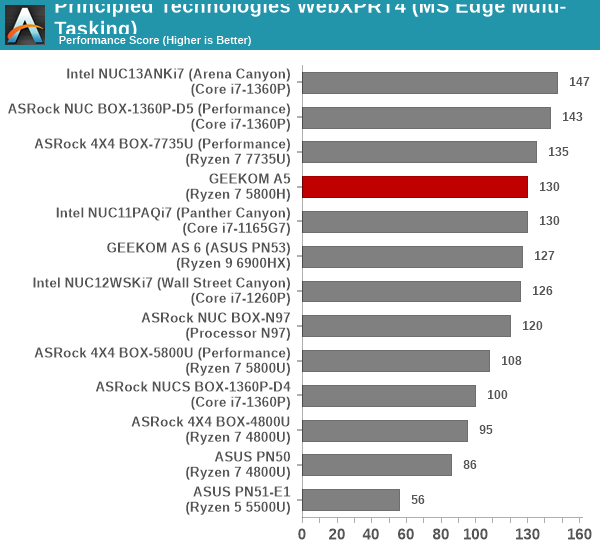
The A5 loses around half its performance in the presence of the transcoding task. However, the eight high-performance cores ensures that the system actually moves up in the raw scores front compared to the no-concurrent-loading scenario.
The final workload tested as part of the multitasking evaluation routine is CINEBENCH R23.
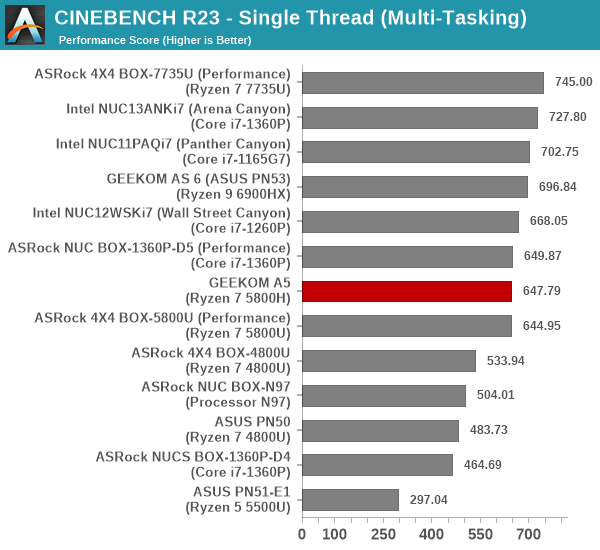
| 3D Rendering – CINEBENCH R23 Load Testing – Single Thread Score | |||
| 3D Rendering – CINEBENCH R23 Load Testing – Multiple Thread Score | |||
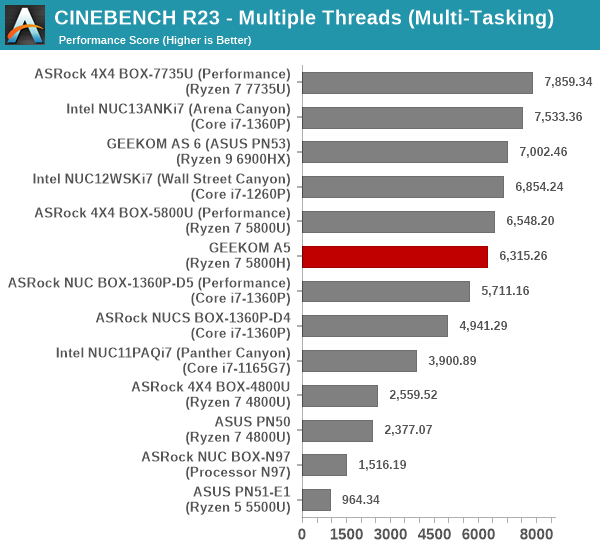
The performance loss in 3D rendering is around 50%, with the multi-threaded case being slightly less impacted. However, the relative ordering between the different systems doesn’t change.
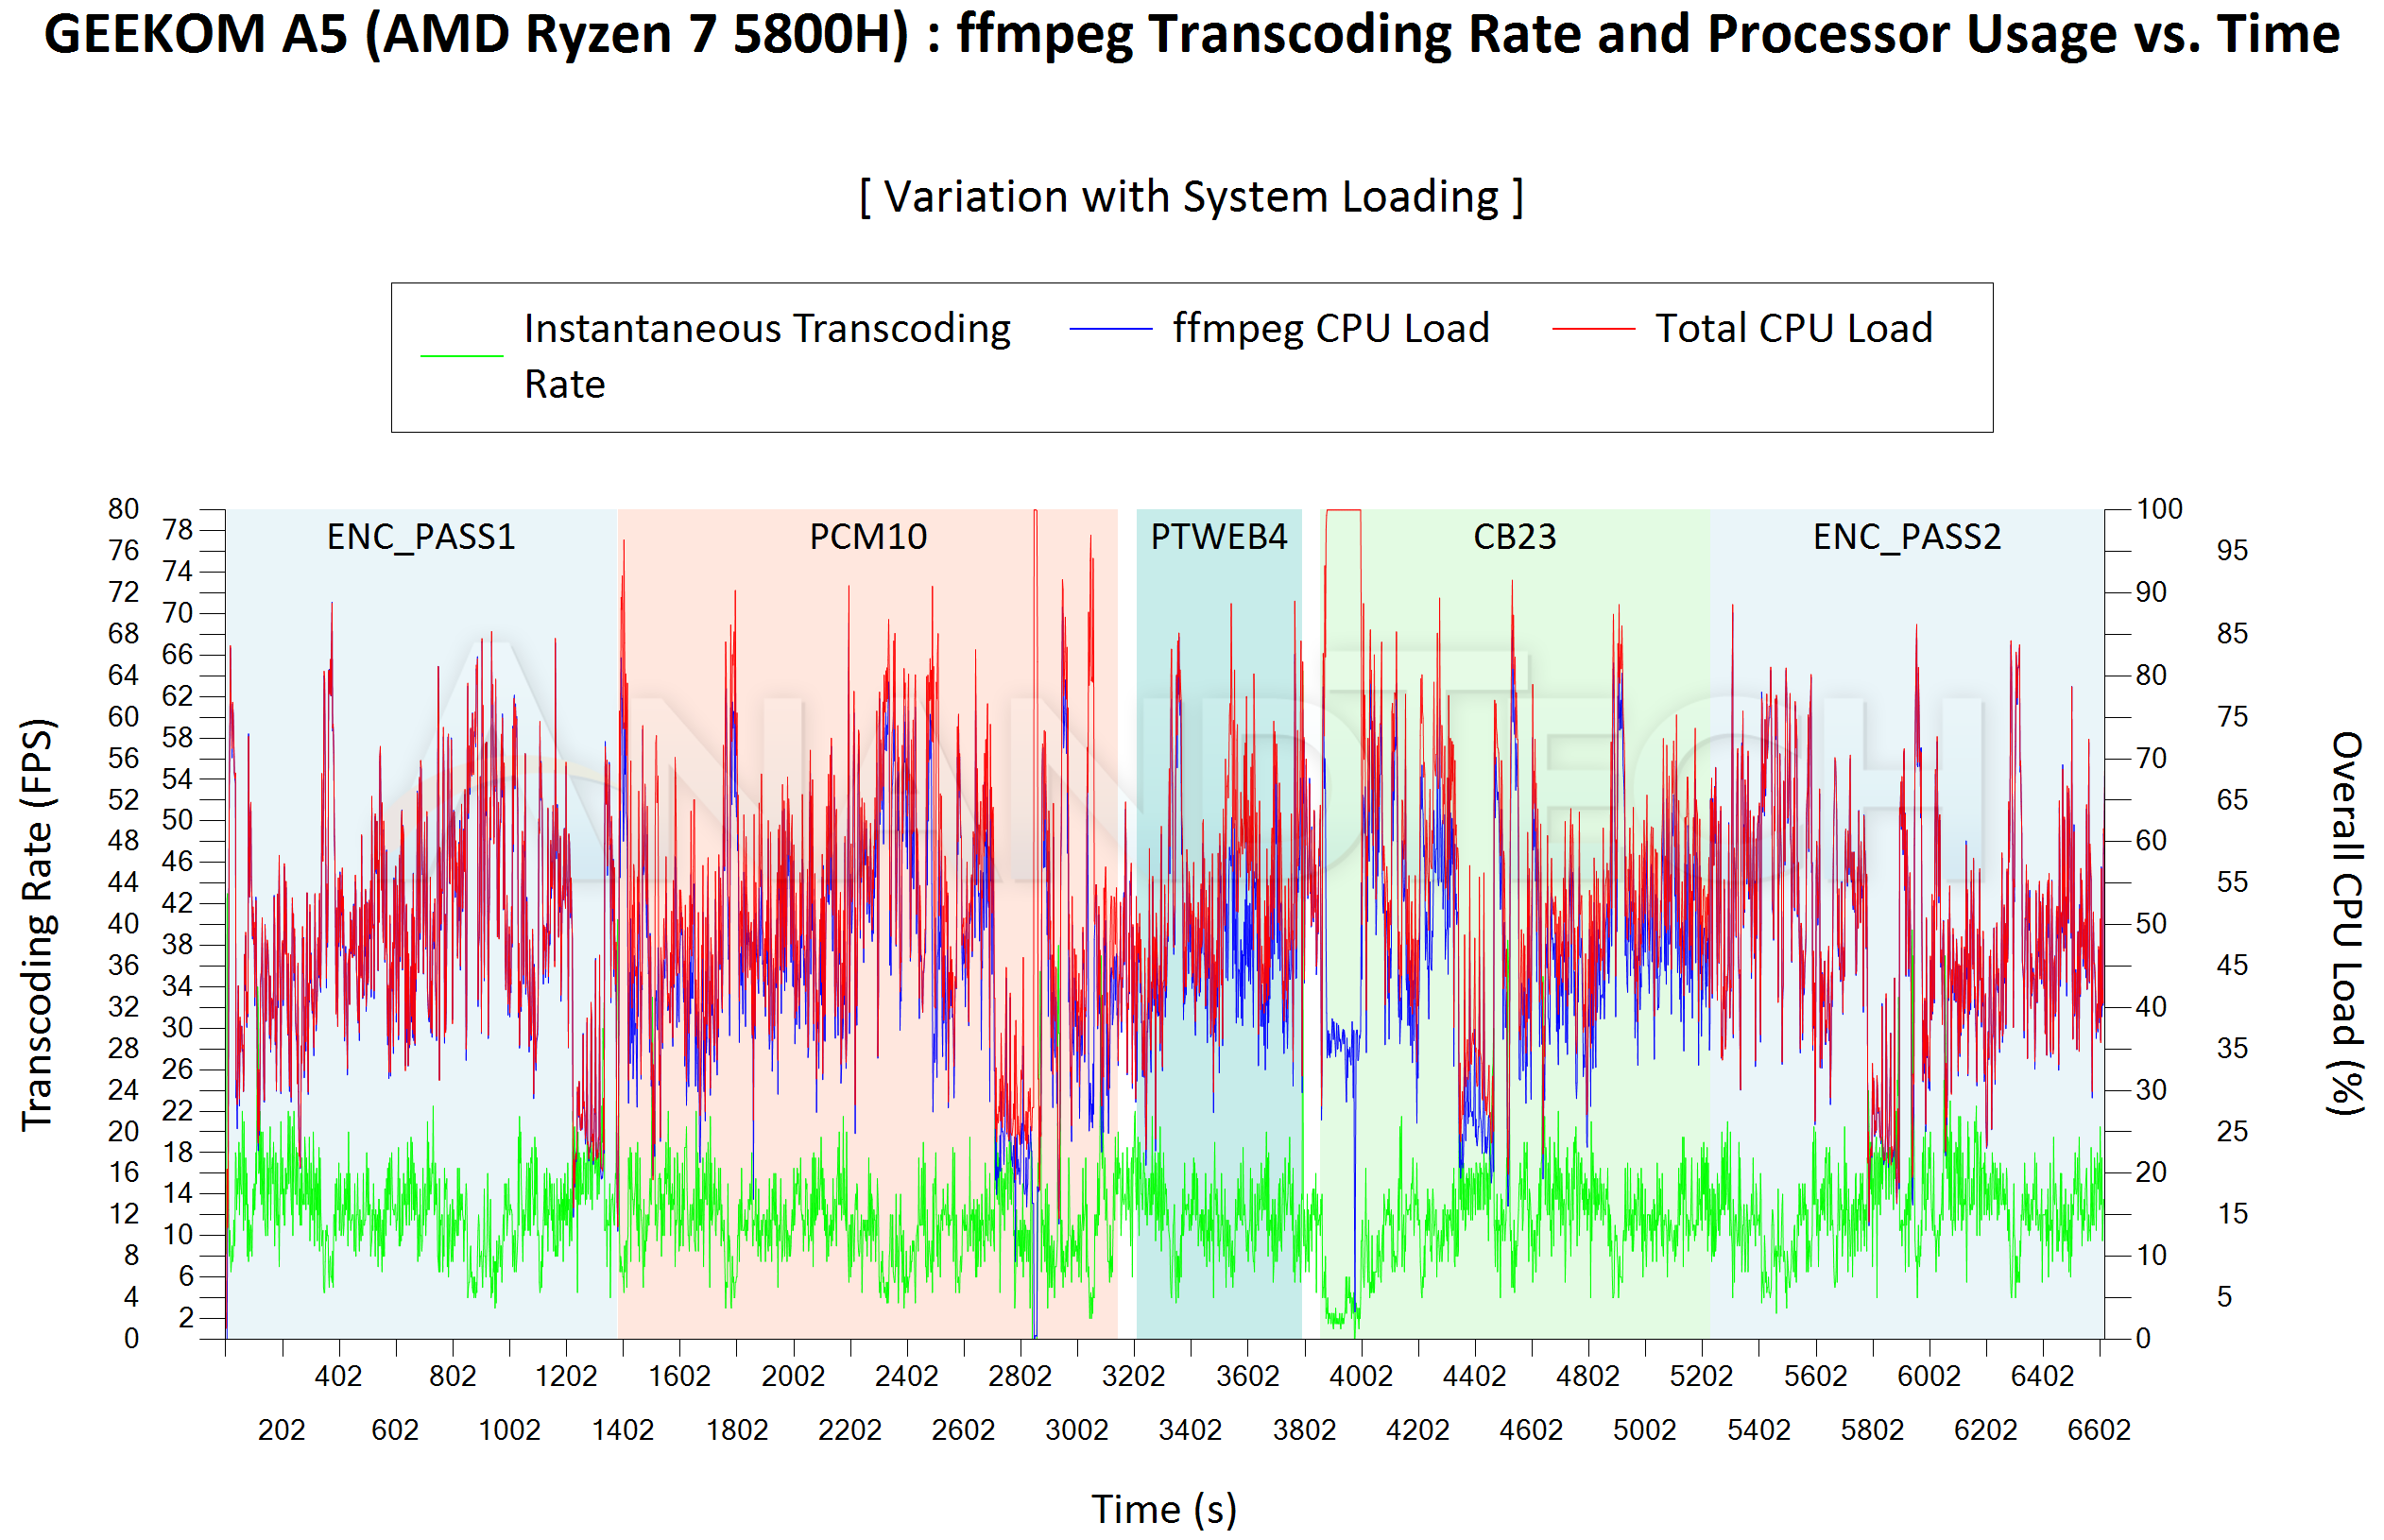
After the completion of all the workloads, we let the transcoding routine run to completion. The monitored transcoding rate throughout the above evaluation routine (in terms of frames per second) is graphed below.
| GEEKOM A5 (AMD Ryzen 7 5800H) ffmpeg Transcoding Rate (Multi-Tasking Test) | |||
| Task Segment | Transcoding Rate (FPS) | ||
| Minimum | Average | Maximum | |
| Transcode Start Pass | 3 | 12.83 | 43 |
| PCMark 10 | 0 | 11.28 | 38 |
| WebXPRT 4 | 3.5 | 11.8 | 21.5 |
| Cinebench R23 | 0 | 11.31 | 38.5 |
| Transcode End Pass | 2.5 | 12.71 | 39.5 |
The drop in transcoding frame rate is slightly higher for the AMD systems compared to the newer Intel systems with the thread director technology. The larger count of high-performance cores in the AMD systems helps alleviate some of the performance loss.
The 2022 Q4 update to our system reviews brings an updated HTPC evaluation suite for systems. After doing away with the evaluation of display refresh rate stability and Netflix streaming evaluation, the local media playback configurations have also seen a revamp. This section details each of the workloads processed on the GEEKOM A5 as part of the HTPC suite.
YouTube Streaming Efficiency
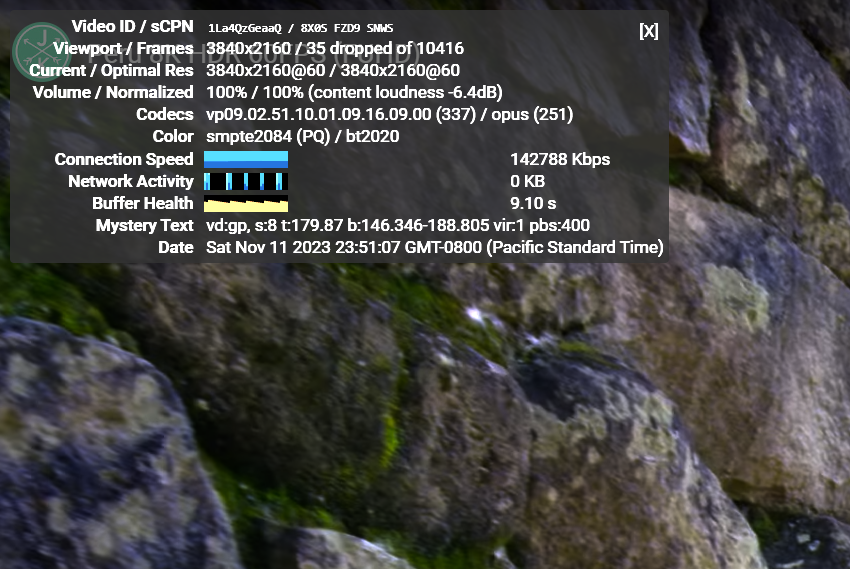
YouTube continues to remain one of the top OTT platforms, primarily due to its free ad-supported tier. Our HTPC test suite update retains YouTube streaming efficiency evaluation as a metric of OTT support in different systems. Mystery Box’s Peru 8K HDR 60FPS video is the chosen test sample. On PCs running Windows, it is recommended that HDR streaming videos be viewed using the Microsoft Edge browser after putting the desktop in HDR mode.
YouTube Streaming Statistics
The GPU in GEEKOM A5 supports hardware decoding of VP9 Profile 2, and we see the stream encoded with that codec being played back. The streaming is perfect, thanks to the powerful GPU and hardware decoding support – the couple of dropped frames observed in the statistics below are due to mouse clicks involved in bringing up the overlay.
The streaming efficiency-related aspects such as GPU usage and at-wall power consumption are also graphed below.
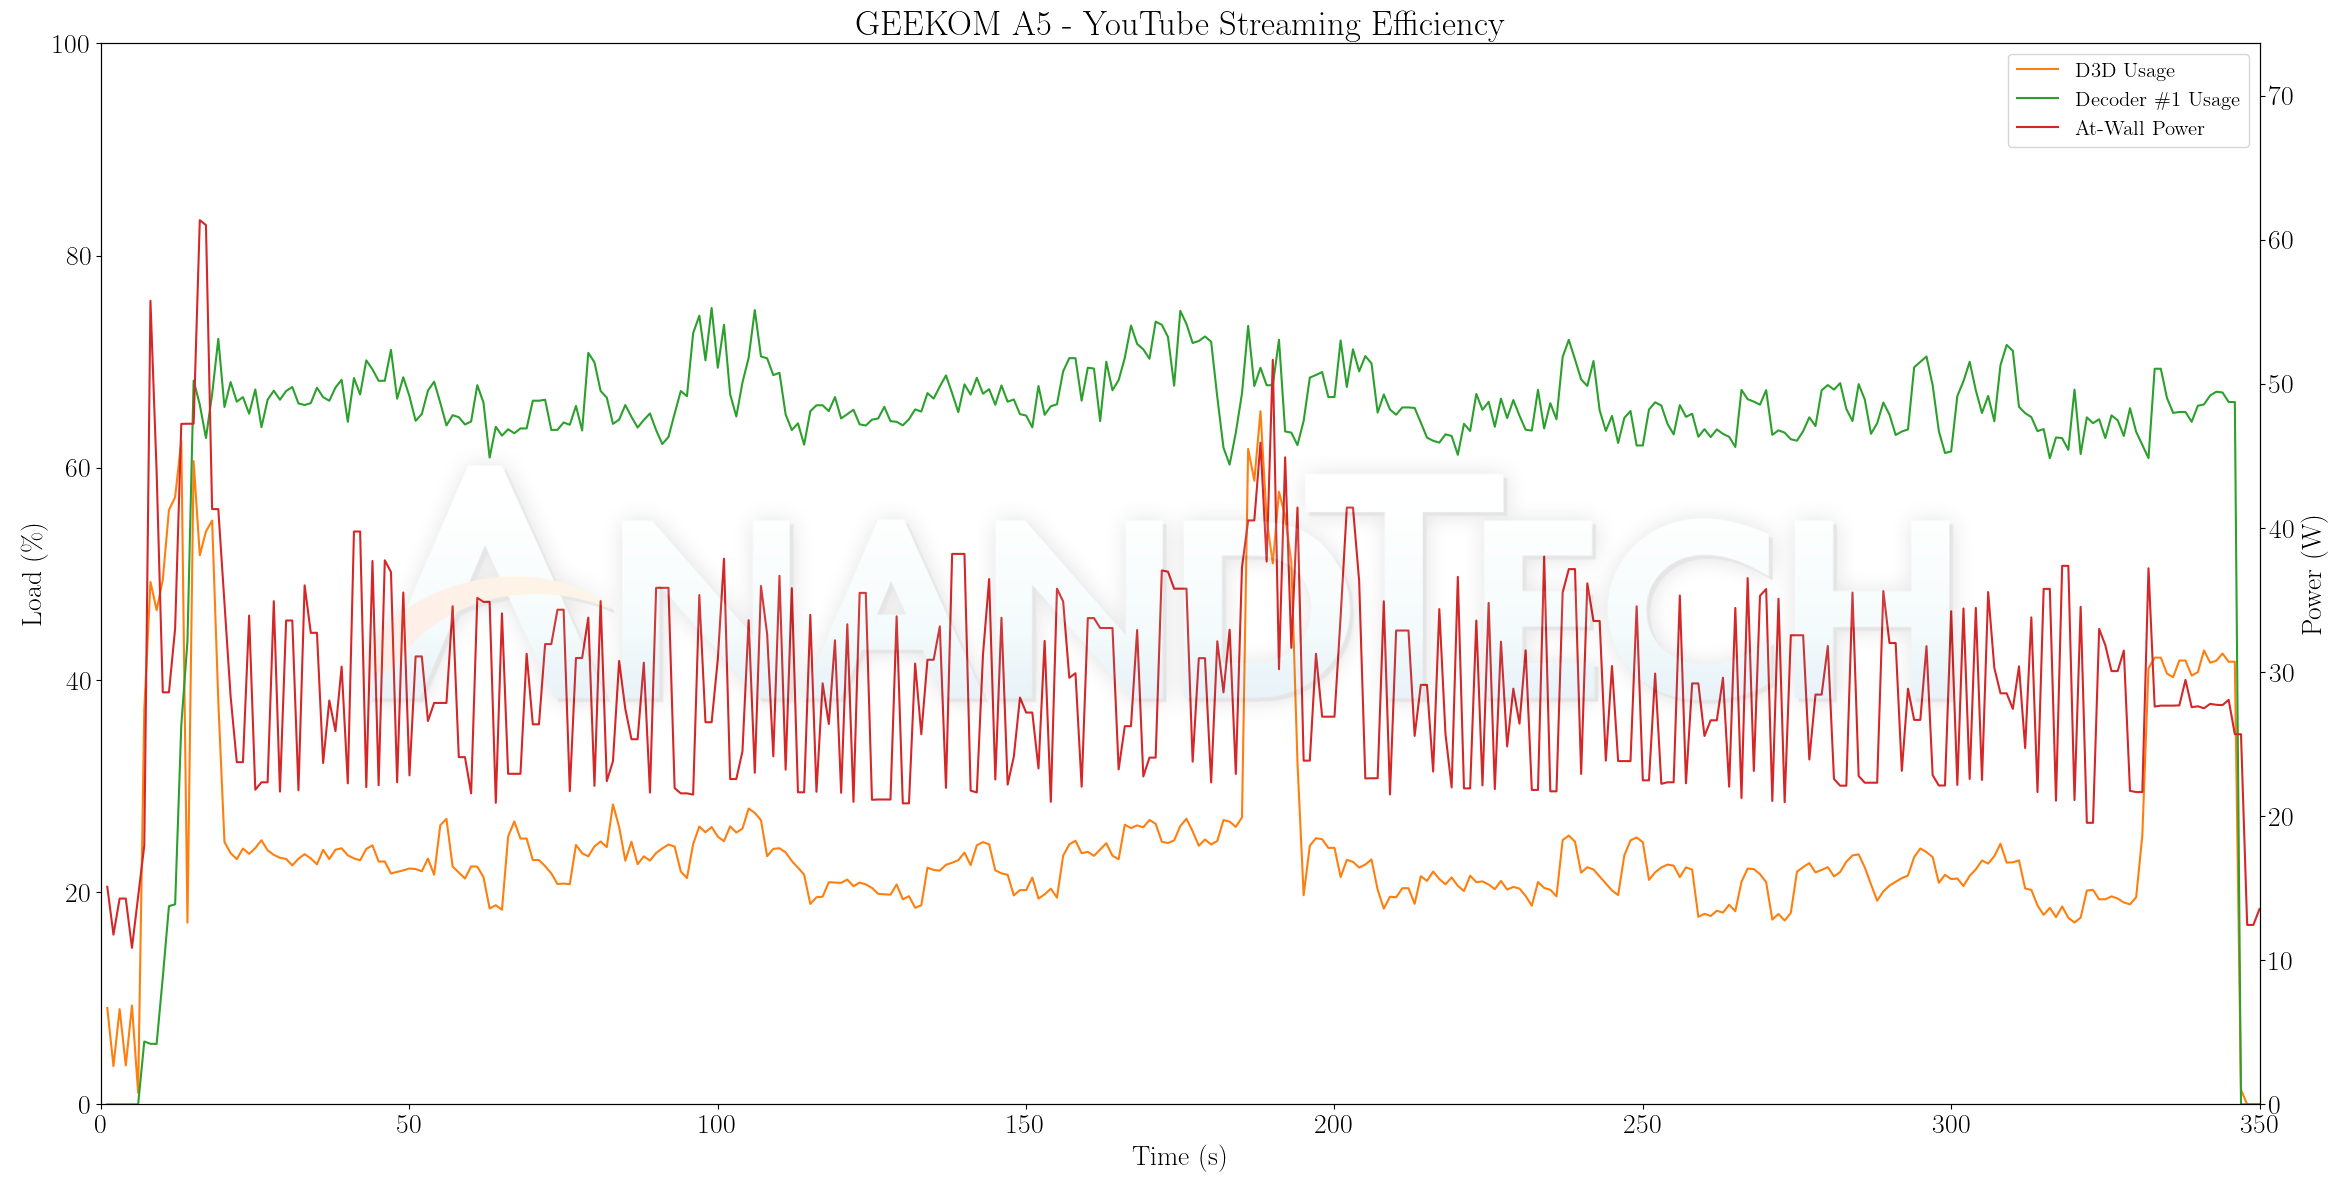
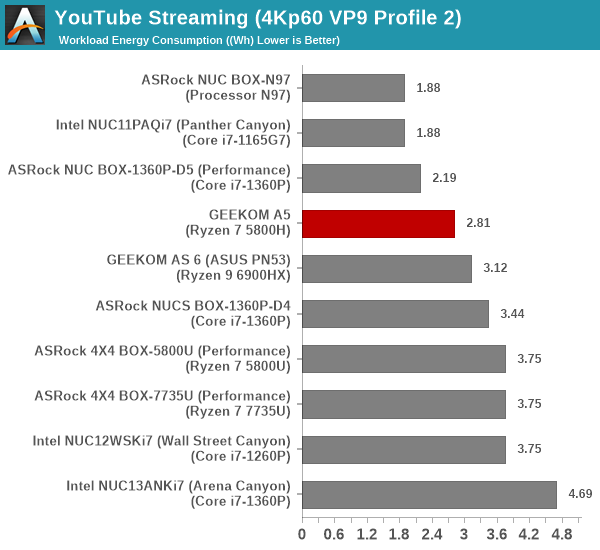
The system is very energy efficient – in fact, it is the best we have seen as yet for an AMD-based system. It is possible that driver improvements over the years have also contributed to this efficiency, as the numbers for the older AMD systems are based on the drivers that were current at the time of their review.
Hardware-Accelerated Encoding and Decoding
The transcoding benchmarks in the systems performance section presented results from evaluating AMD’s VCE within Handbrake’s framework. The capabilities of the decoder engine are brought out by DXVAChecker.
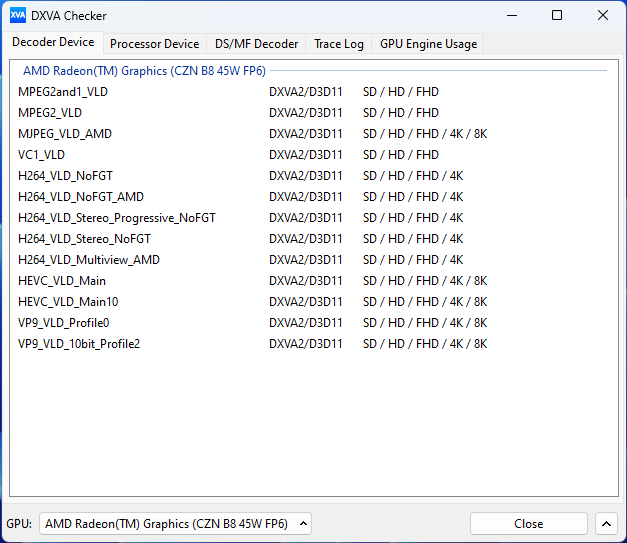
Video Decoding Hardware Acceleration in GEEKOM A5
Obviously, there are no new additions to this list compared to what we saw back in 2021.
Local Media Playback
Evaluation of local media playback and video processing is done by playing back files encompassing a range of relevant codecs, containers, resolutions, and frame rates. A note of the efficiency is also made by tracking GPU usage and power consumption of the system at the wall. Users have their own preference for the playback software / decoder / renderer, and our aim is to have numbers representative of commonly encountered scenarios. Our Q4 2022 test suite update replaces MPC-HC (in LAV filters / madVR modes) with mpv. In addition to being cross-platform and open-source, the player allows easy control via the command-line to enable different shader-based post-processing algorithms. From a benchmarking perspective, the more attractive aspect is the real-time reporting of dropped frames in an easily parseable manner. The players / configurations considered in this subsection include:
- VLC 3.0.18
- Kodi 20.2
- mpv 0.35.1 (hwdec auto, vo=gpu-next)
- mpv 0.35.1 (hwdec auto, vo=gpu-next, profile=gpu-hq)
Fourteen test streams (each of 90s duration) were played back from the local disk with an interval of 30 seconds in-between. Various metrics including GPU usage, at-wall power consumption, and total energy consumption were recorded during the course of this playback.
All our playback tests were done with the desktop HDR setting turned on. It is possible for certain system configurations to automatically turn on/off the HDR capabilities prior to the playback of a HDR video, but, we didn’t take advantage of that in our testing.
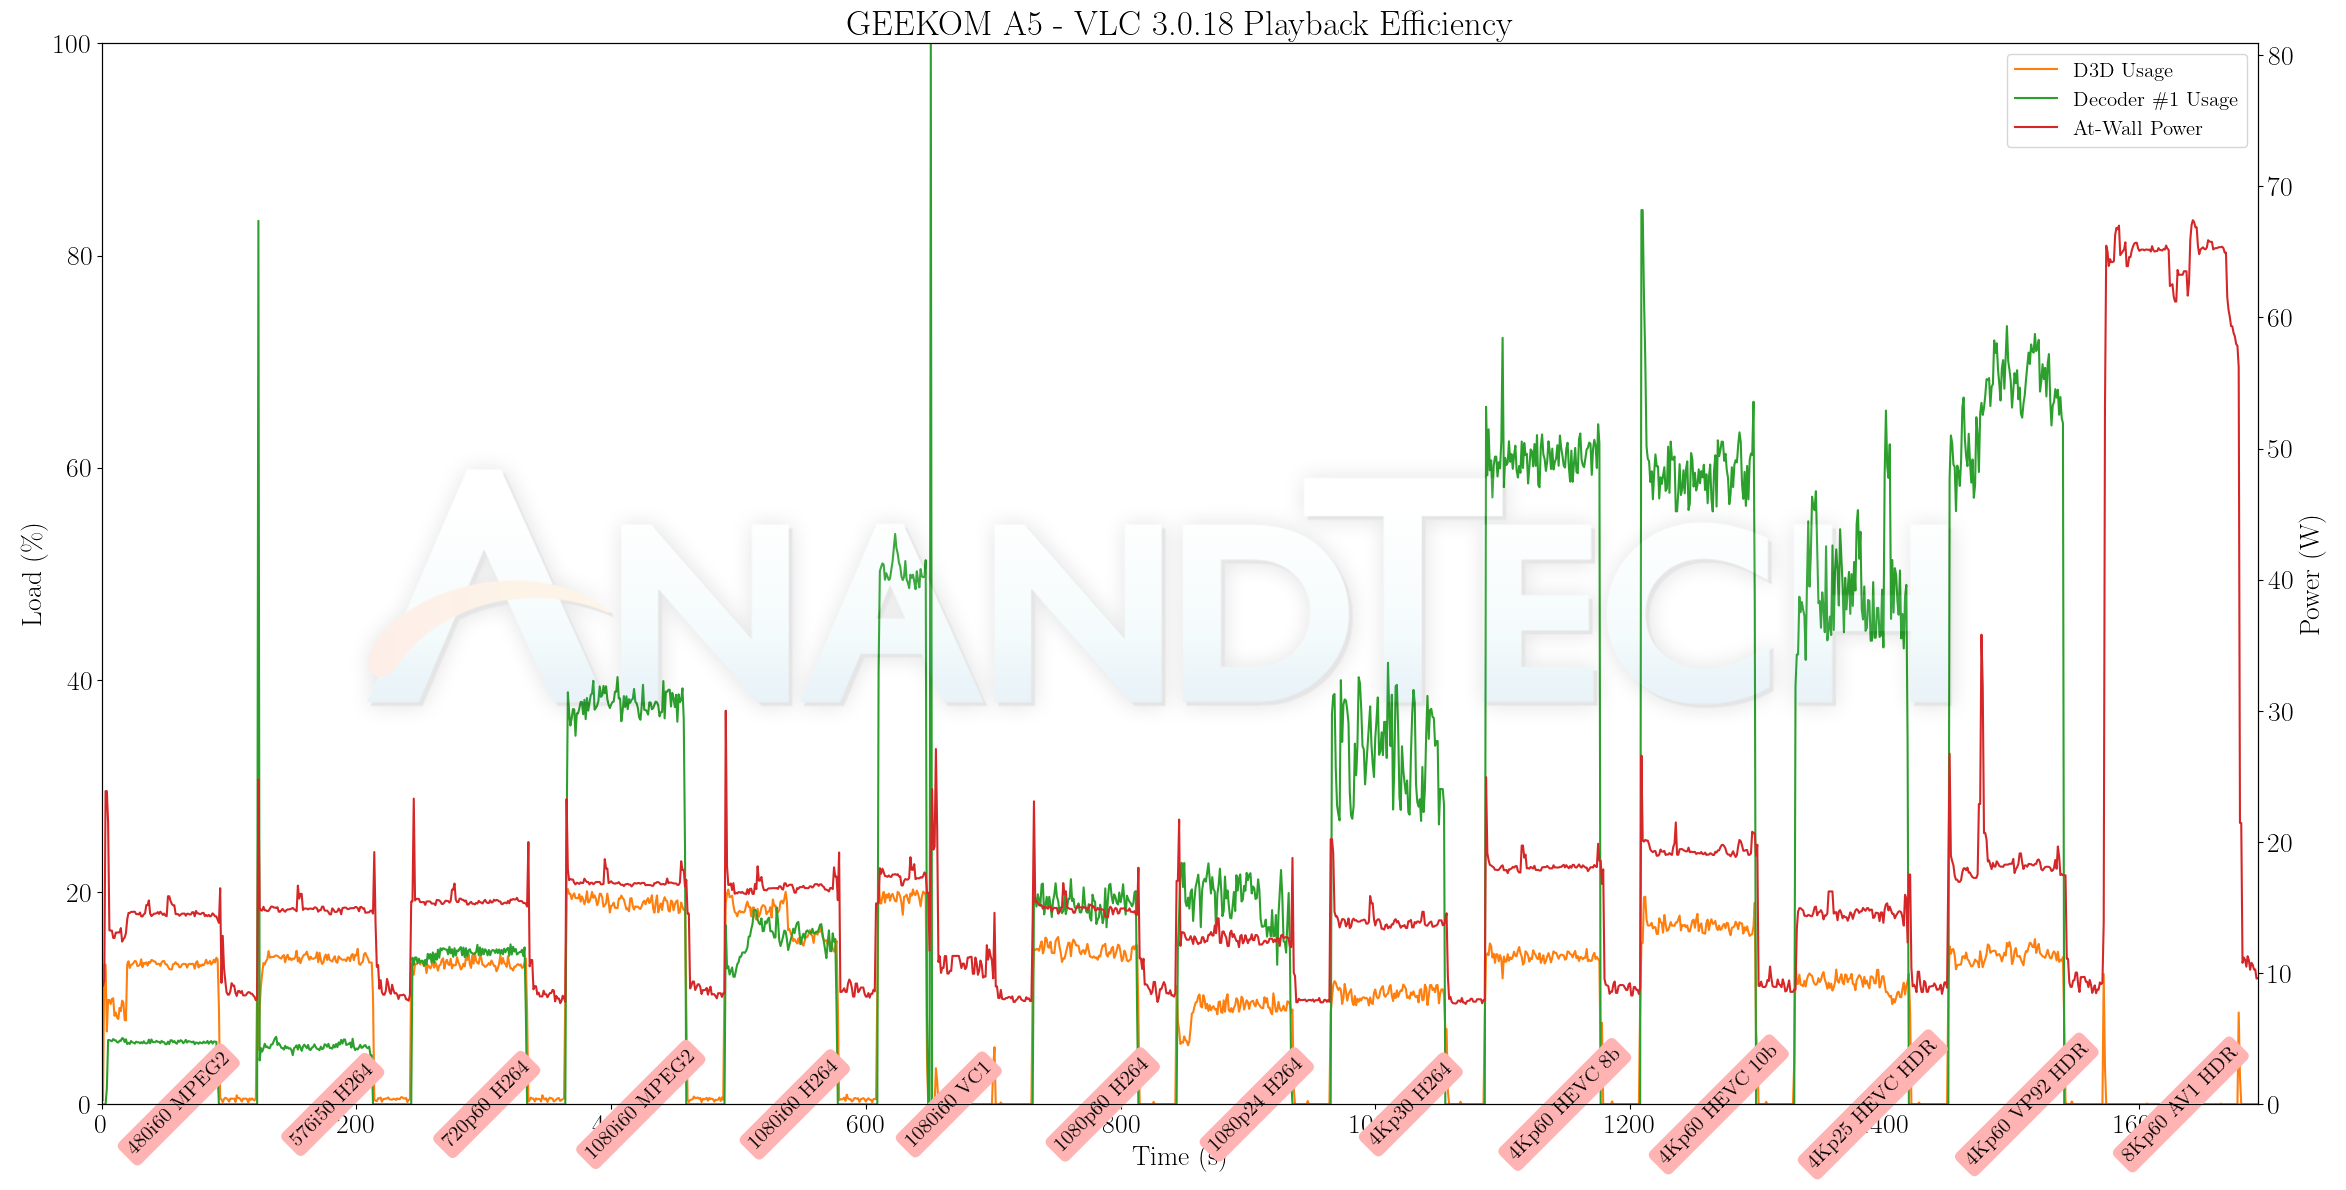
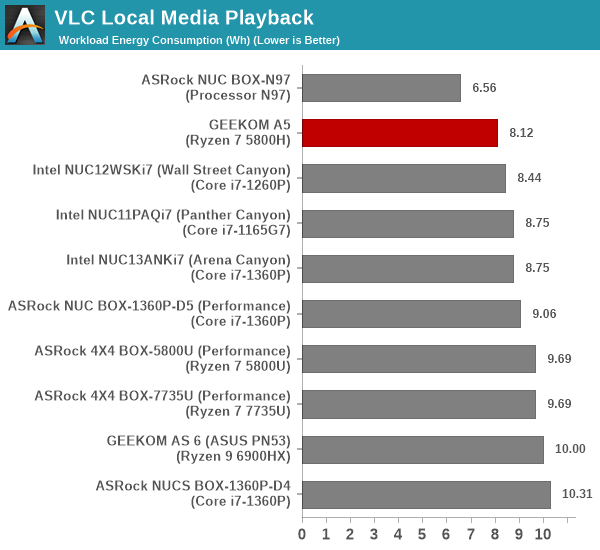
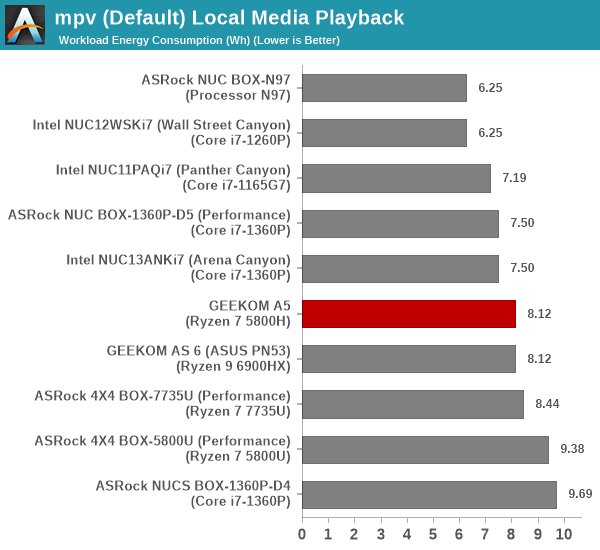
The A5 again scores on energy efficiency, but the driver we tested with had some issue with VC-1 playback. Other than that, all other supported codecs (the 8Kp60 AV1 is not in that list) played back without dropped frames.
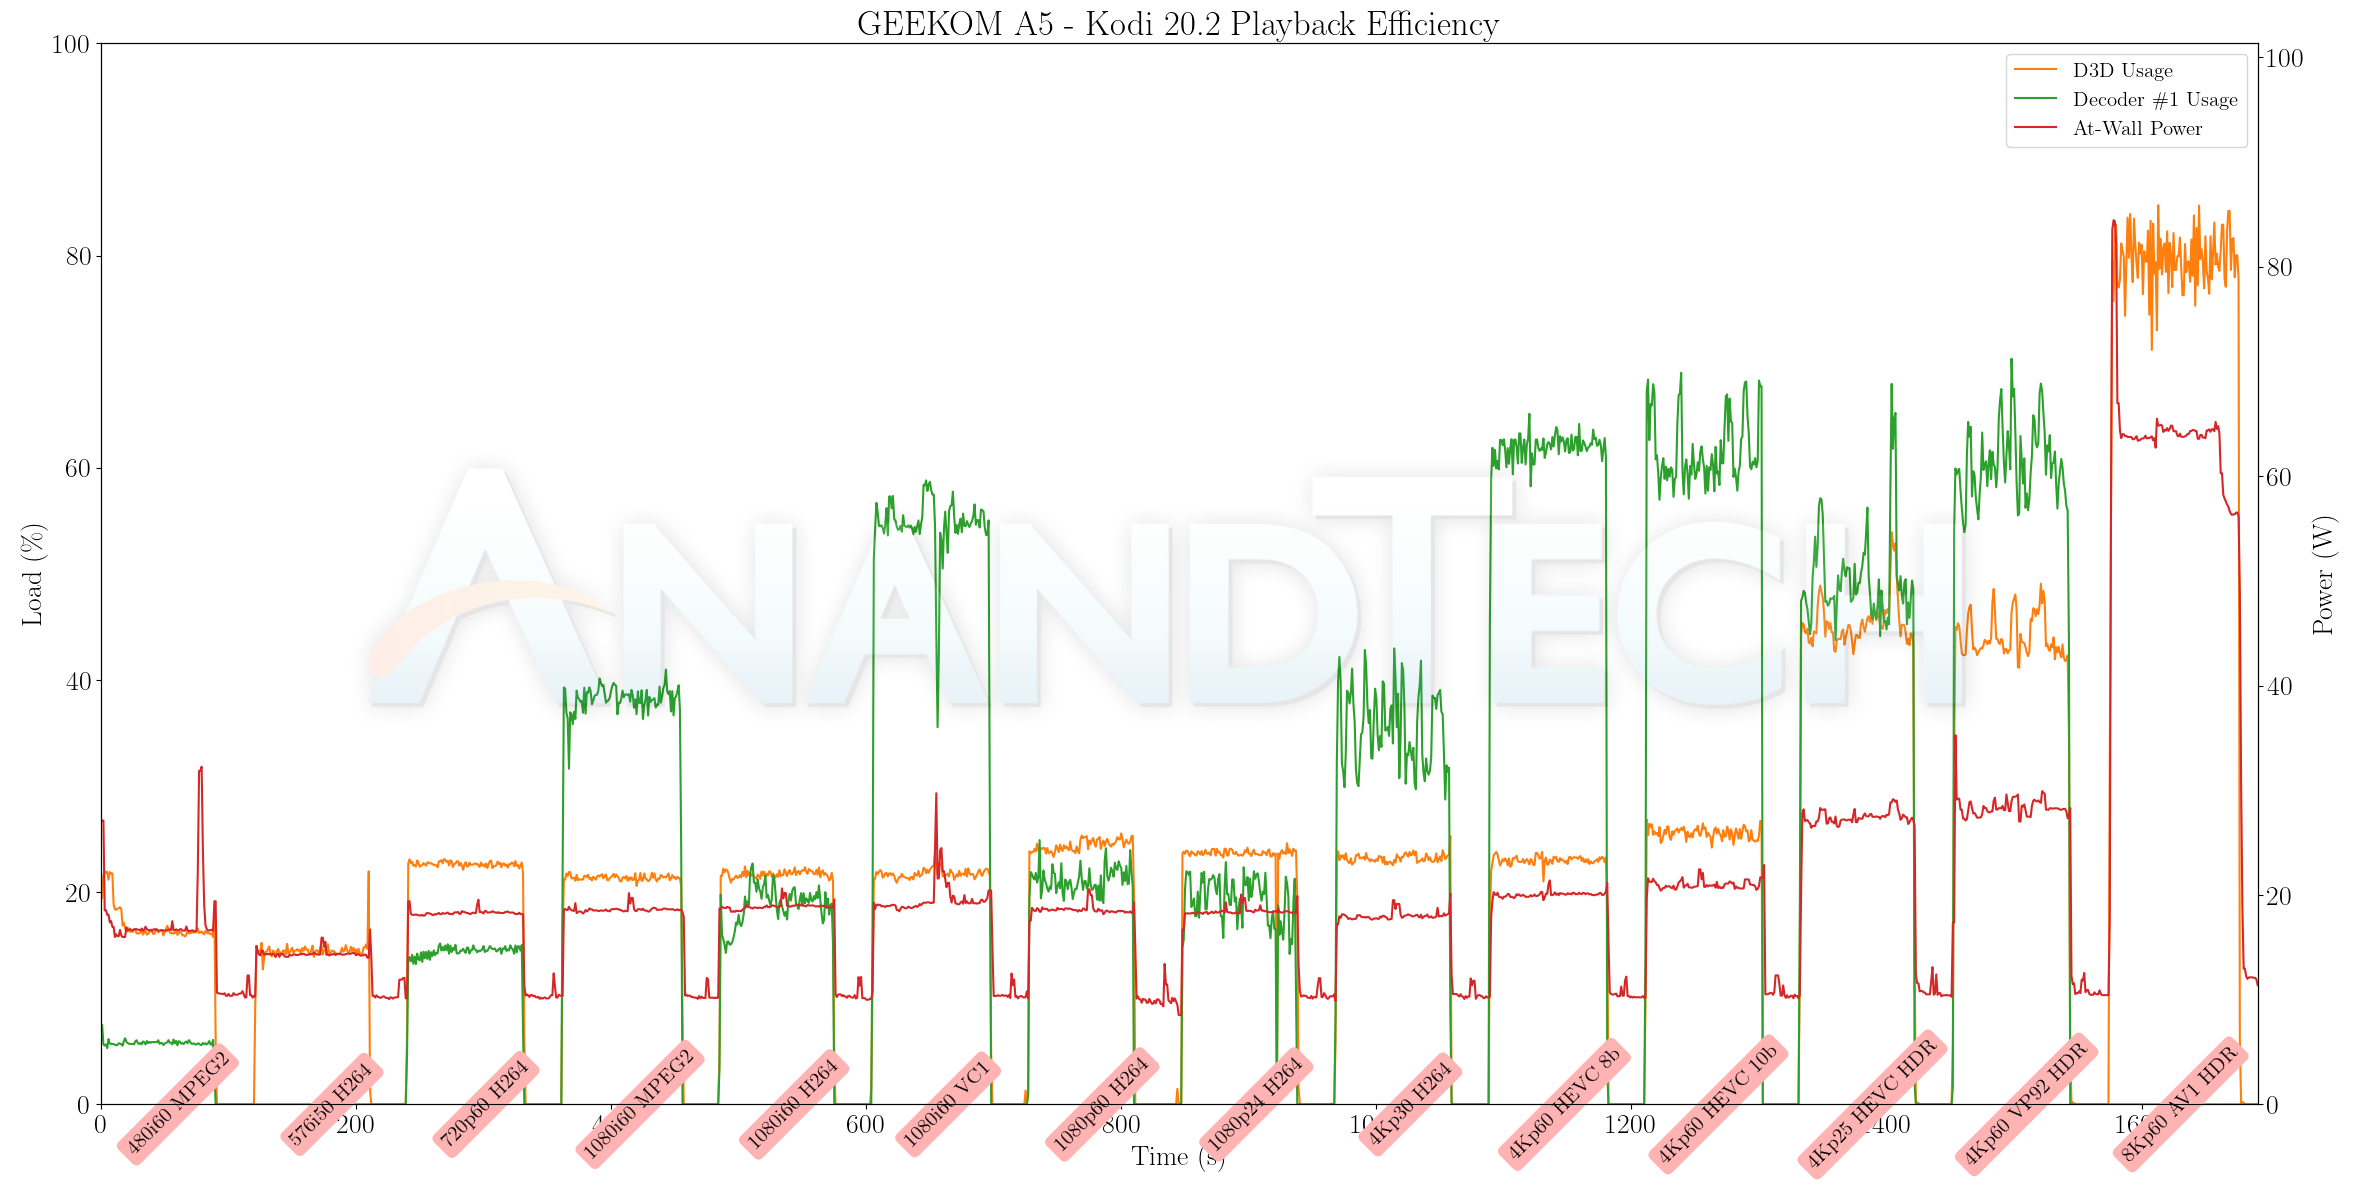
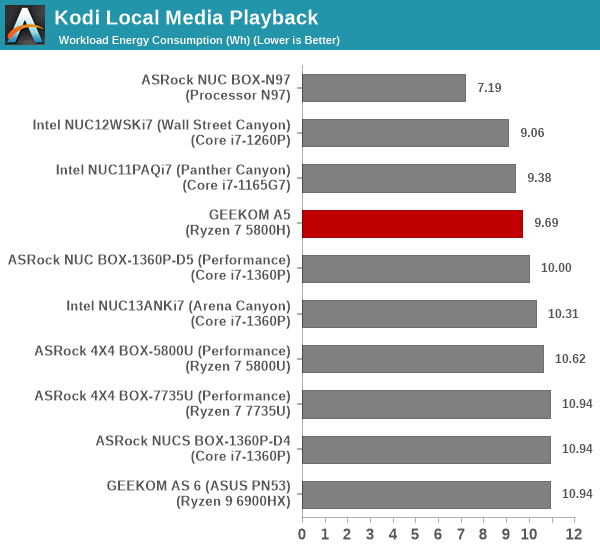
The Kodi UI keeps the iGPU fairly busy even during idle, and that results in the A5 slipping down a few notches on the energy efficiency front. Other than the 8Kp60 AV1 clip, everything else played back without breaking a sweat – including the VC1 clip.
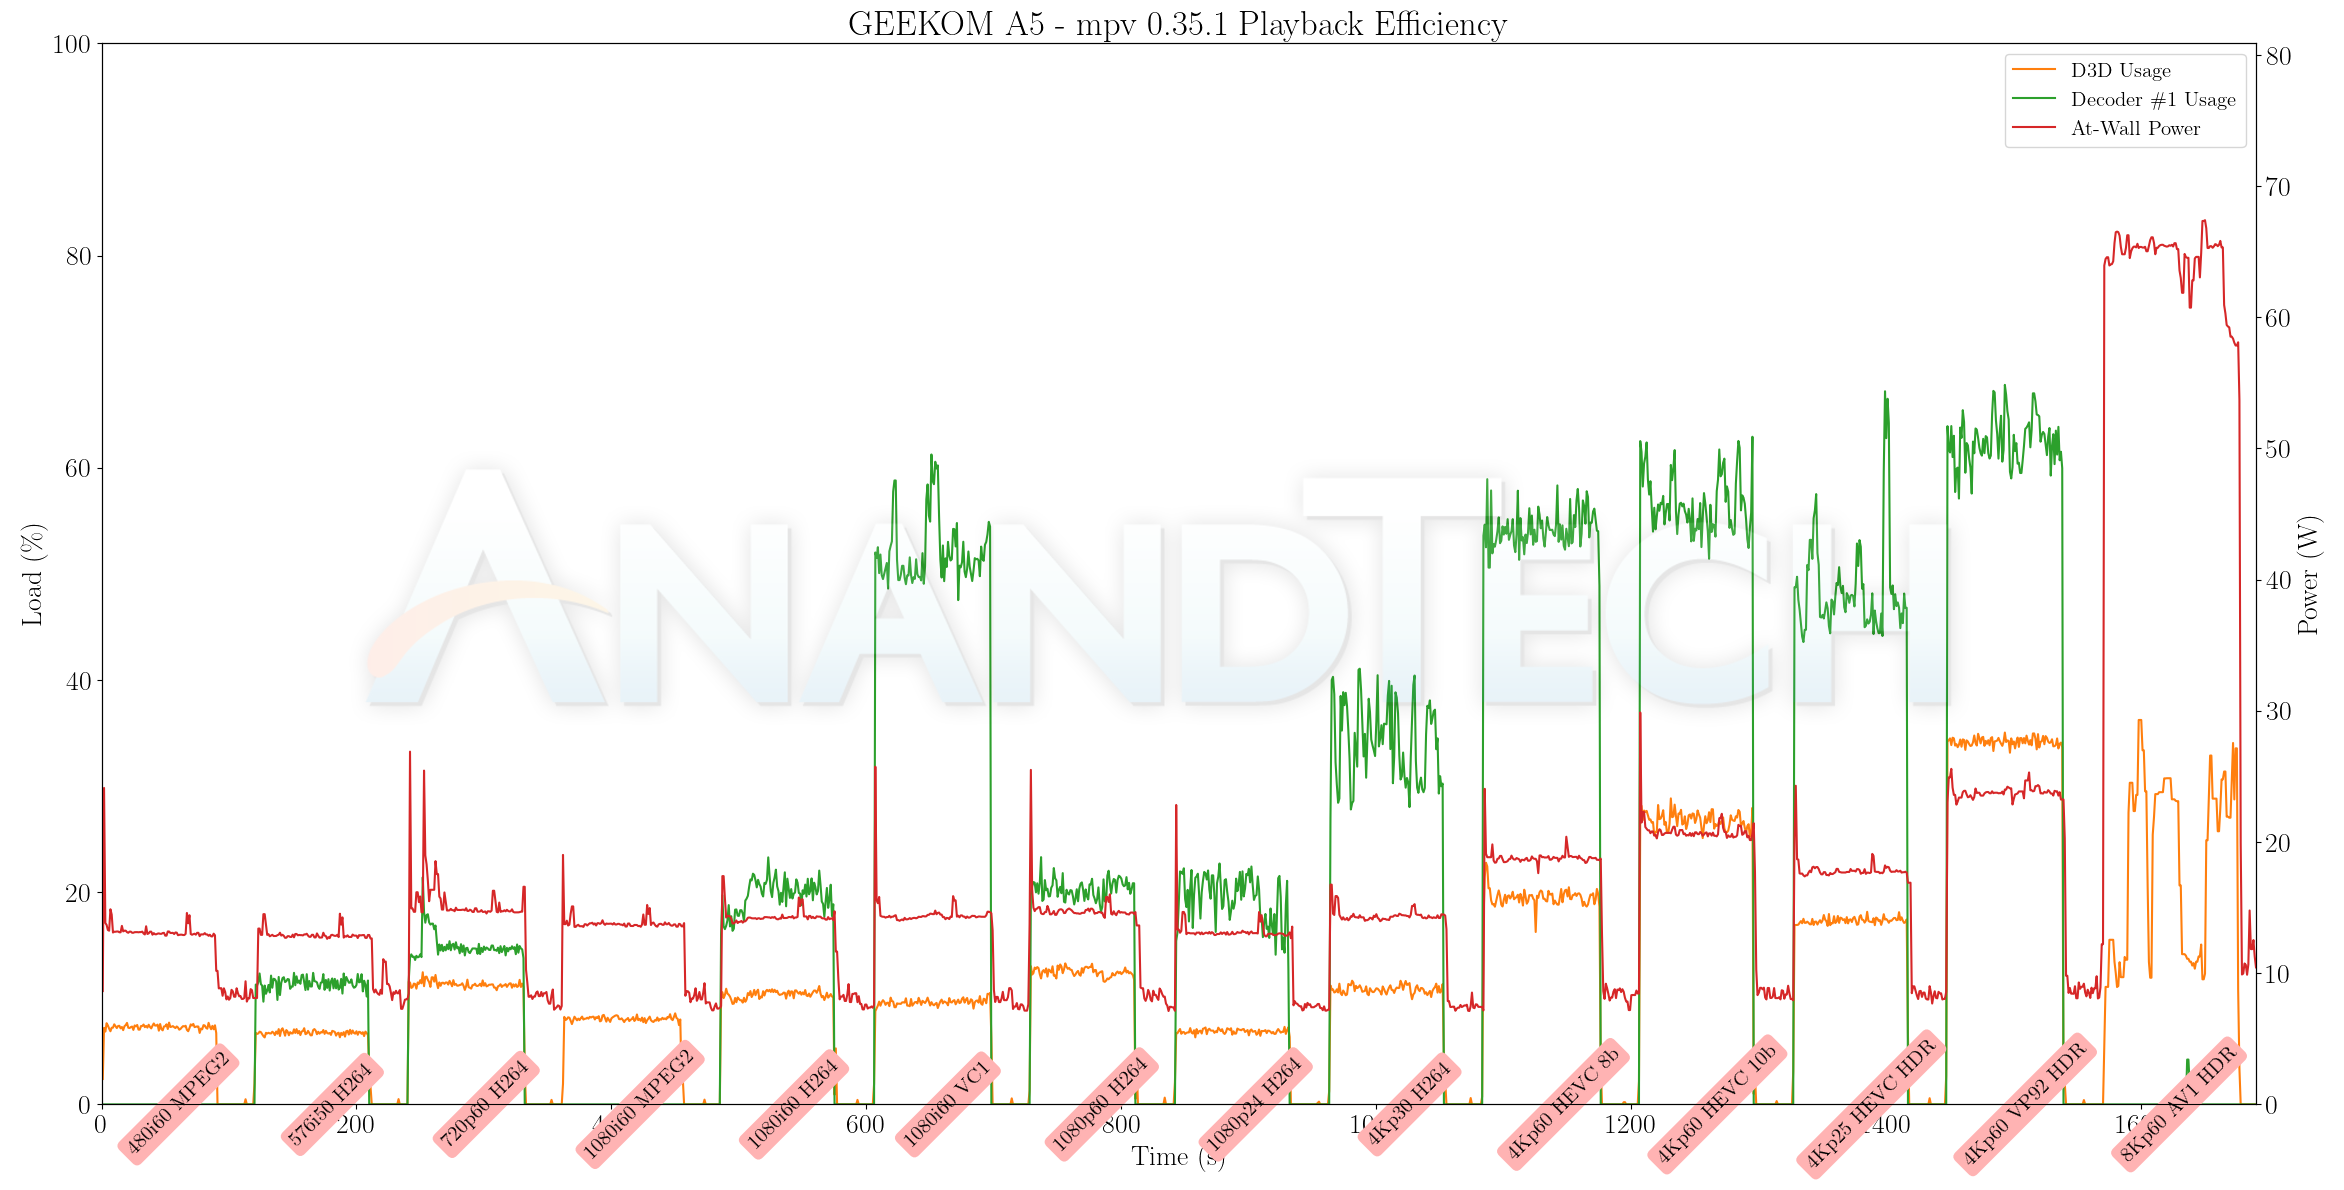
A similar experience was encountered with mpv. The energy numbers took a beating because the software made extra efforts towards playing back the AV1 clip compared to VLC and Kodi.
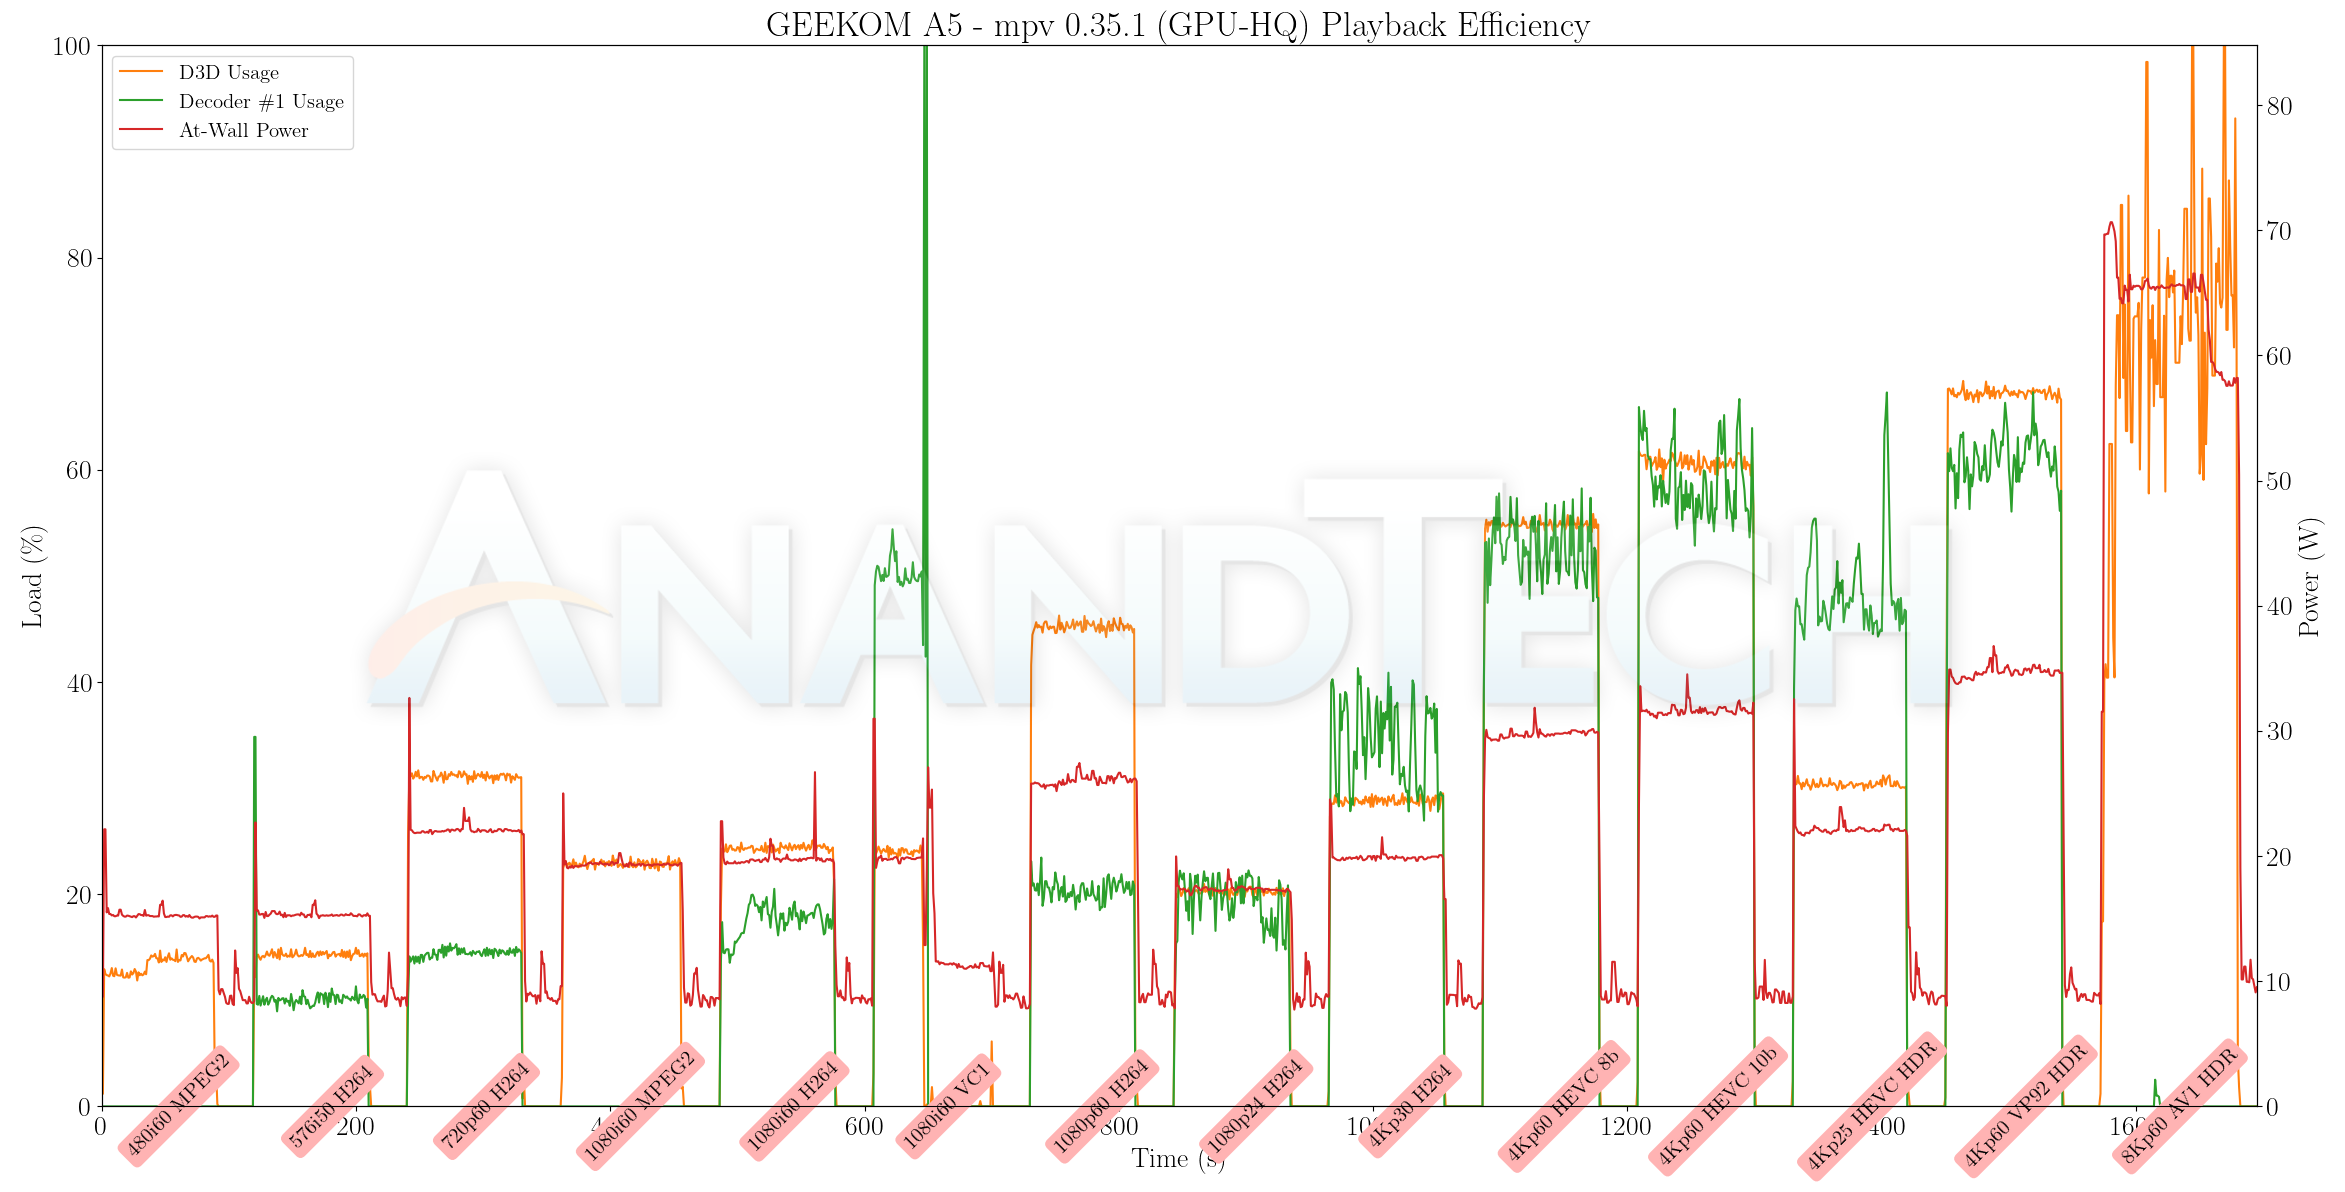
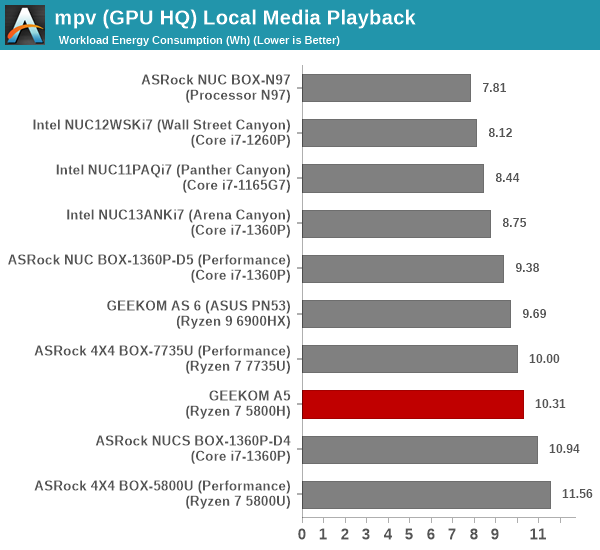
Activating the shaders for additional post-processing drives up the energy consumption. In addition, the VC1 clip encountered the same issue as with VLC in this mode. This renders the energy consumption numbers not entirely useful.
The GEEKOM A5 works well for most common codecs, but playback – either local or via network streaming – could sometimes be a hit or a miss depending on the codec, resolution, and browser / playback software.
The power consumption at the wall was measured with a 4K display being driven through the HDMI port of the system. In the graph below, we compare the idle and load power of the GEEKOM A5 with other systems evaluated before. For load power consumption, we ran the AIDA64 System Stability Test with various stress components, as well as our custom stress test with Prime95 / Furmark, and noted the peak as well as idling power consumption at the wall.
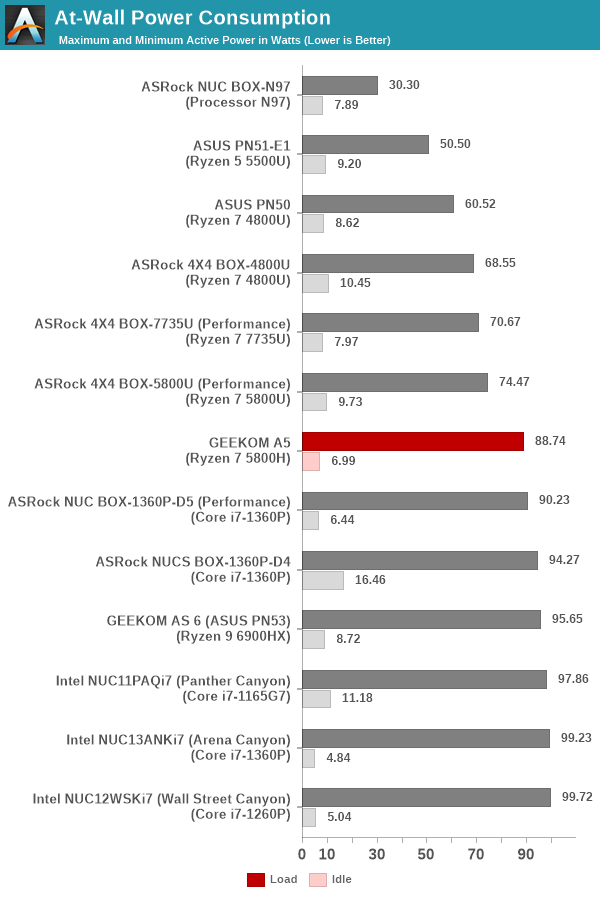
The numbers are consistent with the TDP and configured power limit values for the processors in the systems, and do not come as any surprise. However, it must be noted that the A5 is very power efficient. In fact, it has the lowest idle power of any AMD-based system we have evaluated before.
Stress Testing
Our thermal stress routine is a combination of Prime95, Furmark, and Finalwire’s AIDA64 System Stability Test. The following 9-step sequence is followed, starting with the system at idle:
- Start with the Prime95 stress test configured for maximum power consumption
- After 30 minutes, add Furmark GPU stress workload
- After 30 minutes, terminate the Prime95 workload
- After 30 minutes, terminate the Furmark workload and let the system idle
- After 30 minutes of idling, start the AIDA64 System Stress Test (SST) with CPU, caches, and RAM activated
- After 30 minutes, terminate the previous AIDA64 SST and start a new one with the GPU, CPU, caches, and RAM activated
- After 30 minutes, terminate the previous AIDA64 SST and start a new one with only the GPU activated
- After 30 minutes, terminate the previous AIDA64 SST and start a new one with the CPU, GPU, caches, RAM, and SSD activated
- After 30 minutes, terminate the AIDA64 SST and let the system idle for 30 minutes
Traditionally, this test used to record the clock frequencies – however, with the increasing number of cores in modern processors and fine-grained clock control, frequency information makes the graphs cluttered and doesn’t contribute much to understanding the thermal performance of the system. The focus is now on the power consumption and temperature profiles to determine if throttling is in play.
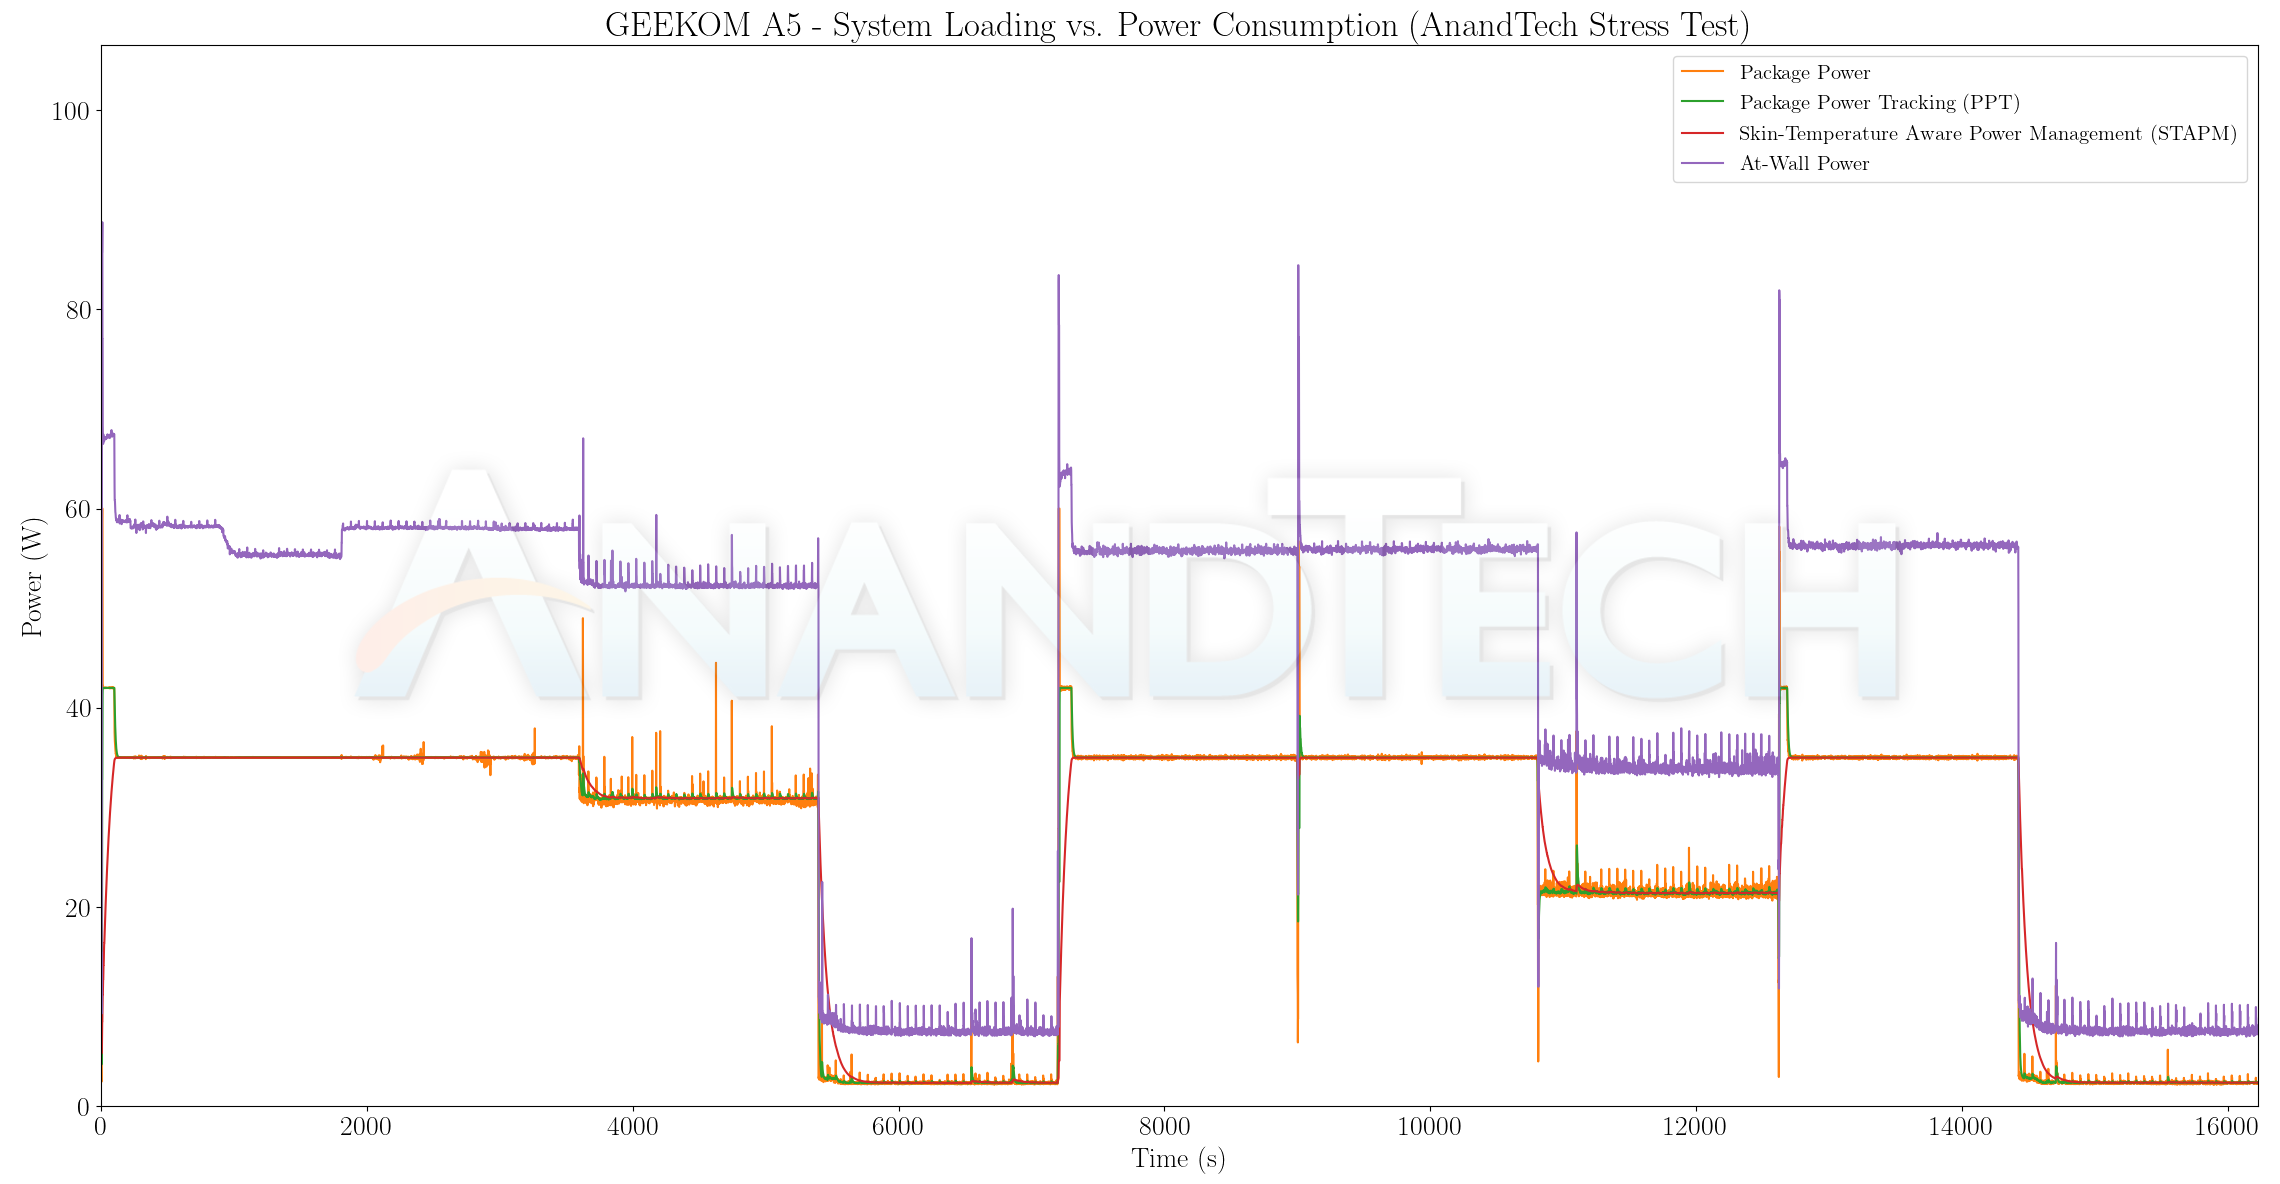
The A5’s thermal solution is easily able to sustain the 35W power limit for an extended duration. There are spikes to 60W / 42W in the initial stages when coming out of idle, but those are not sustained beyond a few seconds. The at-wall power consumption peaks at around 85W, but is more around 60W under sustained stress.
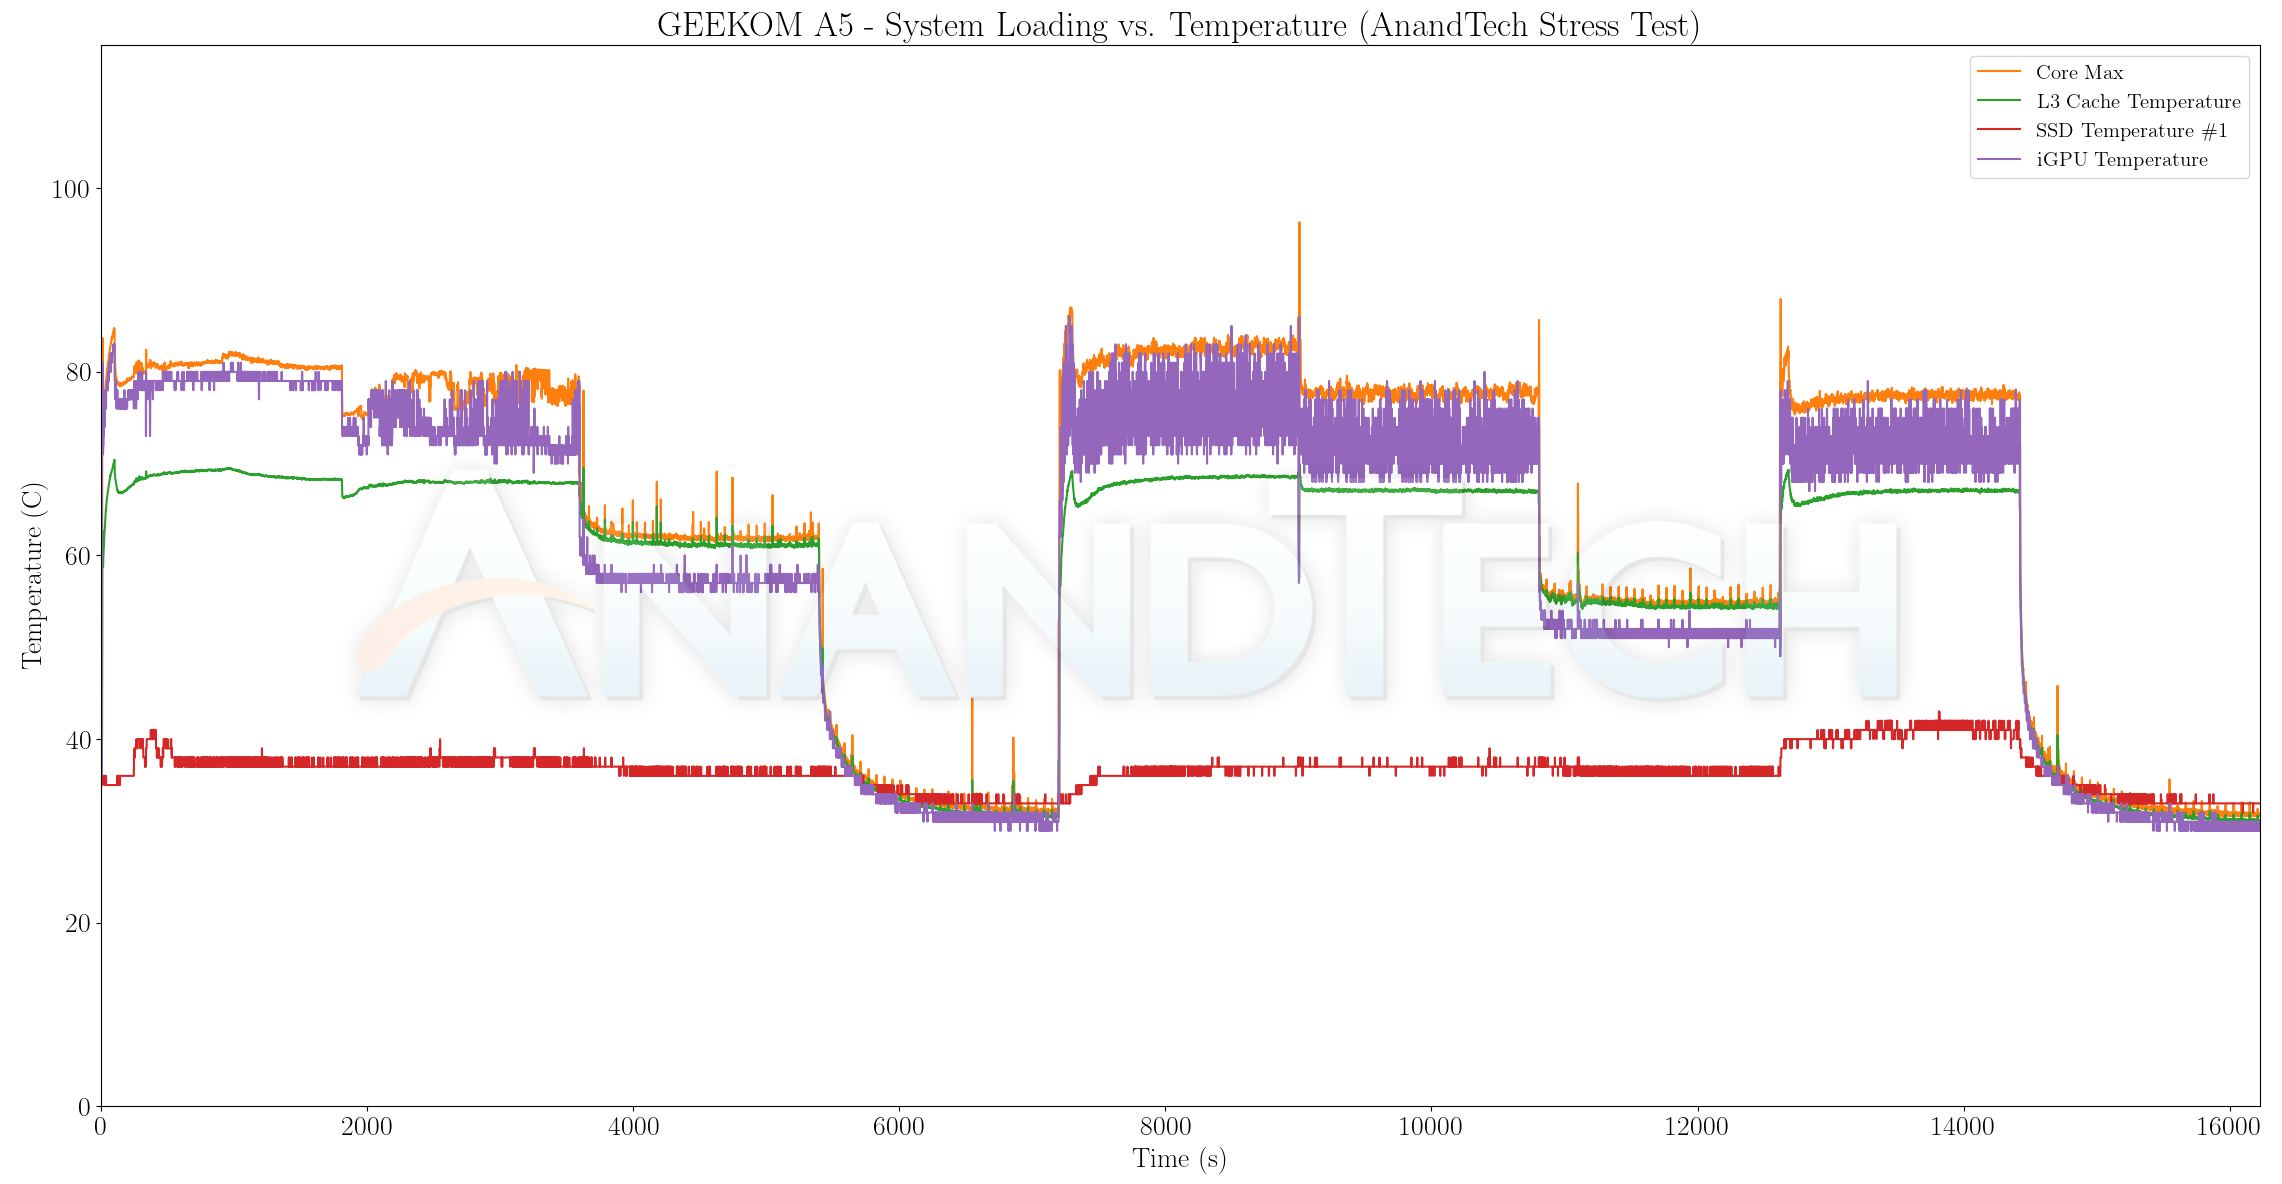
On the temperature front, the thermal solution leaves us with no cause for concern. The core temperature barely passes 85C under the worst of conditions, and the SSD temperature is also less than 50C even under disk stress conditions. The cores idle around 35C.
Based on our evaluation of the thermal solutions for different small form-factor systems, it appears that this form-factor best fits a 35W or 40W TDP processor. We have seen GEEKOM previously limiting installed SoCs to 35W. The BIOS does allow modification of this number, so a 40W configuration could be an interesting solution to explore.
Networking and storage are aspects that may be of vital importance in specific PC use-cases. The GEEKOM A5 is equipped with a 2T2R Realtek Wi-Fi 6 solution that also includes Bluetooth 5.2 support. There is also a 2.5 Gbps RJ-45 port backed by a Realtek PCIe NIC.
On the storage side, the GEEKOM A5 came pre-configured with a Lexar NM620 512GB M.2 2280 PCIe 3.0 x4 NVMe SSD. It must be noted that this NM620 is a newer version with changed NAND and controller compared the one that received brickbats from multiple reviewers at launch time. The older version used an InnoGrit controller along with Micron’s 96L 3D TLC. The newer version uses the Maxio MAP1202 DRAM-less controller along with 176L 3D TLC NAND from SK hynix. The SSD includes a dedicated thermal solution with a thermal pad affixed to the metal frame. Based on the construction, we should likely not be seeing any thermal throttling during usage. The system can also accommodate a 2.5″ 7mm drive and a M.2 2242 SATA SSD. From a benchmarking perspective, we provide results from the WPCstorage test of SPECworkstation 3.1. This benchmark replays access traces from various programs used in different verticals and compares the score against the one obtained with a 2017 SanDisk 512GB SATA SSD in the SPECworkstation 3.1 reference system.
| SPECworkstation 3.1.0 – WPCstorage SPEC Ratio Scores | |||
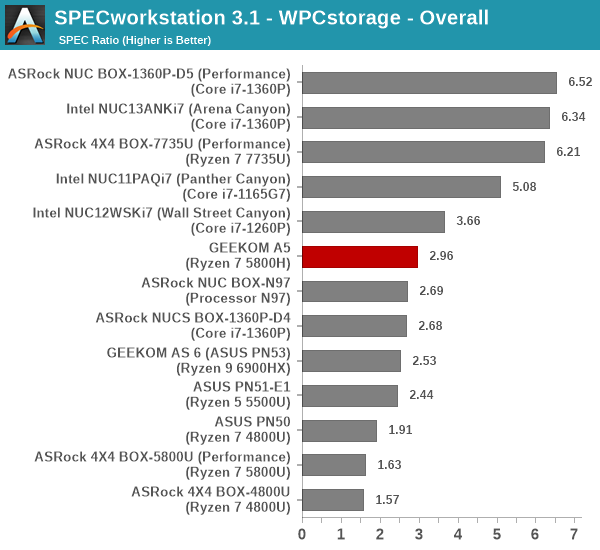
The graphs above present results for different verticals, as grouped by SPECworkstation 3.1. The storage workload consists of 60 subtests. Access traces from CFD solvers and programs such as Catia, Creo, and Soidworks come under ‘Product Development’. Storage access traces from the NAMD and LAMMPS molecular dynamics simulator are under the ‘Life Sciences’ category. ‘General Operations’ includes access traces from 7-Zip and Mozilla programs. The ‘Energy’ category replays traces from the energy-02 SPECviewperf workload. The ‘Media and Entertainment’ vertical includes Handbrake, Maya, and 3dsmax. Given that the comparison is between a wide range of SSDs in the systems – including both Gen 3 and Gen 4 NVMe drives, the relative numbers for most workloads are not surprising. The NM620 in the GEEKOM A5 delivers the best numbers in its category (Gen 3 / DRAM-less). The use of newer generation NAND is one of the major reasons behind this.
Closing Thoughts
The GEEKOM A5 provided us with the opportunity to evaluate a system with a slightly dated processor complemented by a newer SSD. AMD’s Cezanne is a known quantity in terms of performance, and the GEEKOM A5 manages to deliver on those expectations. The key selling point of the system is its pricing. Consumers are paying less than half of what they would have paid in 2021 for the same performance. The segment where the A5 trips up is on connectivity. Phoenix- and Raptor Lake-based systems with ‘equivalent’ processors are now equipped with USB4 ports that have PCIe tunneling support. This is an aspect that is unfortunately absent in the A5. However, from the same perspective, GEEKOM wants to present this as a slight step-up from Alder Lake-N-based systems, and those don’t carry USB4 ports either.
GEEKOM’s systems have traditionally adopted a conservative approach to configuring package power limits for their systems. The GEEKOM AS 6‘s Ryzen 9 6900HX was configured with a 35W package power limit, and the GEEKOM A5 is also configured similarly despite its slightly smaller footprint. Based on our benchmarking results, it appears that the Ryzen 7 5800H needs a 45W TDP configuration to better previous Cezanne-based UCFF PCs. The silver lining is that the fan noise is not overwhelming. Interested consumers may want to tweak the power limit settings in the BIOS.
The GEEKOM A5’s pricing makes it a winner from a value proposition perspective. The system is currently available for US $399 on Amazon and US $359 (after a $40 off coupon code anandtecha540) direct from the company’s web store. At these price points, consumers are not going to be able to source fully configured Raptor Lake-P or Phoenix-based UCFF systems.
In terms of scope for improvement, GEEKOM should explore the possibility of a more aggressive thermal solution capable of handling 45W over a long duration in the same form-factor. Other than that, it is difficult to suggest improvement aspects for systems such as the A5. The product is clearly leftover inventory from the company’s OEM / ODM business. Thanks to the price point of the system, that is actually a good thing for consumers looking for performance without breaking the bank.